| Param | Original file | Final file |
|---|---|---|
| Filename | modeM0/AS1A07_065T01_9000003338_22462cztM0_level2.evt | modeM0/AS1A07_065T01_9000003338_22462cztM0_level2_quad_clean.evt |
| Size (bytes) | 501,765,120 | 69,310,080 |
| Size | 478.5 MB | 66.1 MB |
| Events in quadrant A | 3,368,538 | 420,307 |
| Events in quadrant B | 4,489,963 | 411,085 |
| Events in quadrant C | 3,456,499 | 406,966 |
| Events in quadrant D | 3,438,328 | 404,975 |
| Mode SS | |||
|---|---|---|---|
| Quadrant | BADHDUFLAG | Total packets | Discarded packets |
| A | 0 | 132 | 0 |
| B | 0 | 132 | 0 |
| C | 0 | 132 | 0 |
| D | 0 | 132 | 0 |
| Mode M0 | |||
|---|---|---|---|
| Quadrant | BADHDUFLAG | Total packets | Discarded packets |
| A | 0 | 14294 | 2 |
| B | 0 | 17859 | 2 |
| C | 0 | 14579 | 3 |
| D | 0 | 14707 | 2 |
| Mode M9 | |||
|---|---|---|---|
| Quadrant | BADHDUFLAG | Total packets | Discarded packets |
| A | 0 | 18 | 0 |
| B | 0 | 19 | 0 |
| C | 0 | 19 | 0 |
| D | 0 | 19 | 0 |
| Quadrant | Total seconds | Saturated seconds | Saturation percentage |
|---|---|---|---|
| A | 6527 | 65 | 0.995863% |
| B | 6527 | 147 | 2.252183% |
| C | 6526 | 126 | 1.930739% |
| D | 6526 | 71 | 1.087956% |
Noise dominated data is calculated using 1-second bins in cleaned event files. If a bin has >2000 counts, and if more than 50% of those come from <1% of pixels, then it is considered to be noise-dominated and hence unusable.
| Quadrant | # 1 sec bins | Bins with >0 counts | Bins with >2000 counts | High rate bins dominated by noise | Noise dominated (total time) | Noise dominated (detector-on time) | Marked lightcurve |
|---|---|---|---|---|---|---|---|
| A | 7682 | 6527 | 0 | 0 | 0.00% | 0.00% | 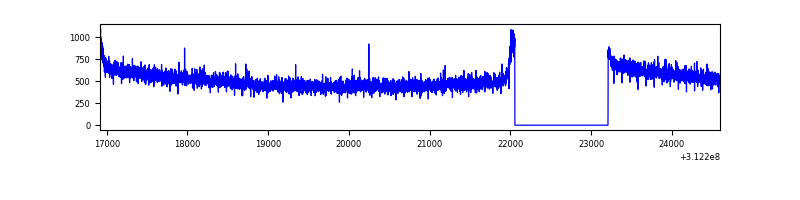 |
| B | 7682 | 6527 | 32 | 32 | 0.42% | 0.49% | 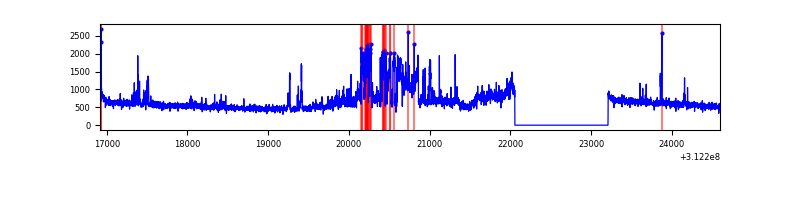 |
| C | 7681 | 6526 | 0 | 0 | 0.00% | 0.00% | 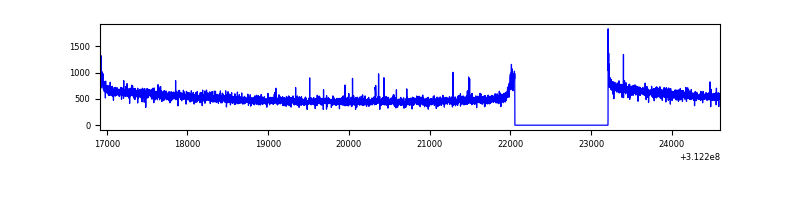 |
| D | 7681 | 6526 | 13 | 13 | 0.17% | 0.20% | 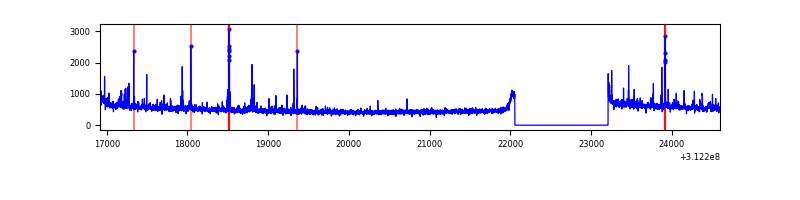 |
Top three noisy pixels from each quadrant. If the there are fewer than three noisy pixels in the level2.evt file, extra rows are filled as -1
| Pixel properties | Quadrant properties | ||||||
|---|---|---|---|---|---|---|---|
| Quadrant | DetID | PixID | Counts | Sigma | Mean | Median | Sigma |
| A | 13 | 254 | 9674 | 49.98 | 872 | 853 | 176.5 |
| A | 0 | 226 | 7564 | 38.02 | 872 | 853 | 176.5 |
| A | 3 | 137 | 7315 | 36.61 | 872 | 853 | 176.5 |
| B | 0 | 244 | 1023482 | 6284.42 | 863 | 843 | 162.7 |
| B | 0 | 190 | 42761 | 257.6 | 863 | 843 | 162.7 |
| B | 12 | 111 | 19214 | 112.9 | 863 | 843 | 162.7 |
| C | 14 | 238 | 135006 | 678.5 | 846 | 852 | 197.7 |
| C | 0 | 10 | 12320 | 58.0 | 846 | 852 | 197.7 |
| C | 9 | 54 | 11433 | 53.51 | 846 | 852 | 197.7 |
| D | 1 | 52 | 99437 | 475.03 | 861 | 837 | 207.6 |
| D | 2 | 234 | 29550 | 138.33 | 861 | 837 | 207.6 |
| D | 13 | 249 | 24202 | 112.57 | 861 | 837 | 207.6 |
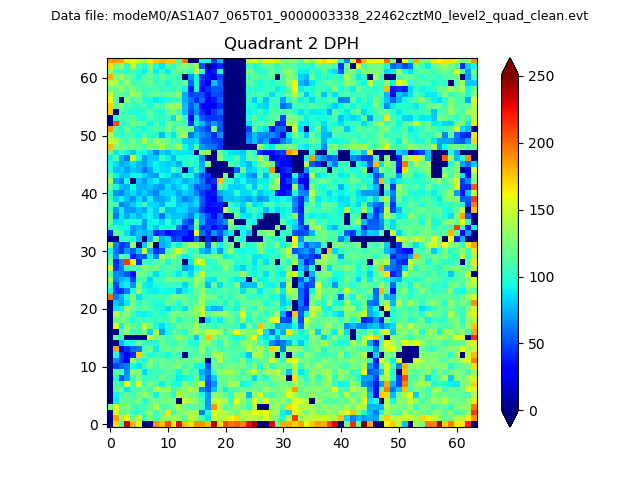
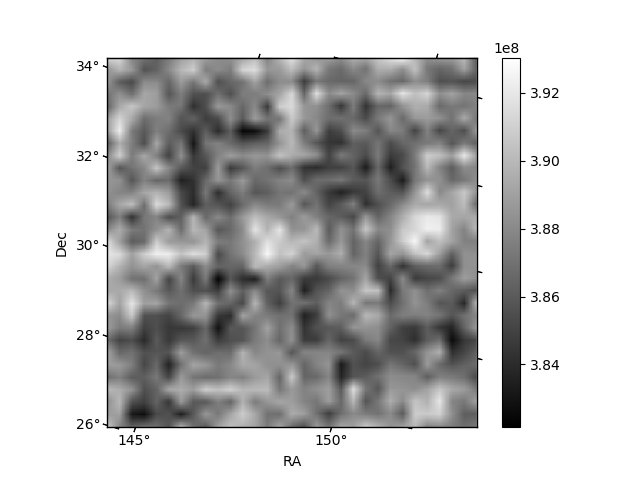
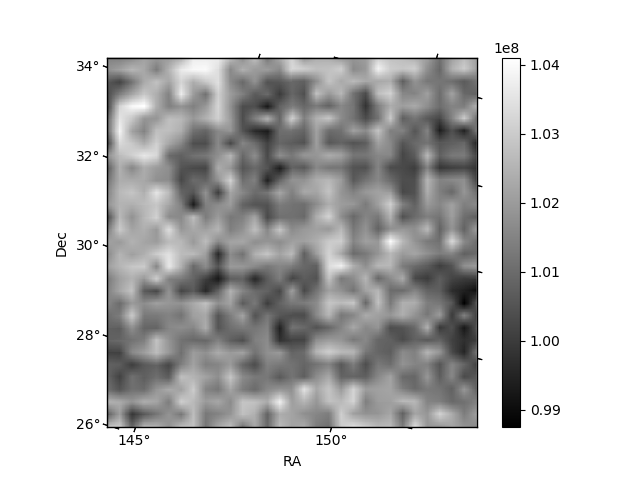
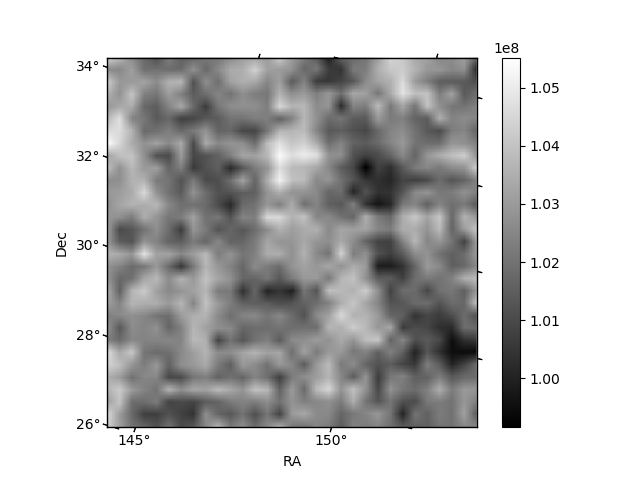
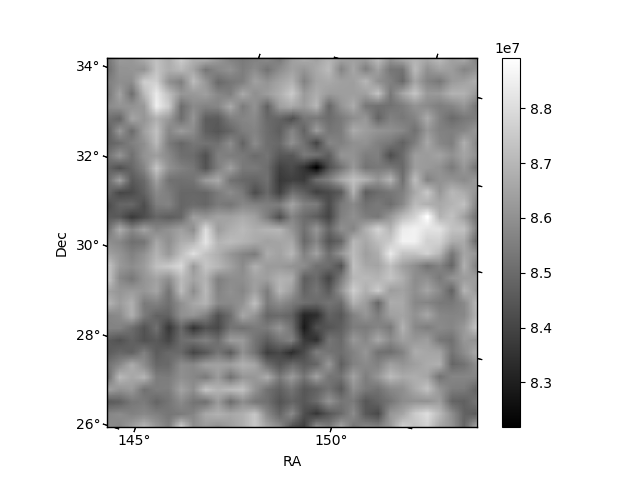
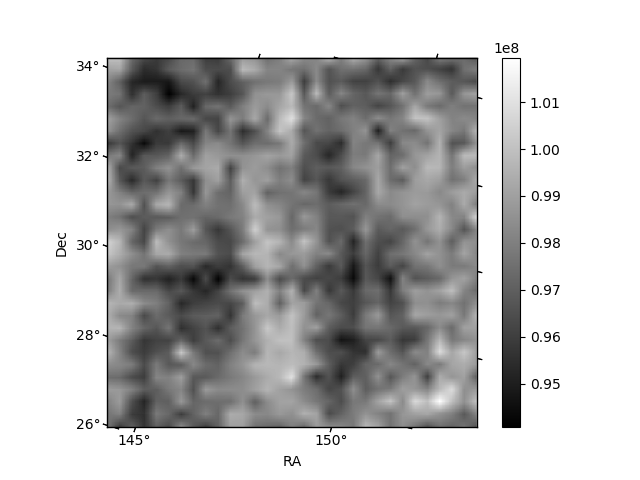
Histogram calculated using DETX and DETY for each event in the final _common_clean file
| Quadrant A | 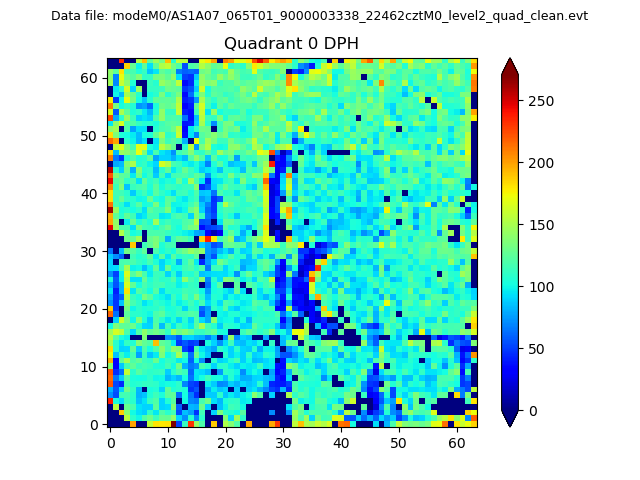 |
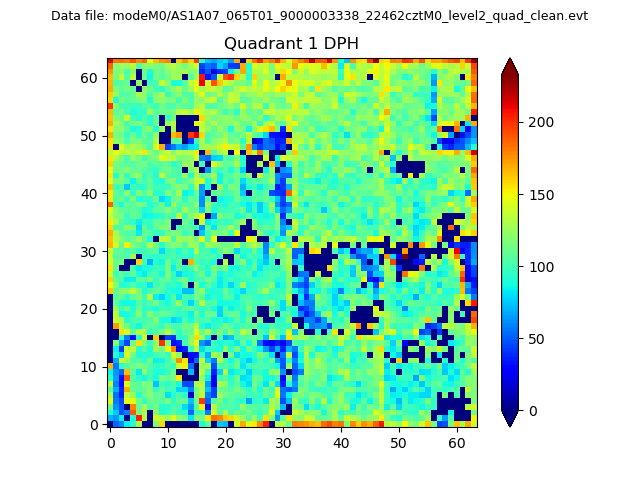 |
Quadrant B |
|---|---|---|---|
| Quadrant D | 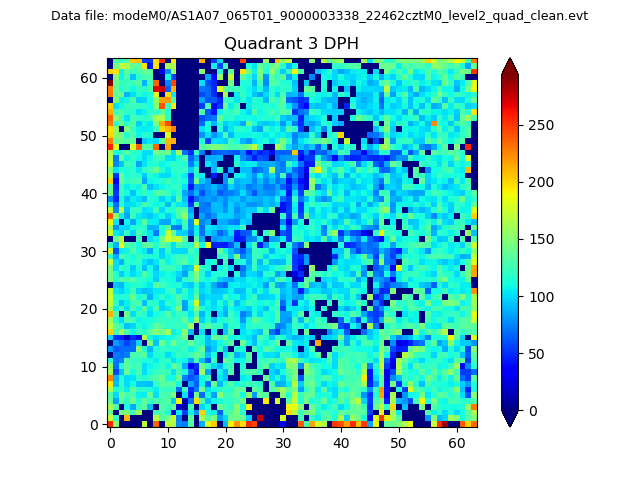 |
 |
Quadrant C |
| Plot type | Count rate plots | Images |
|---|---|---|
| Comparison with Poisson distribution Blue bars denote a histogram of data divided into 1 sec bins. Red curve is a Poisson curve with rate = median count rate of data. |
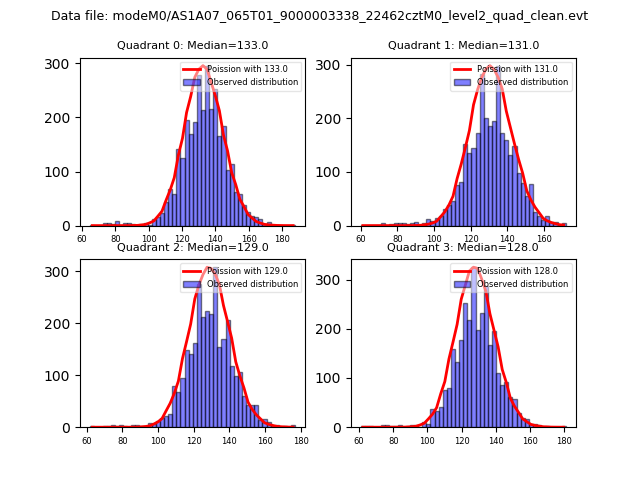 |
 |
| Quadrant-wise count rates Data is divided into 100 sec bins |
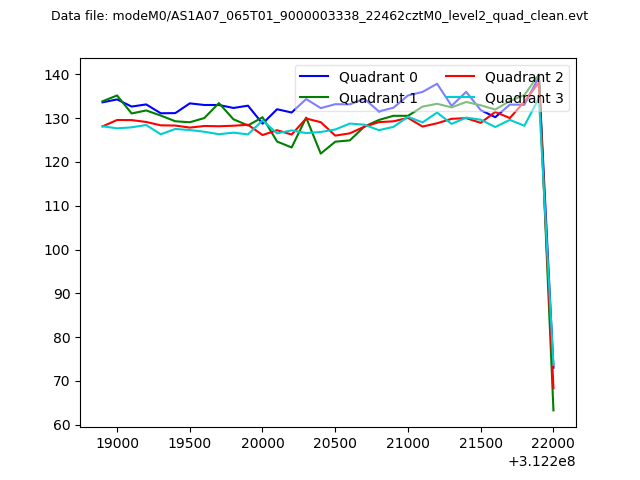 |
|
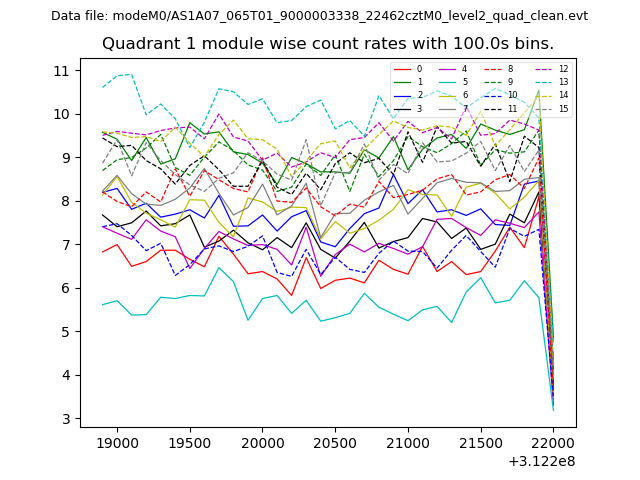
| Module-wise count rates for Quadrant A Data is divided into 100 sec bins |
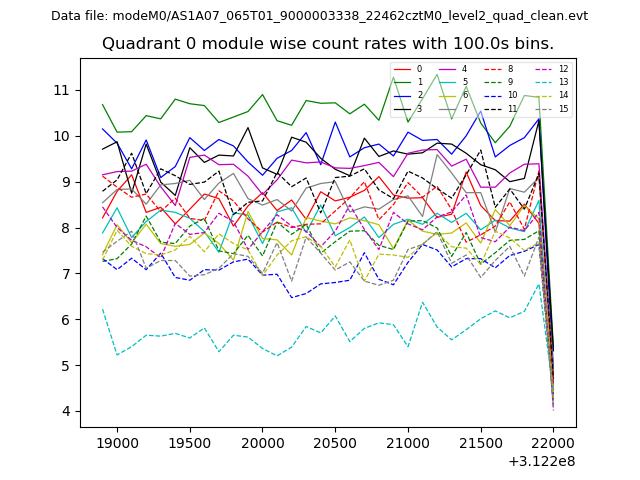 |
 |
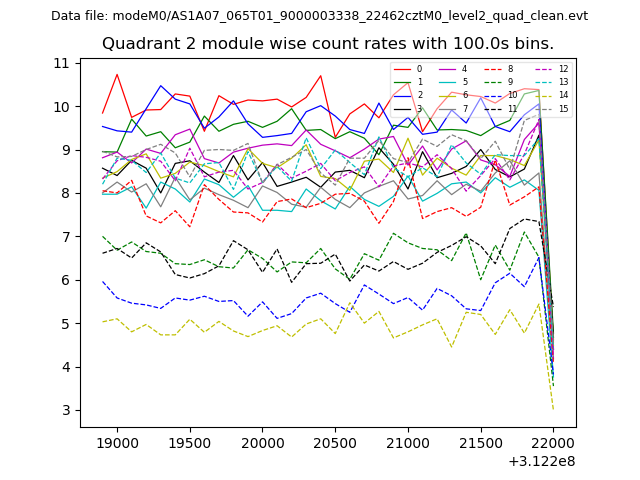
| Module-wise count rates for Quadrant B Data is divided into 100 sec bins |
 |
 |
| Module-wise count rates for Quadrant C Data is divided into 100 sec bins |
 |
 |
| Module-wise count rates for Quadrant D Data is divided into 100 sec bins |
 |
 |
| Parameter | Plot |
|---|---|
| CZT HV Monitor | 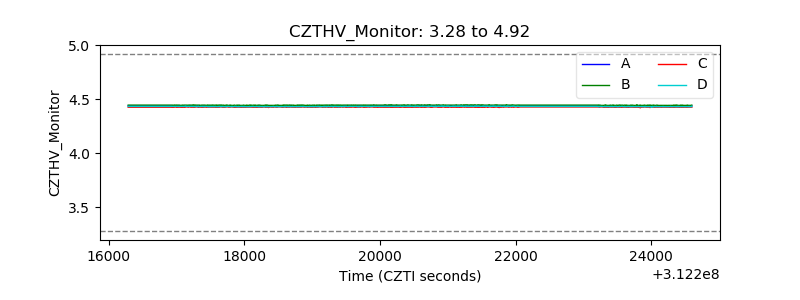 |
| D_VDD | 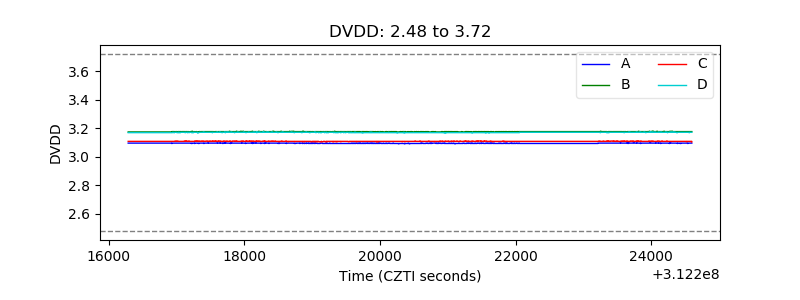 |
| Temperature 1 | 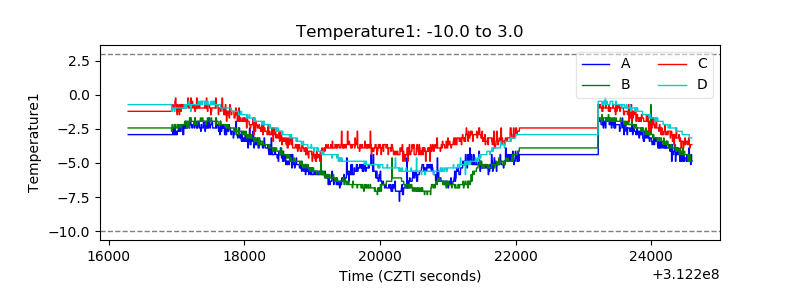 |
| Veto HV Monitor | 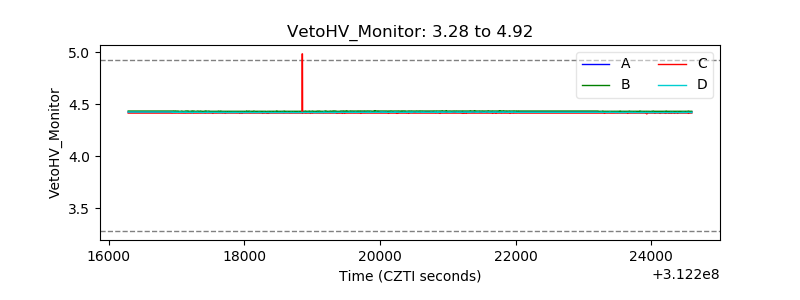 |
| Veto LLD | 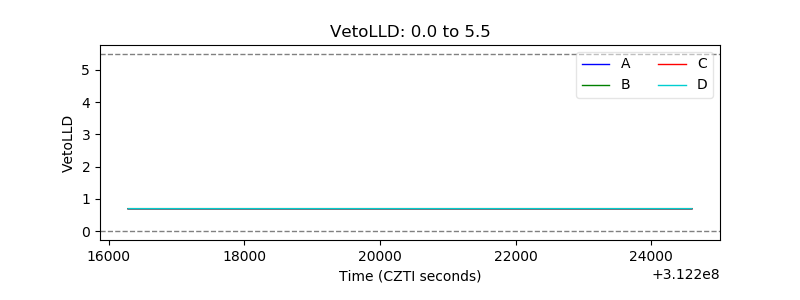 |
| Alpha Counter | 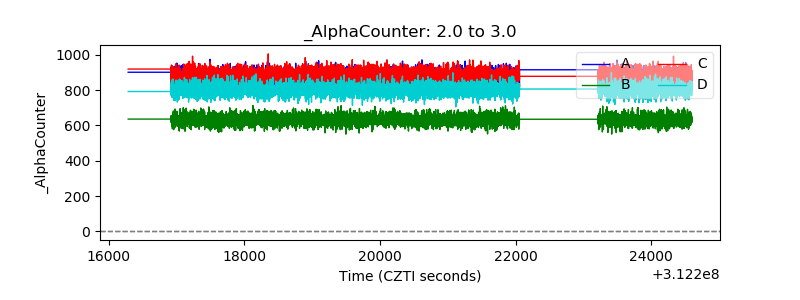 |
| _CPM_Rate | 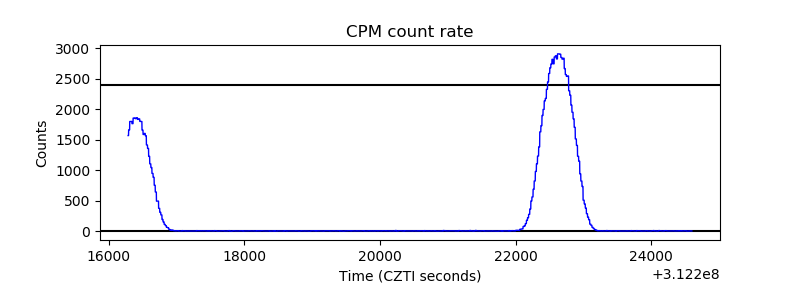 |
| CZT Counter | 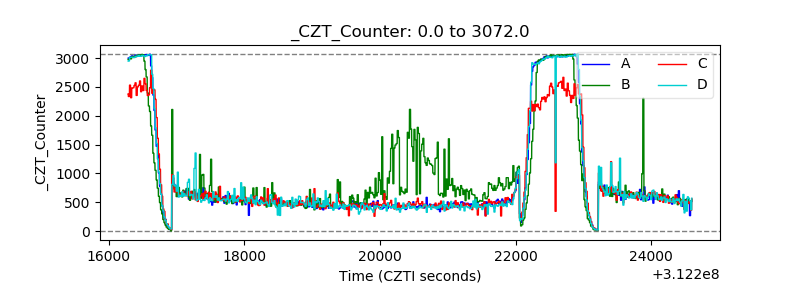 |
| +2.5 Volts monitor |  |
| +5 Volts monitor | 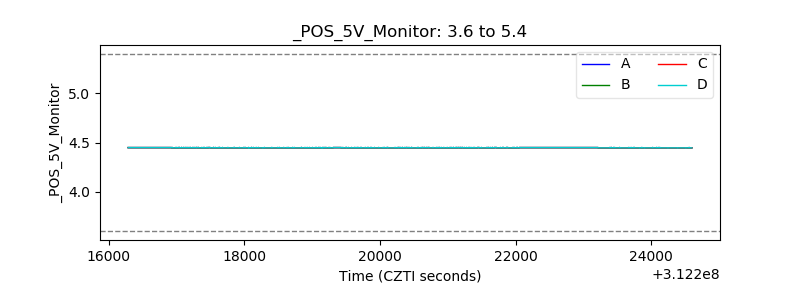 |
| _ROLL_ROT | 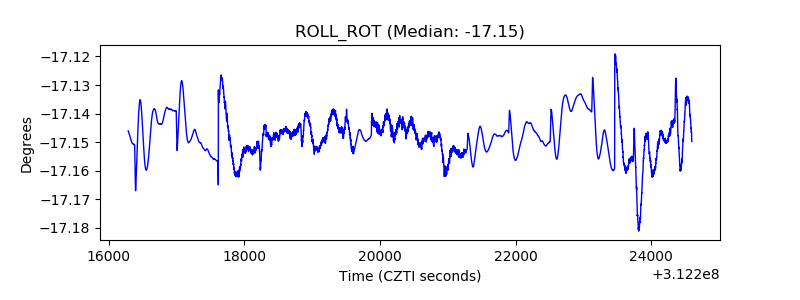 |
| _Roll_DEC | 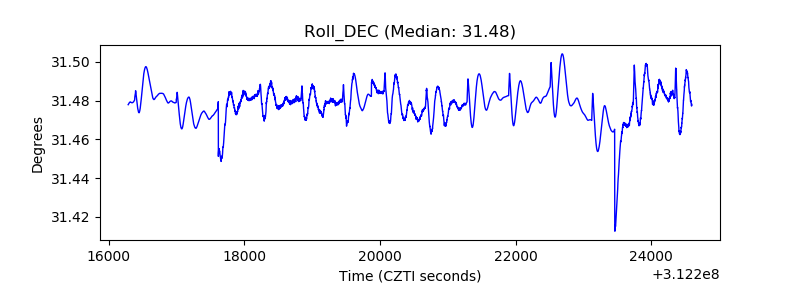 |
| _Roll_RA | 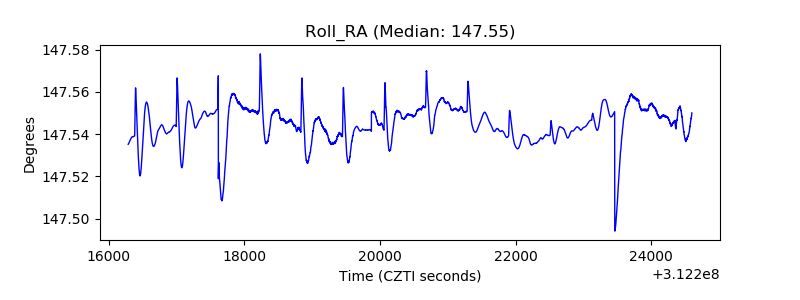 |
| Veto Counter | 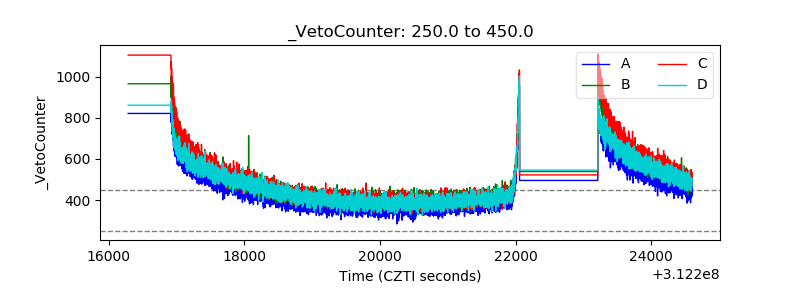 |