| Param | Original file | Final file |
|---|---|---|
| Filename | modeM0/AS1A07_065T01_9000003338_22463cztM0_level2.evt | modeM0/AS1A07_065T01_9000003338_22463cztM0_level2_quad_clean.evt |
| Size (bytes) | 494,409,600 | 80,156,160 |
| Size | 471.5 MB | 76.4 MB |
| Events in quadrant A | 3,350,474 | 503,430 |
| Events in quadrant B | 4,244,339 | 501,921 |
| Events in quadrant C | 3,513,312 | 492,517 |
| Events in quadrant D | 3,438,059 | 489,906 |
| Mode SS | |||
|---|---|---|---|
| Quadrant | BADHDUFLAG | Total packets | Discarded packets |
| A | 0 | 128 | 0 |
| B | 0 | 128 | 0 |
| C | 0 | 128 | 0 |
| D | 0 | 128 | 0 |
| Mode M0 | |||
|---|---|---|---|
| Quadrant | BADHDUFLAG | Total packets | Discarded packets |
| A | 0 | 14233 | 2 |
| B | 0 | 17009 | 2 |
| C | 0 | 14665 | 3 |
| D | 0 | 14567 | 2 |
| Mode M9 | |||
|---|---|---|---|
| Quadrant | BADHDUFLAG | Total packets | Discarded packets |
| A | 0 | 19 | 0 |
| B | 0 | 20 | 0 |
| C | 0 | 20 | 0 |
| D | 0 | 20 | 0 |
| Quadrant | Total seconds | Saturated seconds | Saturation percentage |
|---|---|---|---|
| A | 6296 | 50 | 0.794155% |
| B | 6296 | 118 | 1.874206% |
| C | 6295 | 150 | 2.382844% |
| D | 6295 | 82 | 1.302621% |
Noise dominated data is calculated using 1-second bins in cleaned event files. If a bin has >2000 counts, and if more than 50% of those come from <1% of pixels, then it is considered to be noise-dominated and hence unusable.
| Quadrant | # 1 sec bins | Bins with >0 counts | Bins with >2000 counts | High rate bins dominated by noise | Noise dominated (total time) | Noise dominated (detector-on time) | Marked lightcurve |
|---|---|---|---|---|---|---|---|
| A | 7546 | 6296 | 0 | 0 | 0.00% | 0.00% | 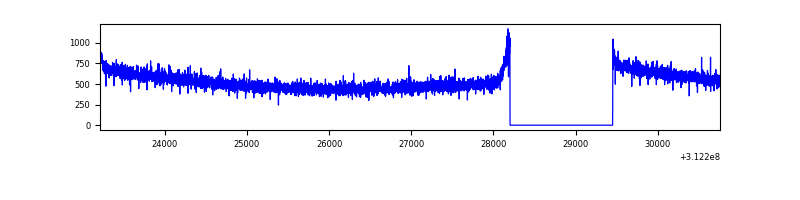 |
| B | 7546 | 6296 | 35 | 35 | 0.46% | 0.56% | 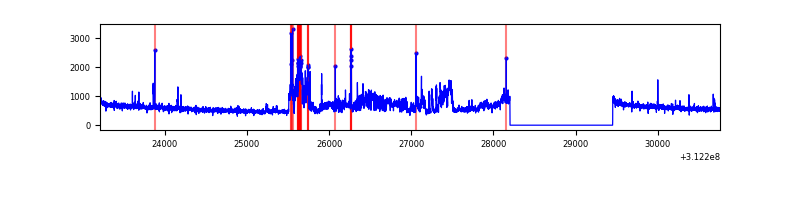 |
| C | 7545 | 6295 | 10 | 10 | 0.13% | 0.16% | 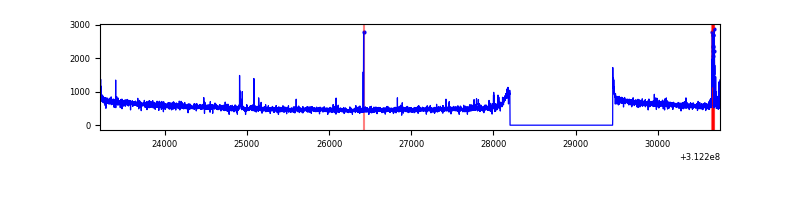 |
| D | 7545 | 6295 | 28 | 28 | 0.37% | 0.44% | 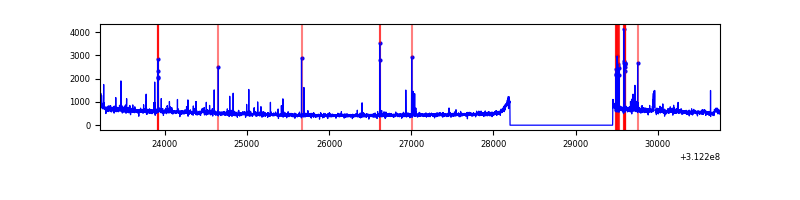 |
Top three noisy pixels from each quadrant. If the there are fewer than three noisy pixels in the level2.evt file, extra rows are filled as -1
| Pixel properties | Quadrant properties | ||||||
|---|---|---|---|---|---|---|---|
| Quadrant | DetID | PixID | Counts | Sigma | Mean | Median | Sigma |
| A | 15 | 174 | 32975 | 186.52 | 861 | 846 | 172.3 |
| A | 13 | 254 | 9128 | 48.08 | 861 | 846 | 172.3 |
| A | 0 | 226 | 7304 | 37.49 | 861 | 846 | 172.3 |
| B | 0 | 244 | 795310 | 4947.35 | 859 | 842 | 160.6 |
| B | 5 | 172 | 24836 | 149.42 | 859 | 842 | 160.6 |
| B | 0 | 197 | 19168 | 114.12 | 859 | 842 | 160.6 |
| C | 14 | 238 | 135517 | 695.88 | 839 | 847 | 193.5 |
| C | 10 | 22 | 83145 | 425.26 | 839 | 847 | 193.5 |
| C | 0 | 10 | 20138 | 99.68 | 839 | 847 | 193.5 |
| D | 1 | 52 | 106783 | 518.45 | 850 | 828 | 204.4 |
| D | 13 | 249 | 66502 | 321.35 | 850 | 828 | 204.4 |
| D | 2 | 234 | 27537 | 130.69 | 850 | 828 | 204.4 |
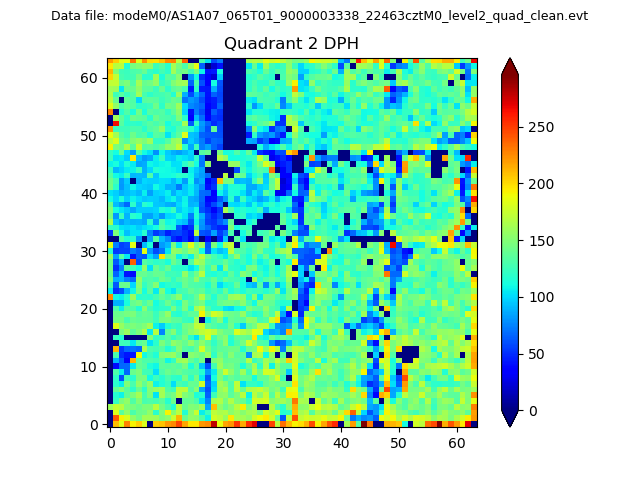
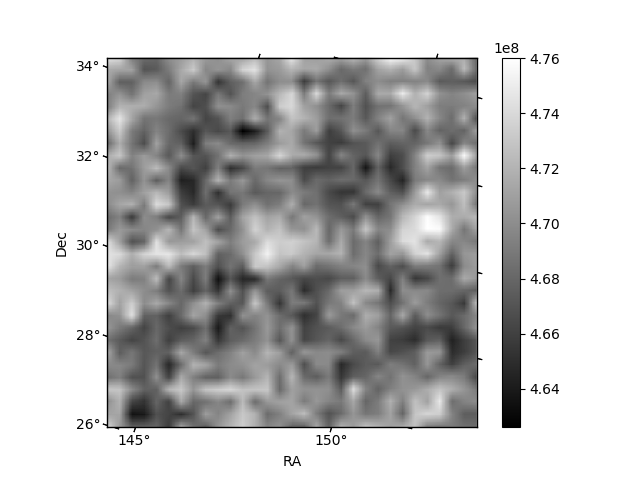
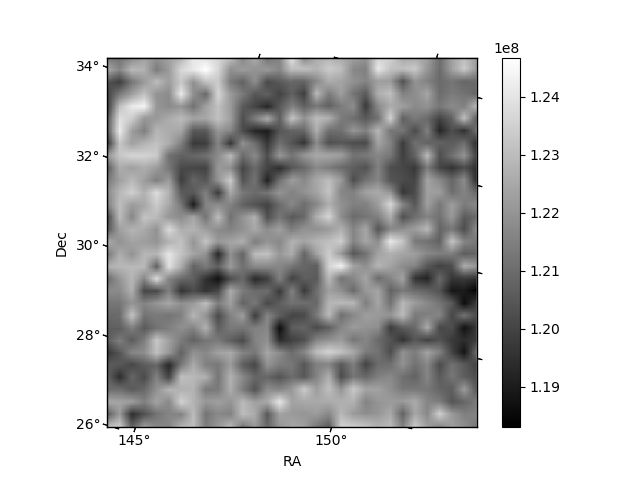
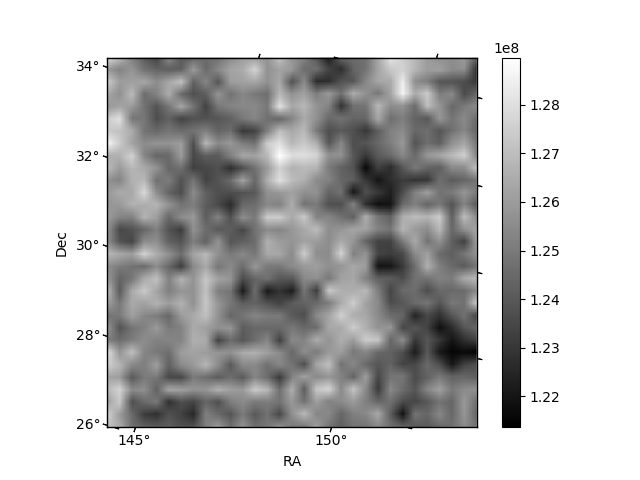
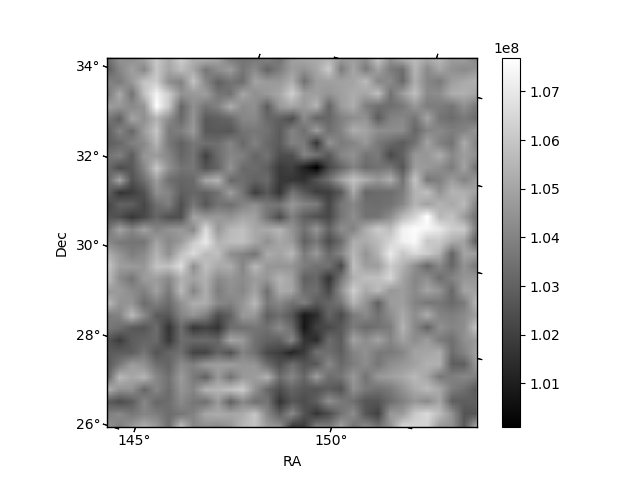
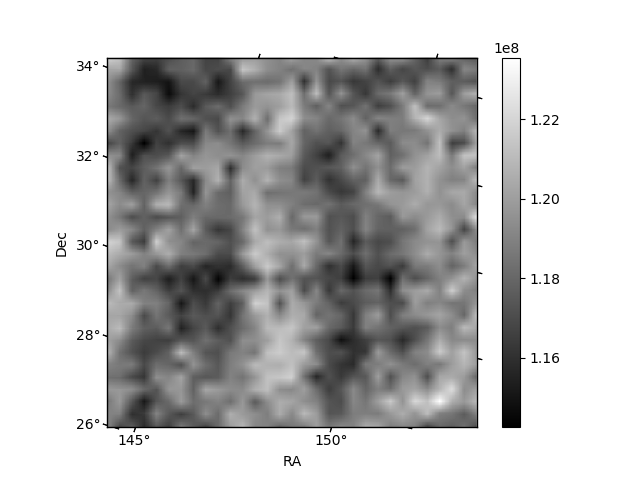
Histogram calculated using DETX and DETY for each event in the final _common_clean file
| Quadrant A | 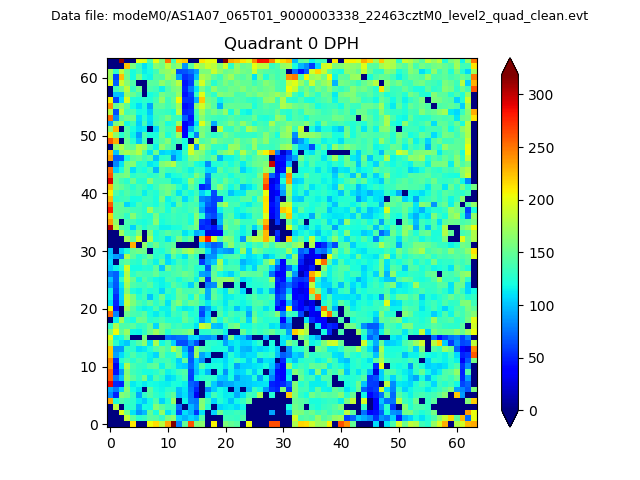 |
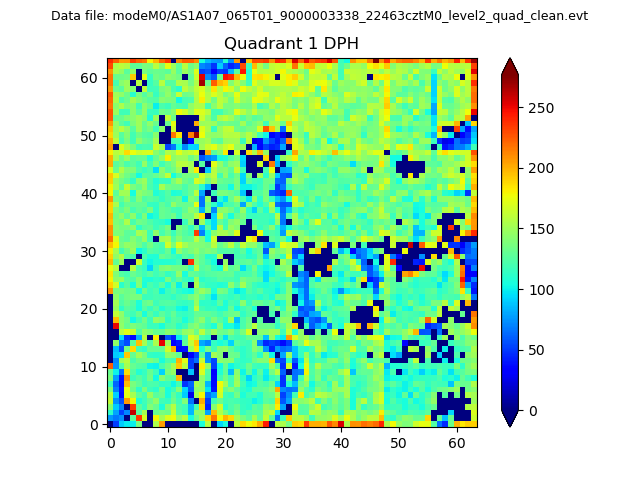 |
Quadrant B |
|---|---|---|---|
| Quadrant D | 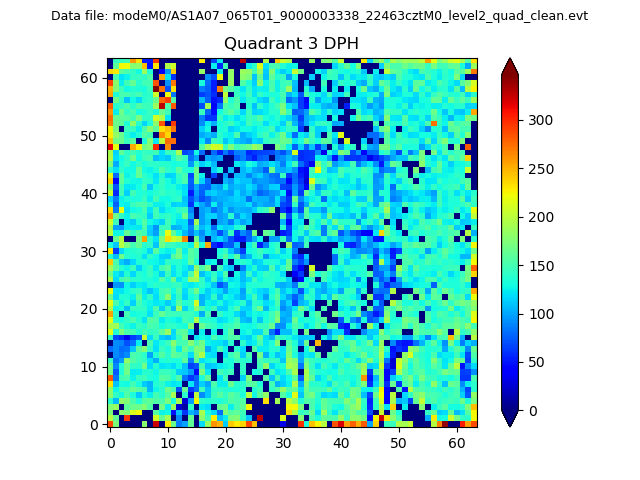 |
 |
Quadrant C |
| Plot type | Count rate plots | Images |
|---|---|---|
| Comparison with Poisson distribution Blue bars denote a histogram of data divided into 1 sec bins. Red curve is a Poisson curve with rate = median count rate of data. |
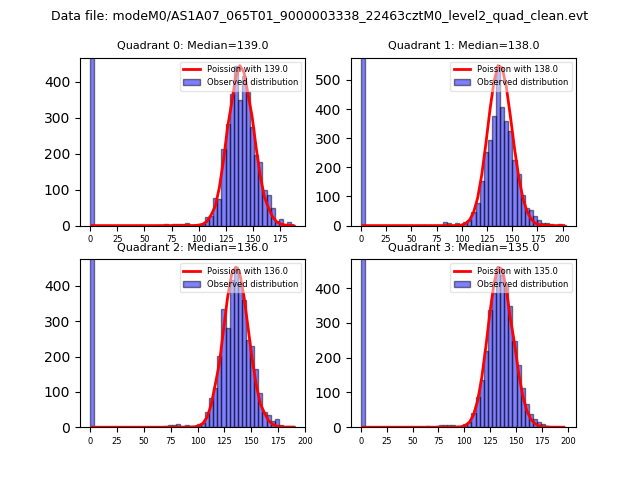 |
 |
| Quadrant-wise count rates Data is divided into 100 sec bins |
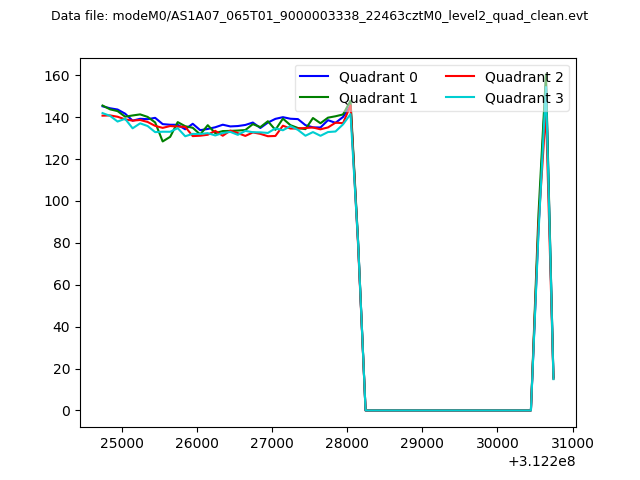 |
|
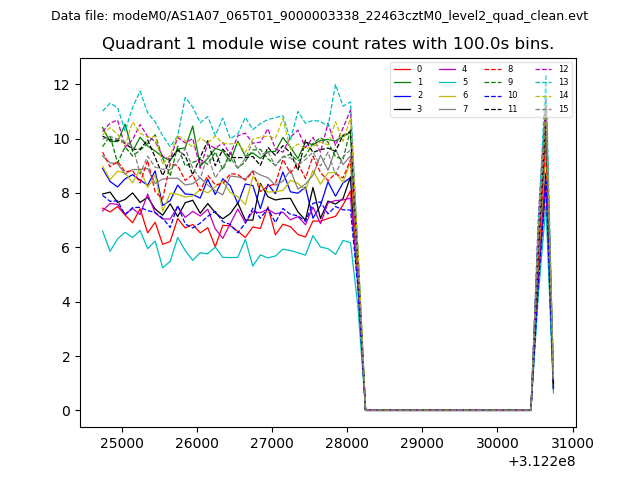
| Module-wise count rates for Quadrant A Data is divided into 100 sec bins |
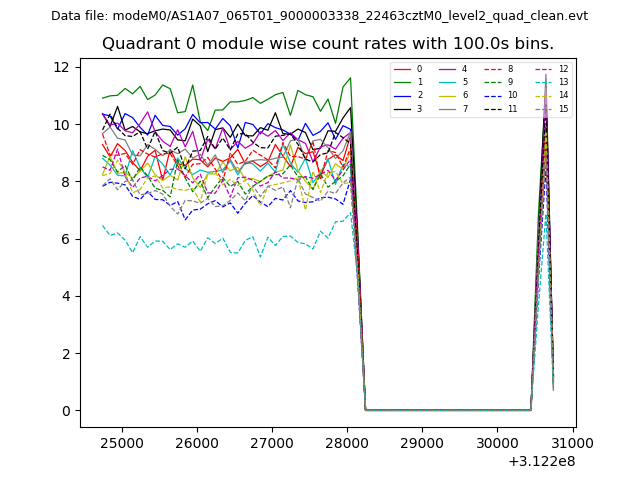 |
 |
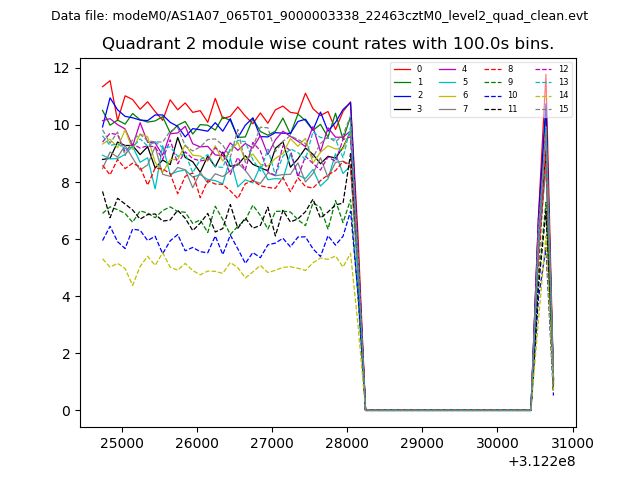
| Module-wise count rates for Quadrant B Data is divided into 100 sec bins |
 |
 |
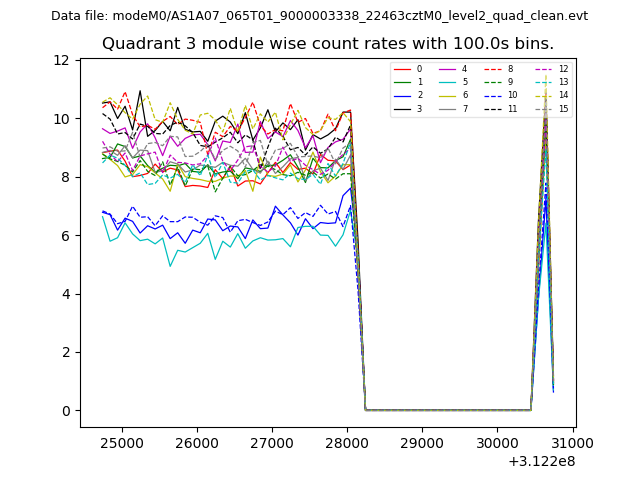
| Module-wise count rates for Quadrant C Data is divided into 100 sec bins |
 |
 |
| Module-wise count rates for Quadrant D Data is divided into 100 sec bins |
 |
 |
| Parameter | Plot |
|---|---|
| CZT HV Monitor | 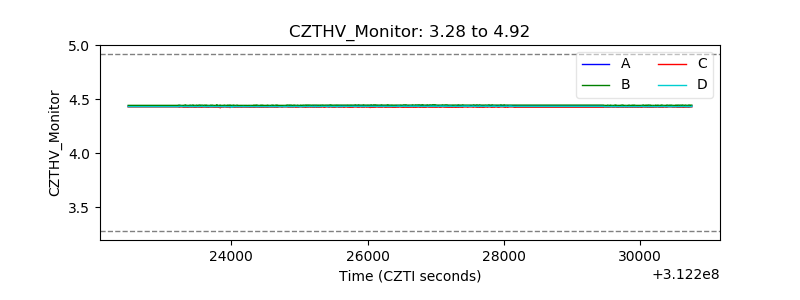 |
| D_VDD | 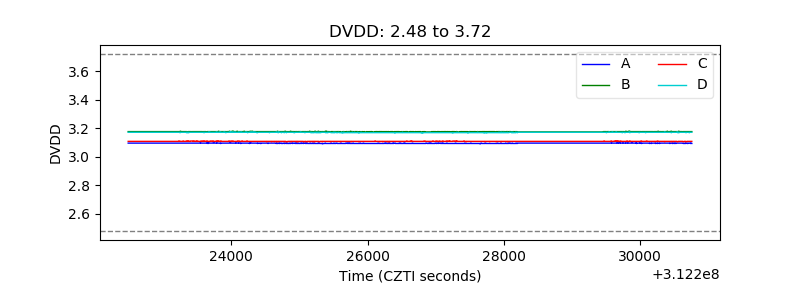 |
| Temperature 1 | 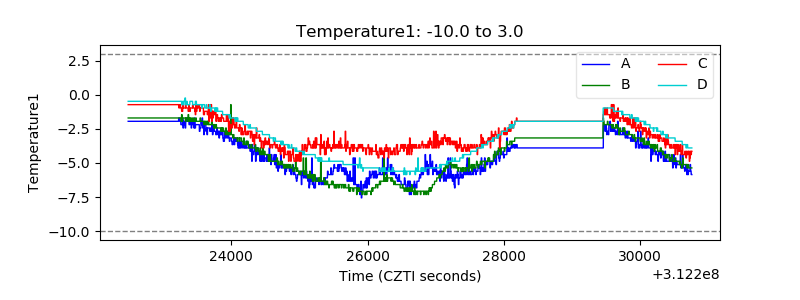 |
| Veto HV Monitor | 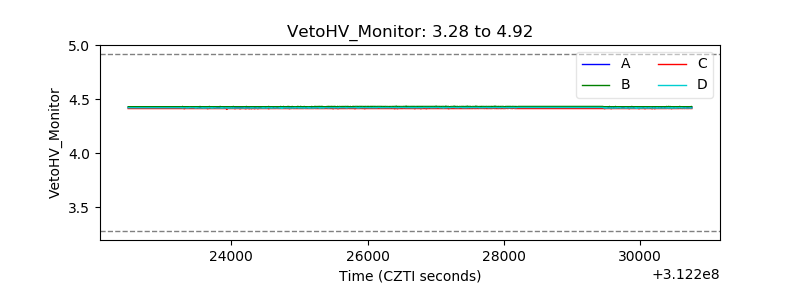 |
| Veto LLD | 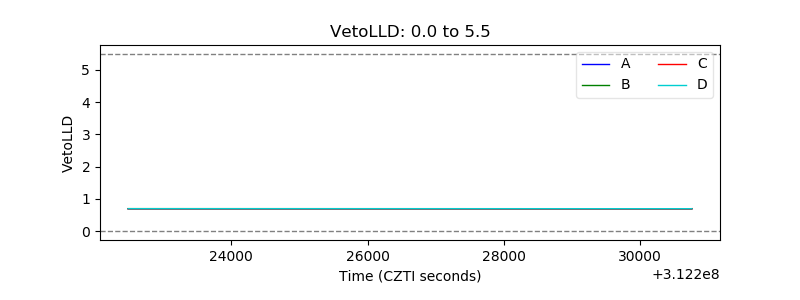 |
| Alpha Counter | 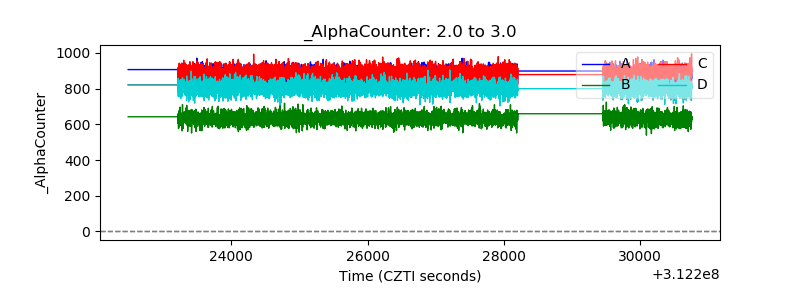 |
| _CPM_Rate | 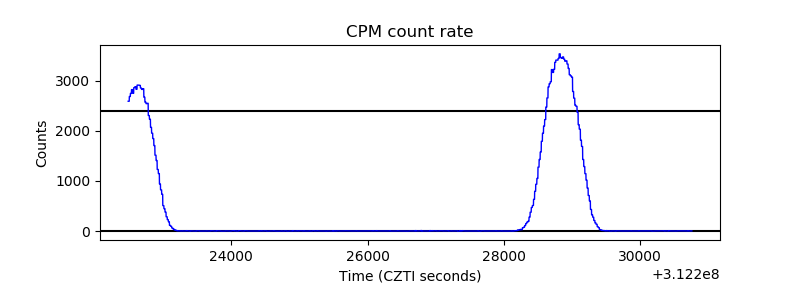 |
| CZT Counter | 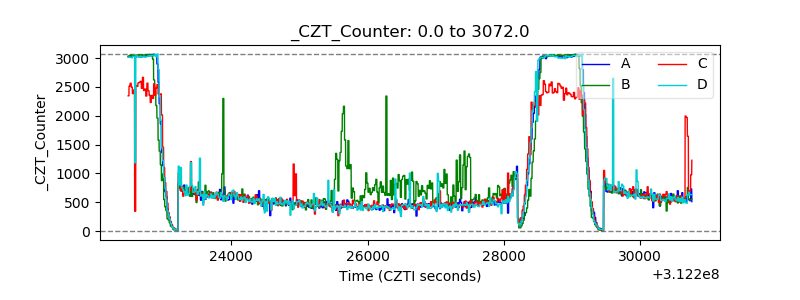 |
| +2.5 Volts monitor |  |
| +5 Volts monitor | 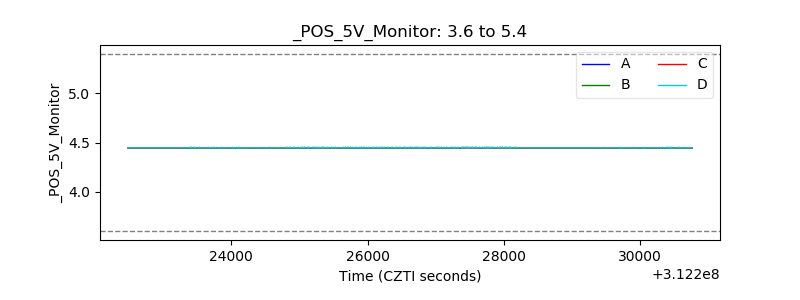 |
| _ROLL_ROT | 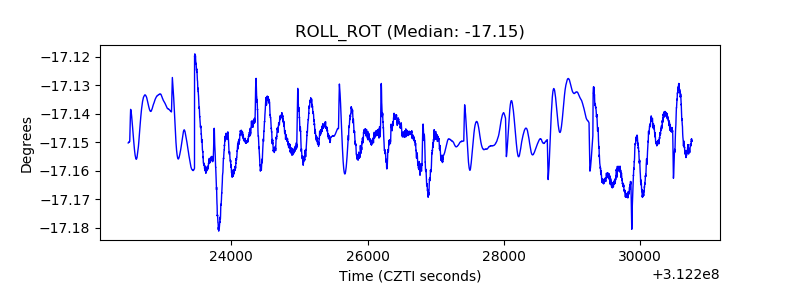 |
| _Roll_DEC | 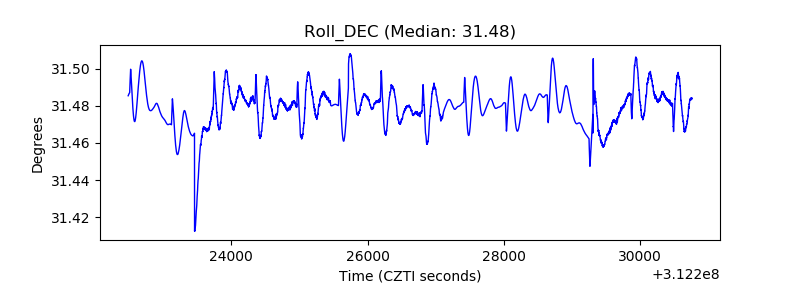 |
| _Roll_RA | 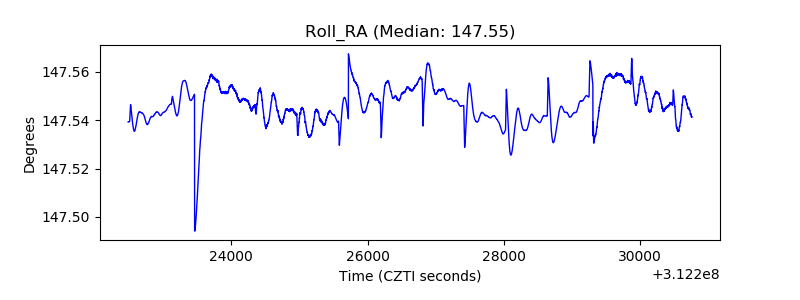 |
| Veto Counter | 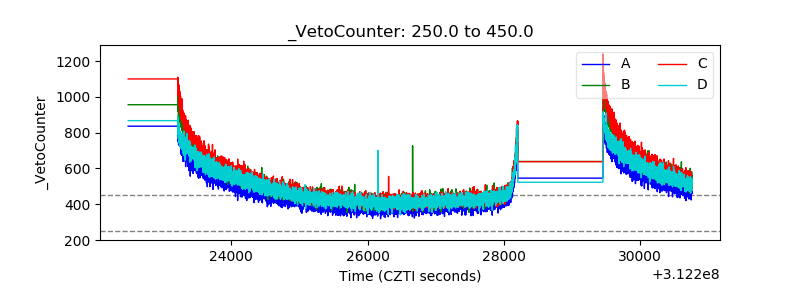 |