| Param | Original file | Final file |
|---|---|---|
| Filename | modeM0/AS1A07_065T01_9000003338_22467cztM0_level2.evt | modeM0/AS1A07_065T01_9000003338_22467cztM0_level2_quad_clean.evt |
| Size (bytes) | 466,191,360 | 105,972,480 |
| Size | 444.6 MB | 101.1 MB |
| Events in quadrant A | 3,258,416 | 690,467 |
| Events in quadrant B | 3,486,611 | 702,211 |
| Events in quadrant C | 3,359,359 | 673,691 |
| Events in quadrant D | 3,543,618 | 660,556 |
| Mode SS | |||
|---|---|---|---|
| Quadrant | BADHDUFLAG | Total packets | Discarded packets |
| A | 0 | 140 | 0 |
| B | 0 | 140 | 0 |
| C | 0 | 140 | 0 |
| D | 0 | 140 | 0 |
| Mode M0 | |||
|---|---|---|---|
| Quadrant | BADHDUFLAG | Total packets | Discarded packets |
| A | 0 | 14253 | 3 |
| B | 0 | 14661 | 2 |
| C | 0 | 14447 | 2 |
| D | 0 | 15318 | 2 |
| Mode M9 | |||
|---|---|---|---|
| Quadrant | BADHDUFLAG | Total packets | Discarded packets |
| A | 0 | 14 | 0 |
| B | 0 | 15 | 0 |
| C | 0 | 15 | 0 |
| D | 0 | 15 | 0 |
| Quadrant | Total seconds | Saturated seconds | Saturation percentage |
|---|---|---|---|
| A | 6928 | 21 | 0.303118% |
| B | 6928 | 32 | 0.461894% |
| C | 6928 | 76 | 1.096998% |
| D | 6928 | 44 | 0.635104% |
Noise dominated data is calculated using 1-second bins in cleaned event files. If a bin has >2000 counts, and if more than 50% of those come from <1% of pixels, then it is considered to be noise-dominated and hence unusable.
| Quadrant | # 1 sec bins | Bins with >0 counts | Bins with >2000 counts | High rate bins dominated by noise | Noise dominated (total time) | Noise dominated (detector-on time) | Marked lightcurve |
|---|---|---|---|---|---|---|---|
| A | 7908 | 6929 | 0 | 0 | 0.00% | 0.00% | 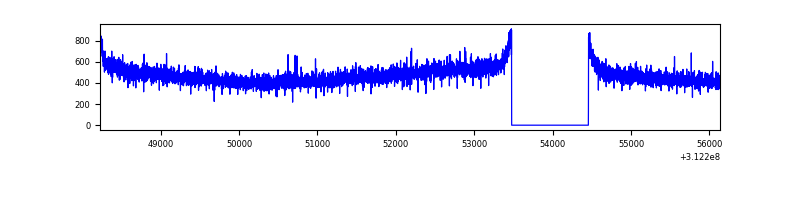 |
| B | 7908 | 6929 | 0 | 0 | 0.00% | 0.00% | 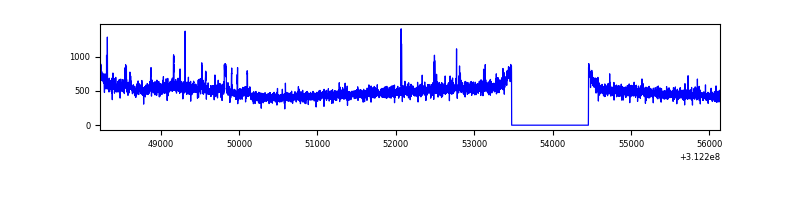 |
| C | 7908 | 6929 | 9 | 9 | 0.11% | 0.13% | 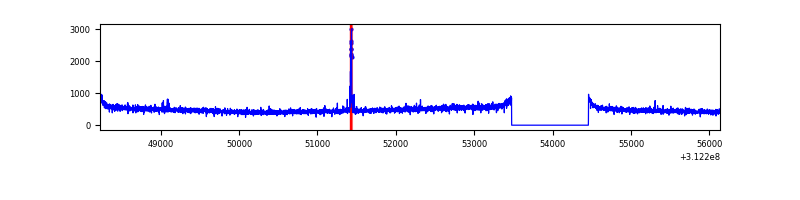 |
| D | 7908 | 6929 | 21 | 21 | 0.27% | 0.30% | 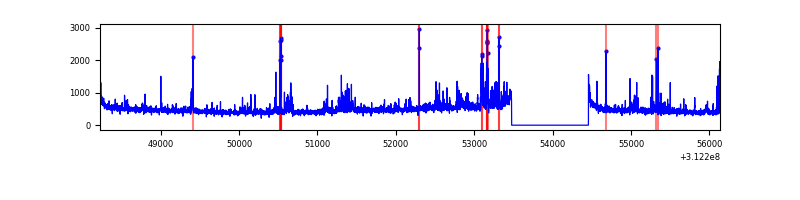 |
Top three noisy pixels from each quadrant. If the there are fewer than three noisy pixels in the level2.evt file, extra rows are filled as -1
| Pixel properties | Quadrant properties | ||||||
|---|---|---|---|---|---|---|---|
| Quadrant | DetID | PixID | Counts | Sigma | Mean | Median | Sigma |
| A | 13 | 254 | 9779 | 52.59 | 845 | 829 | 170.2 |
| A | 3 | 137 | 7422 | 38.74 | 845 | 829 | 170.2 |
| A | 0 | 226 | 7211 | 37.5 | 845 | 829 | 170.2 |
| B | 0 | 244 | 146109 | 903.2 | 847 | 827 | 160.9 |
| B | 12 | 111 | 19748 | 117.63 | 847 | 827 | 160.9 |
| B | 11 | 111 | 17593 | 104.23 | 847 | 827 | 160.9 |
| C | 14 | 238 | 130475 | 680.9 | 816 | 821 | 190.4 |
| C | 10 | 22 | 41383 | 213.02 | 816 | 821 | 190.4 |
| C | 0 | 10 | 6291 | 28.73 | 816 | 821 | 190.4 |
| D | 1 | 52 | 378857 | 1899.32 | 820 | 798 | 199.0 |
| D | 2 | 234 | 30430 | 148.87 | 820 | 798 | 199.0 |
| D | 13 | 172 | 18866 | 90.77 | 820 | 798 | 199.0 |
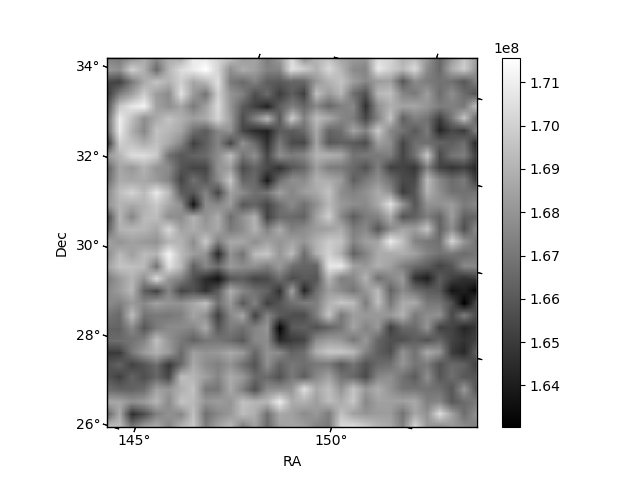
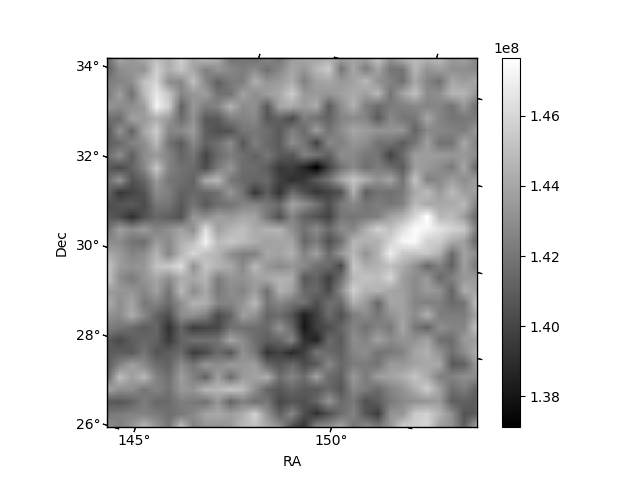
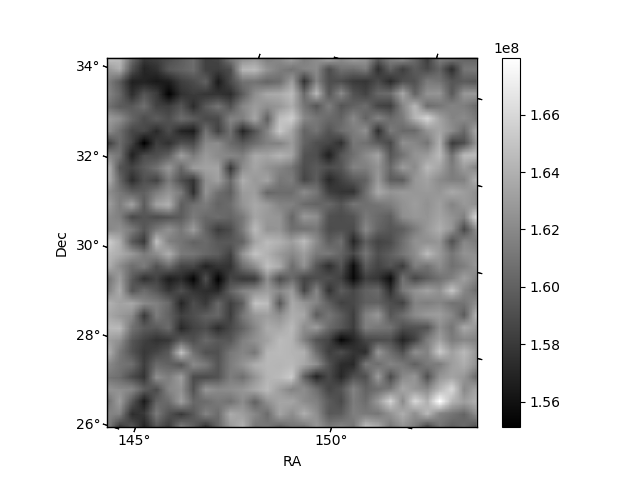
Histogram calculated using DETX and DETY for each event in the final _common_clean file
| Quadrant A | 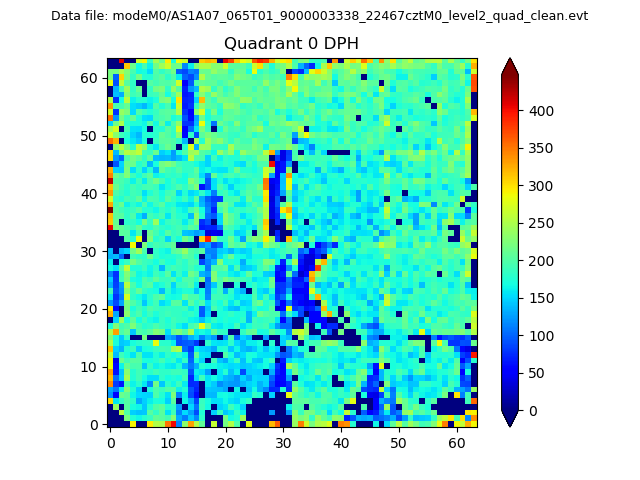 |
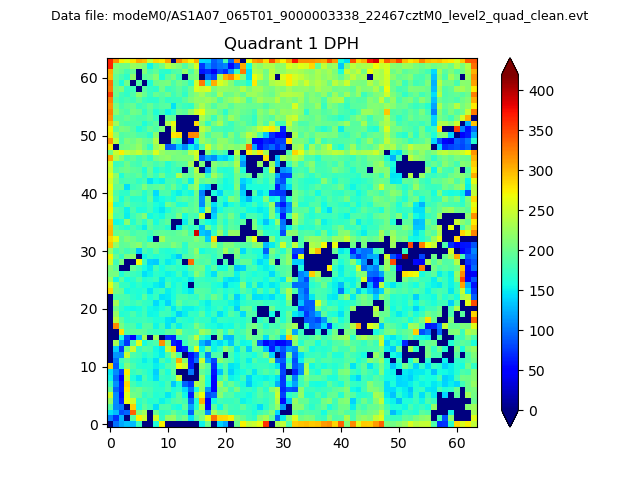 |
Quadrant B |
|---|---|---|---|
| Quadrant D | 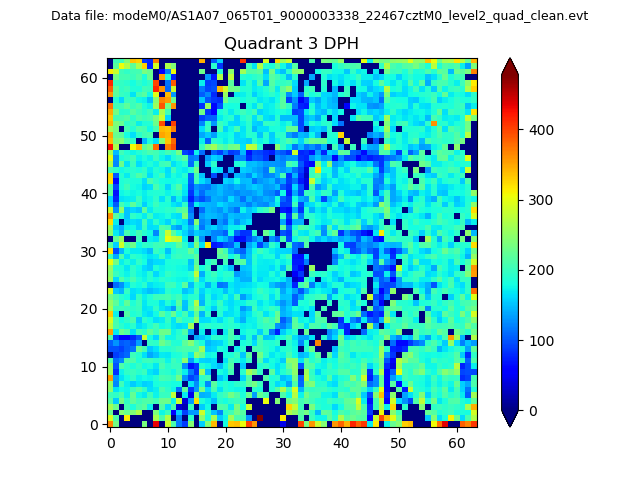 |
 |
Quadrant C |
| Plot type | Count rate plots | Images |
|---|---|---|
| Comparison with Poisson distribution Blue bars denote a histogram of data divided into 1 sec bins. Red curve is a Poisson curve with rate = median count rate of data. |
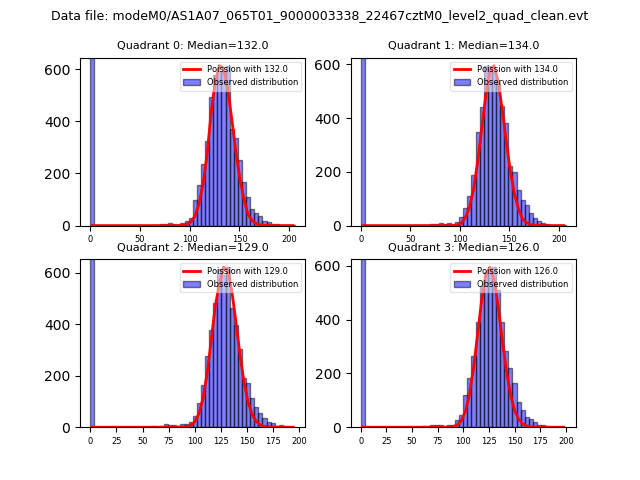 |
 |
| Quadrant-wise count rates Data is divided into 100 sec bins |
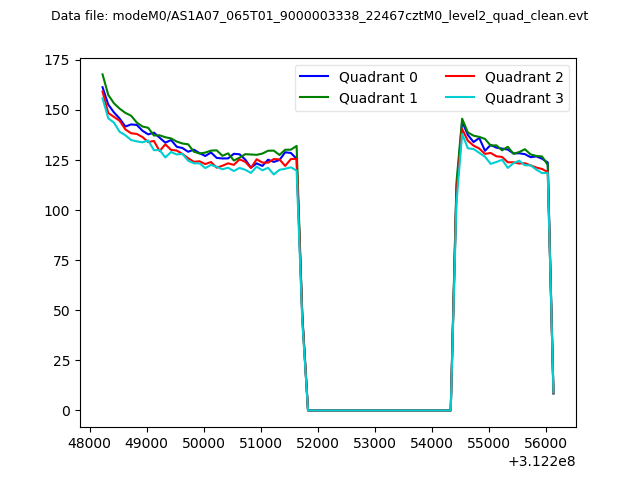 |
|
| Module-wise count rates for Quadrant A Data is divided into 100 sec bins |
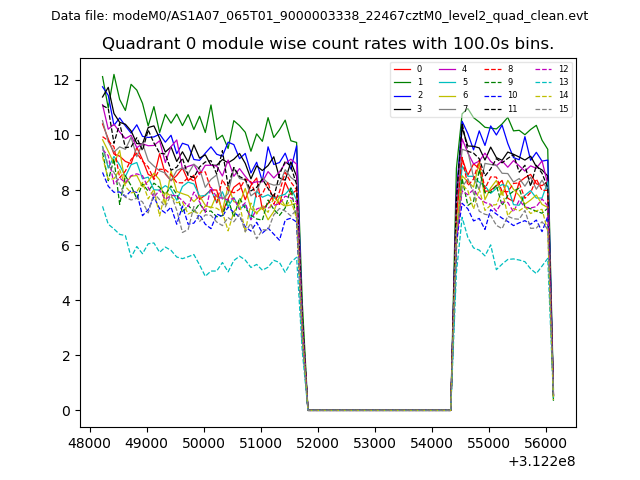 |
 |
| Module-wise count rates for Quadrant B Data is divided into 100 sec bins |
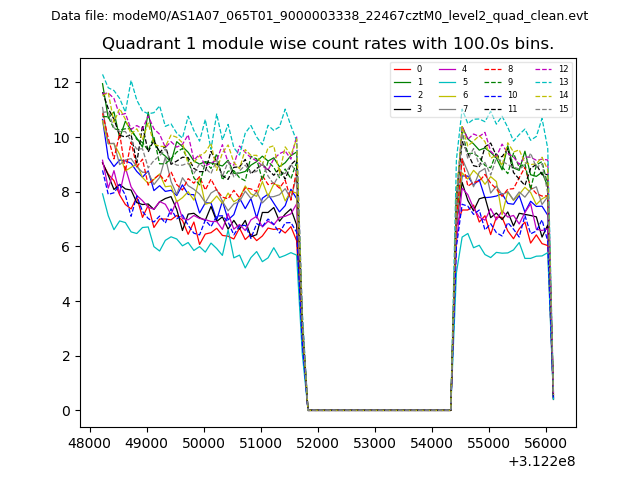 |
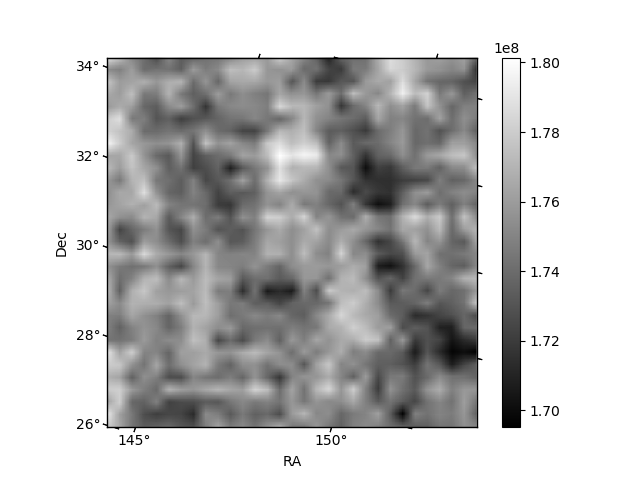 |
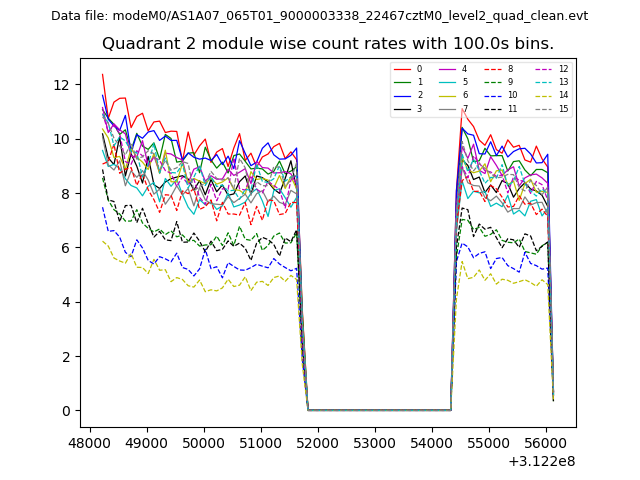
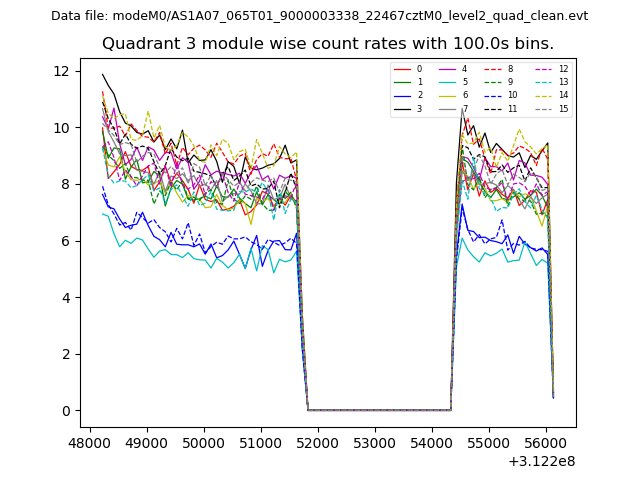
| Module-wise count rates for Quadrant C Data is divided into 100 sec bins |
 |
 |
| Module-wise count rates for Quadrant D Data is divided into 100 sec bins |
 |
 |
| Parameter | Plot |
|---|---|
| CZT HV Monitor | 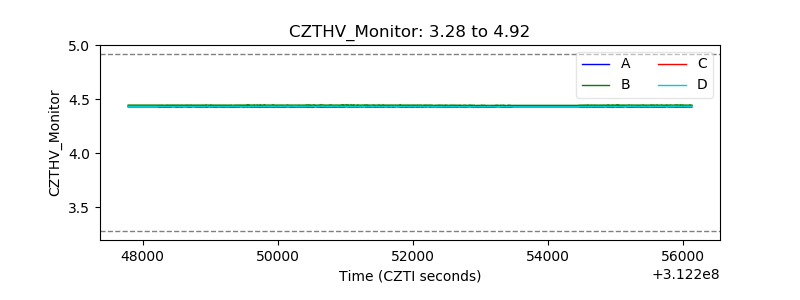 |
| D_VDD | 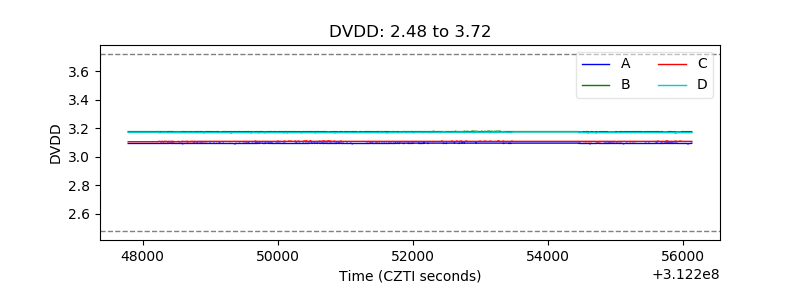 |
| Temperature 1 | 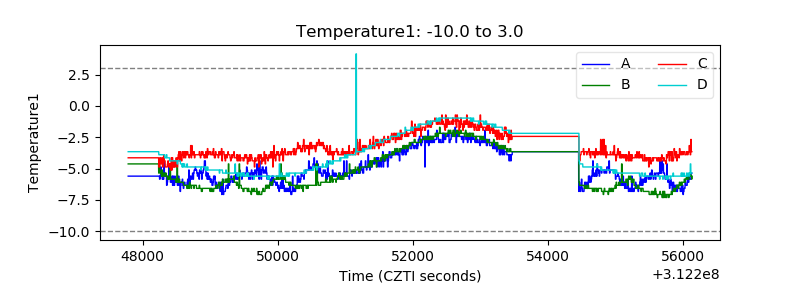 |
| Veto HV Monitor | 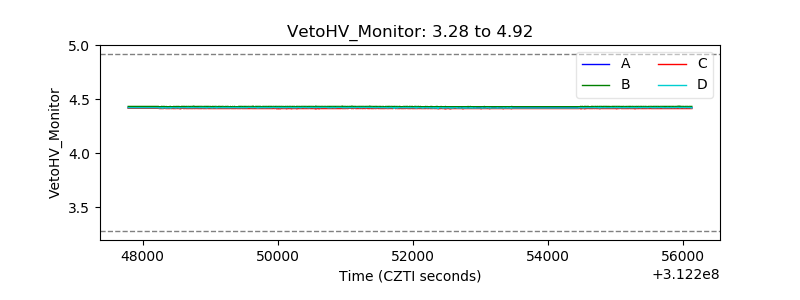 |
| Veto LLD | 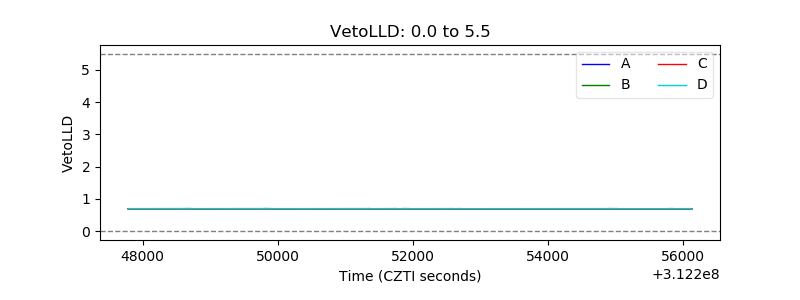 |
| Alpha Counter | 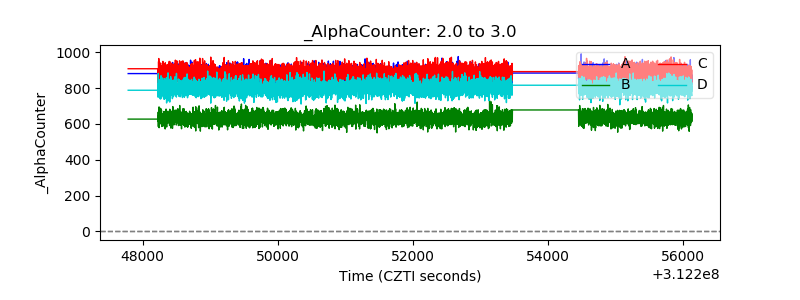 |
| _CPM_Rate | 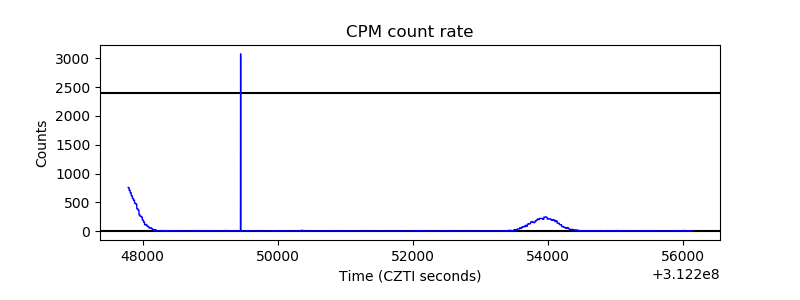 |
| CZT Counter |  |
| +2.5 Volts monitor |  |
| +5 Volts monitor |  |
| _ROLL_ROT |  |
| _Roll_DEC | 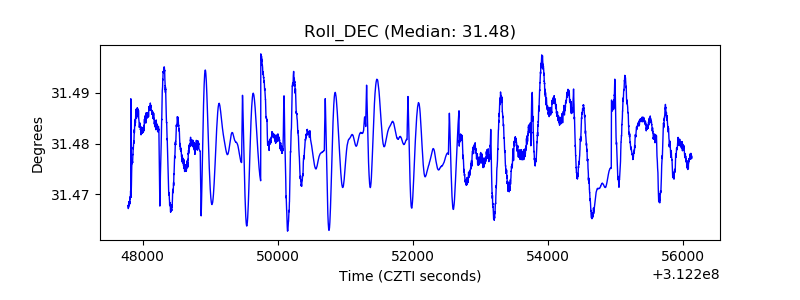 |
| _Roll_RA |  |
| Veto Counter |  |