| Param | Original file | Final file |
|---|---|---|
| Filename | modeM0/AS1A07_065T01_9000003338_22468cztM0_level2.evt | modeM0/AS1A07_065T01_9000003338_22468cztM0_level2_quad_clean.evt |
| Size (bytes) | 206,061,120 | 59,742,720 |
| Size | 196.5 MB | 57.0 MB |
| Events in quadrant A | 1,418,077 | 399,406 |
| Events in quadrant B | 1,579,459 | 405,302 |
| Events in quadrant C | 1,440,736 | 389,843 |
| Events in quadrant D | 1,578,102 | 382,485 |
| Mode SS | |||
|---|---|---|---|
| Quadrant | BADHDUFLAG | Total packets | Discarded packets |
| A | 0 | 66 | 0 |
| B | 0 | 66 | 0 |
| C | 0 | 66 | 0 |
| D | 0 | 66 | 0 |
| Mode M0 | |||
|---|---|---|---|
| Quadrant | BADHDUFLAG | Total packets | Discarded packets |
| A | 0 | 6614 | 1 |
| B | 0 | 6872 | 1 |
| C | 0 | 6629 | 1 |
| D | 0 | 7133 | 1 |
| Mode M9 | |||
|---|---|---|---|
| Quadrant | BADHDUFLAG | Total packets | Discarded packets |
| A | 0 | 3 | 0 |
| B | 0 | 4 | 0 |
| C | 0 | 4 | 0 |
| D | 0 | 4 | 0 |
| Quadrant | Total seconds | Saturated seconds | Saturation percentage |
|---|---|---|---|
| A | 3265 | 4 | 0.122511% |
| B | 3265 | 11 | 0.336907% |
| C | 3265 | 10 | 0.306279% |
| D | 3265 | 14 | 0.428790% |
Noise dominated data is calculated using 1-second bins in cleaned event files. If a bin has >2000 counts, and if more than 50% of those come from <1% of pixels, then it is considered to be noise-dominated and hence unusable.
| Quadrant | # 1 sec bins | Bins with >0 counts | Bins with >2000 counts | High rate bins dominated by noise | Noise dominated (total time) | Noise dominated (detector-on time) | Marked lightcurve |
|---|---|---|---|---|---|---|---|
| A | 3265 | 3265 | 0 | 0 | 0.00% | 0.00% | 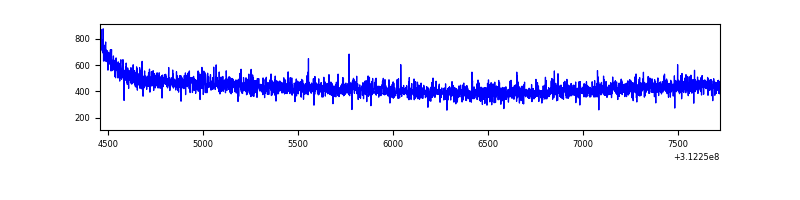 |
| B | 3265 | 3265 | 6 | 6 | 0.18% | 0.18% | 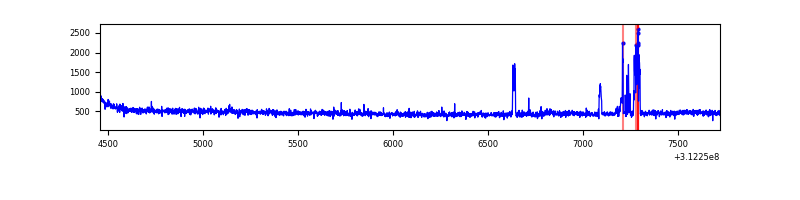 |
| C | 3265 | 3265 | 0 | 0 | 0.00% | 0.00% | 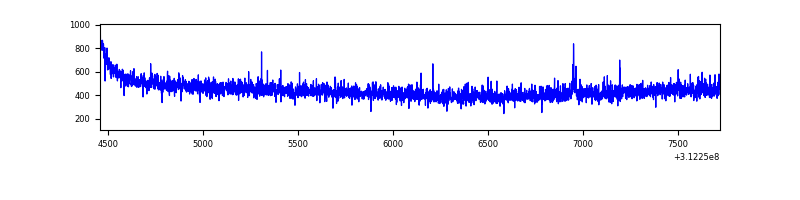 |
| D | 3265 | 3265 | 16 | 16 | 0.49% | 0.49% | 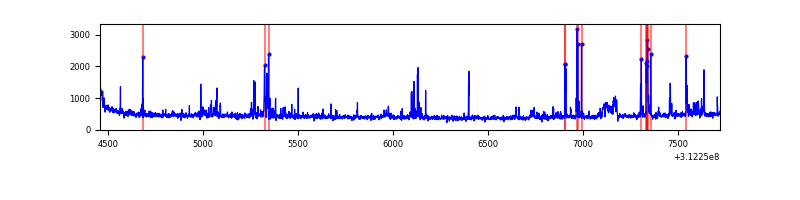 |
Top three noisy pixels from each quadrant. If the there are fewer than three noisy pixels in the level2.evt file, extra rows are filled as -1
| Pixel properties | Quadrant properties | ||||||
|---|---|---|---|---|---|---|---|
| Quadrant | DetID | PixID | Counts | Sigma | Mean | Median | Sigma |
| A | 13 | 254 | 4423 | 53.88 | 367 | 360 | 75.4 |
| A | 3 | 137 | 3221 | 37.94 | 367 | 360 | 75.4 |
| A | 0 | 226 | 3064 | 35.86 | 367 | 360 | 75.4 |
| B | 0 | 244 | 110327 | 1518.34 | 369 | 360 | 72.4 |
| B | 5 | 172 | 23696 | 322.21 | 369 | 360 | 72.4 |
| B | 12 | 111 | 8771 | 116.13 | 369 | 360 | 72.4 |
| C | 14 | 238 | 57223 | 680.55 | 353 | 357 | 83.6 |
| C | 10 | 22 | 2623 | 27.12 | 353 | 357 | 83.6 |
| C | 13 | 61 | 2554 | 26.29 | 353 | 357 | 83.6 |
| D | 1 | 52 | 198402 | 2263.68 | 355 | 346 | 87.5 |
| D | 1 | 20 | 18925 | 212.35 | 355 | 346 | 87.5 |
| D | 2 | 234 | 12871 | 143.15 | 355 | 346 | 87.5 |
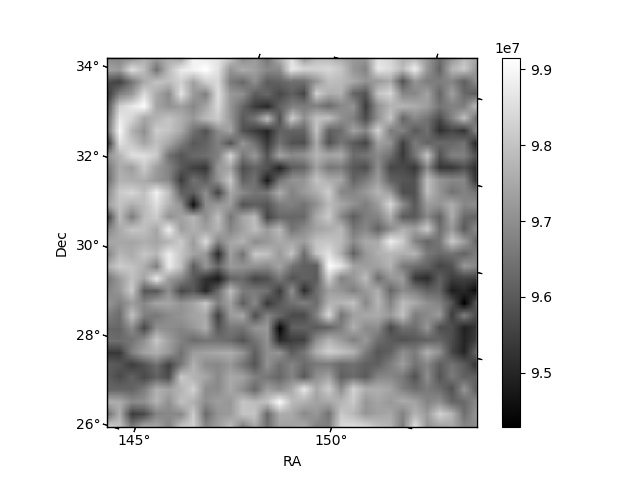
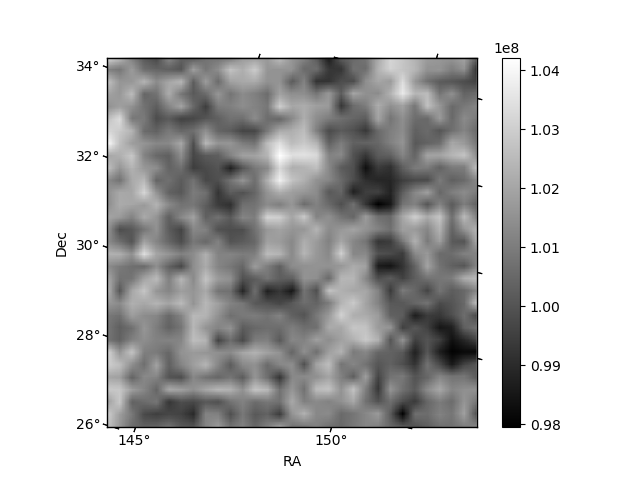
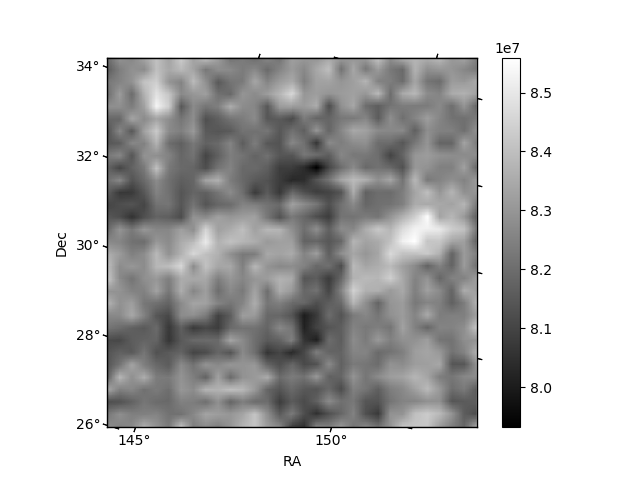
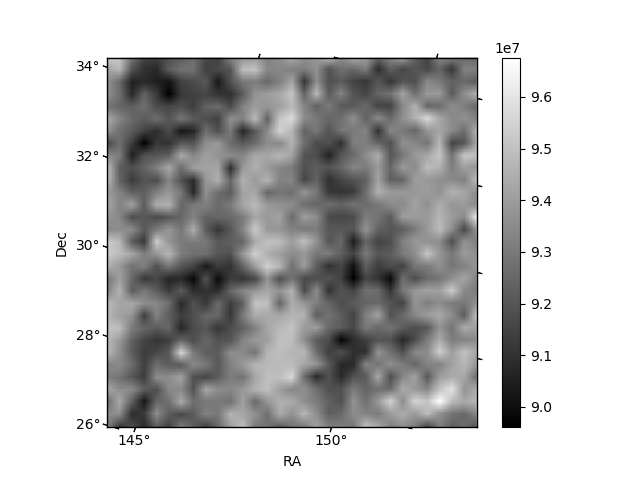
Histogram calculated using DETX and DETY for each event in the final _common_clean file
| Quadrant A |  |
 |
Quadrant B |
|---|---|---|---|
| Quadrant D |  |
 |
Quadrant C |
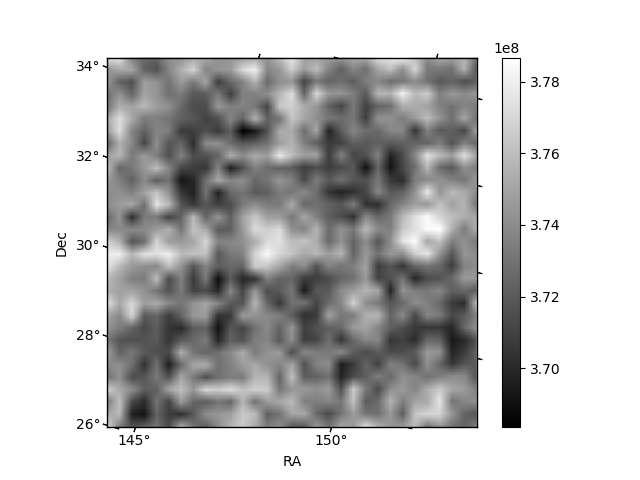
| Plot type | Count rate plots | Images |
|---|---|---|
| Comparison with Poisson distribution Blue bars denote a histogram of data divided into 1 sec bins. Red curve is a Poisson curve with rate = median count rate of data. |
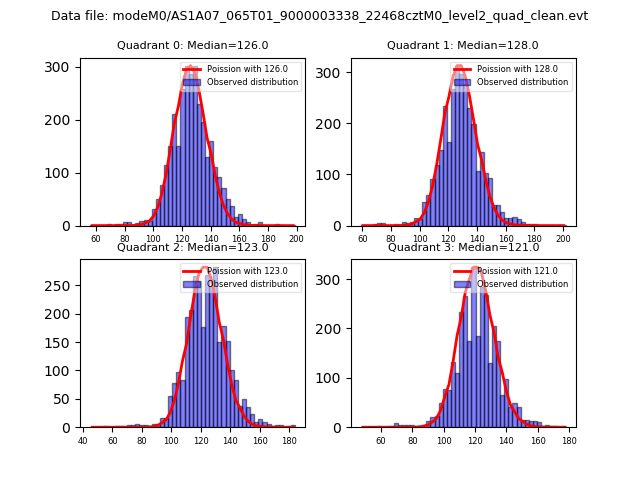 |
 |
| Quadrant-wise count rates Data is divided into 100 sec bins |
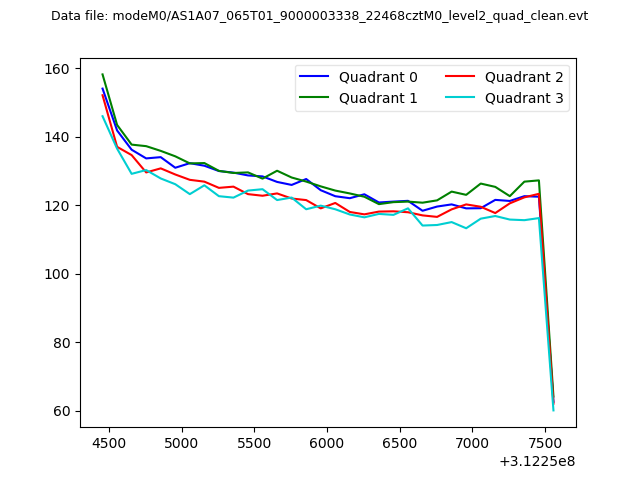 |
|
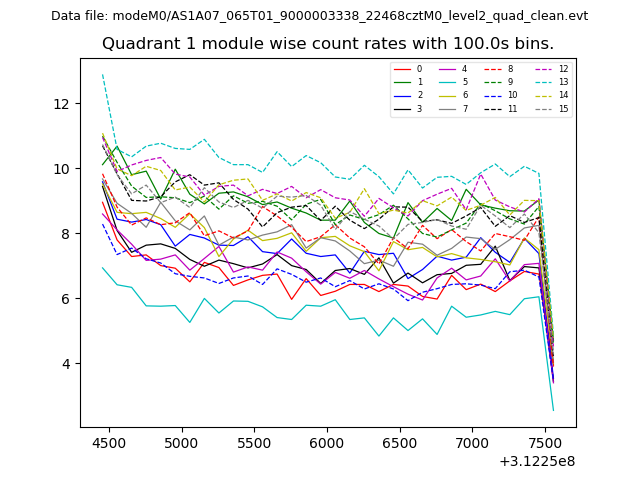
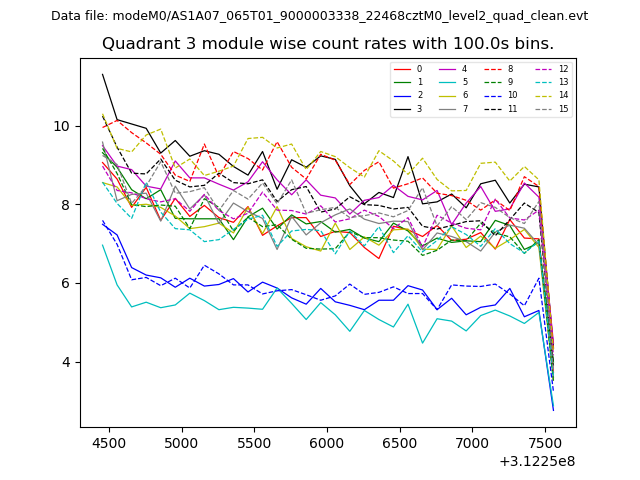
| Module-wise count rates for Quadrant A Data is divided into 100 sec bins |
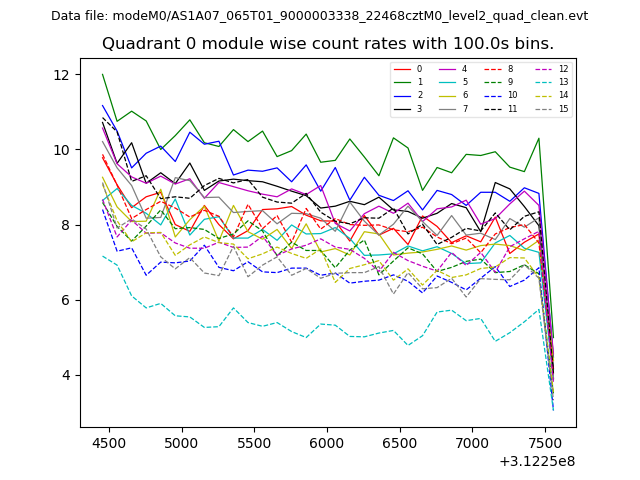 |
 |
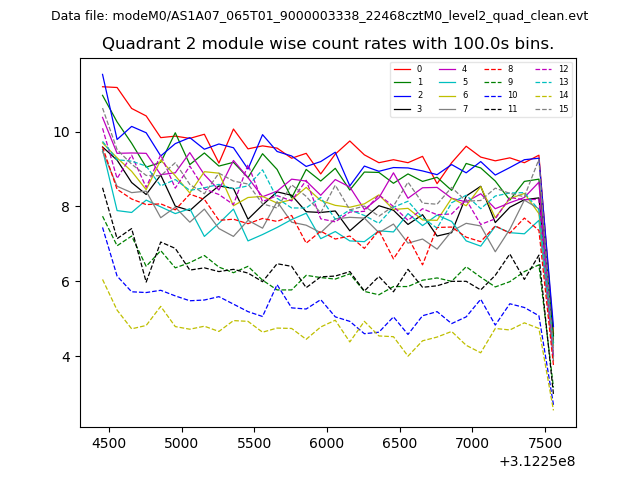
| Module-wise count rates for Quadrant B Data is divided into 100 sec bins |
 |
 |
| Module-wise count rates for Quadrant C Data is divided into 100 sec bins |
 |
 |
| Module-wise count rates for Quadrant D Data is divided into 100 sec bins |
 |
 |
| Parameter | Plot |
|---|---|
| CZT HV Monitor | 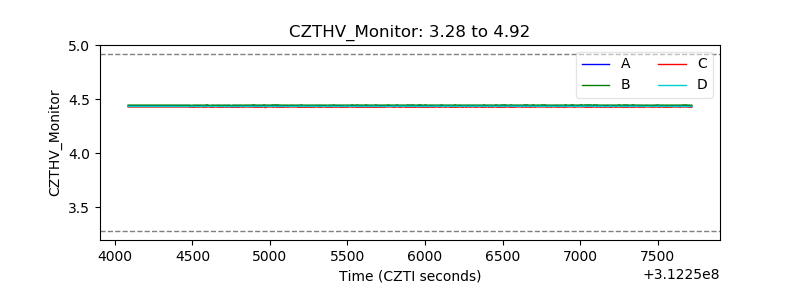 |
| D_VDD | 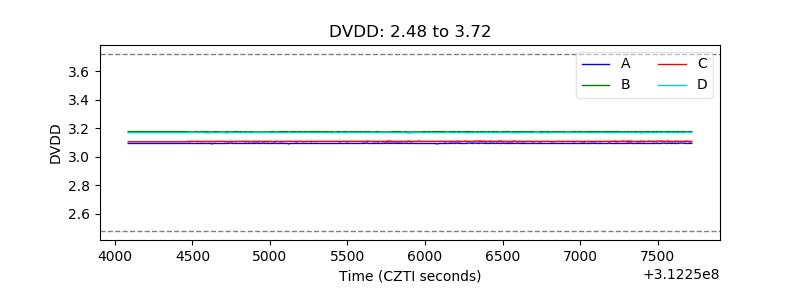 |
| Temperature 1 | 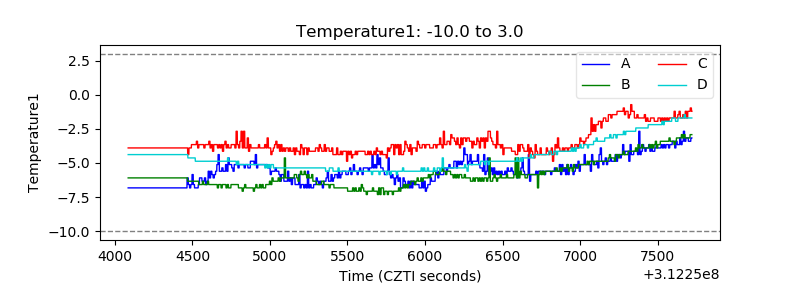 |
| Veto HV Monitor |  |
| Veto LLD | 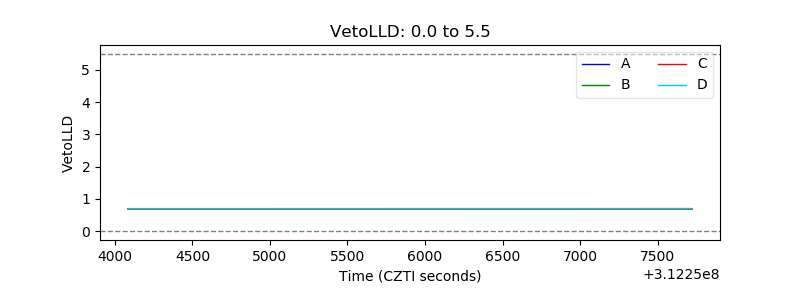 |
| Alpha Counter | 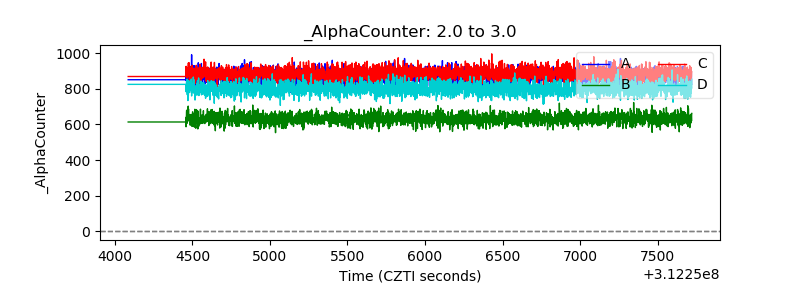 |
| _CPM_Rate | 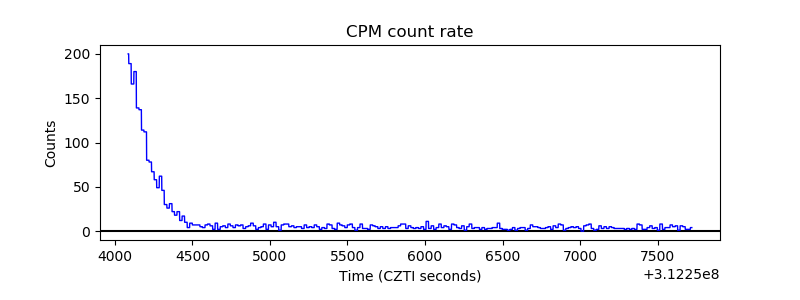 |
| CZT Counter |  |
| +2.5 Volts monitor |  |
| +5 Volts monitor | 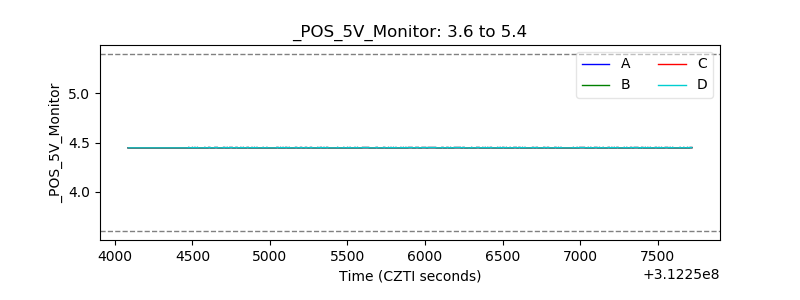 |
| _ROLL_ROT | 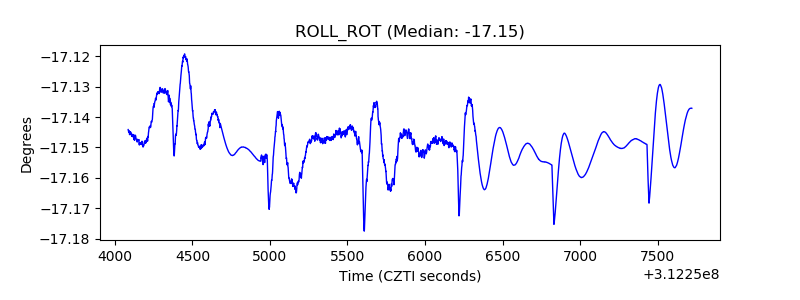 |
| _Roll_DEC |  |
| _Roll_RA | 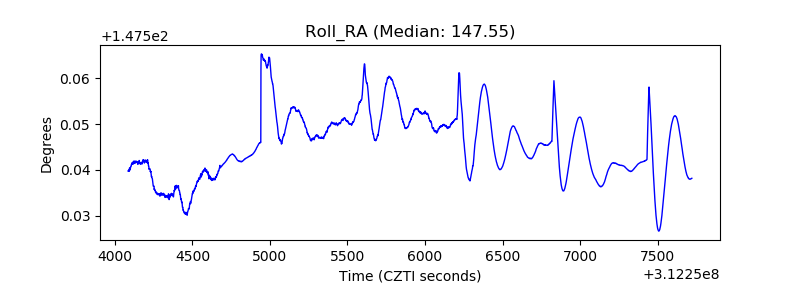 |
| Veto Counter | 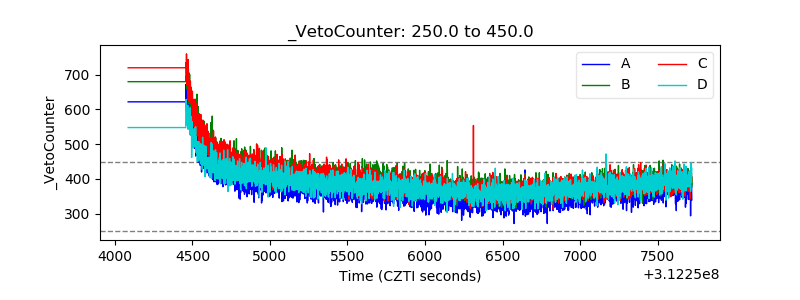 |