| Param | Original file | Final file |
|---|---|---|
| Filename | modeM0/AS1T03_149T07_9000003332cztM0_level2.fits | modeM0/AS1T03_149T07_9000003332cztM0_level2_quad_clean.evt |
| Size (bytes) | 34,358,400 | 15,287,040 |
| Size | 32.8 MB | 14.6 MB |
| Events in quadrant A | 206,250 | 55,617 |
| Events in quadrant B | 194,398 | 42,263 |
| Events in quadrant C | 201,484 | 52,748 |
| Events in quadrant D | 176,958 | 49,436 |
| Mode SS | |||
|---|---|---|---|
| Quadrant | BADHDUFLAG | Total packets | Discarded packets |
| A | 0 | 74 | 0 |
| B | 0 | 74 | 0 |
| C | 0 | 74 | 0 |
| D | 0 | 74 | 0 |
| Mode M0 | |||
|---|---|---|---|
| Quadrant | BADHDUFLAG | Total packets | Discarded packets |
| A | 0 | 7411 | 0 |
| B | 0 | 9546 | 0 |
| C | 0 | 7522 | 0 |
| D | 0 | 7747 | 0 |
| Quadrant | Total seconds | Saturated seconds | Saturation percentage |
|---|---|---|---|
| A | 3697 | 4 | 0.108196% |
| B | 3697 | 196 | 5.301596% |
| C | 3697 | 16 | 0.432783% |
| D | 3697 | 13 | 0.351636% |
Noise dominated data is calculated using 1-second bins in cleaned event files. If a bin has >2000 counts, and if more than 50% of those come from <1% of pixels, then it is considered to be noise-dominated and hence unusable.
| Quadrant | # 1 sec bins | Bins with >0 counts | Bins with >2000 counts | High rate bins dominated by noise | Noise dominated (total time) | Noise dominated (detector-on time) | Marked lightcurve |
|---|---|---|---|---|---|---|---|
| A | 3697 | 3697 | 0 | 0 | 0.00% | 0.00% |  |
| B | 3697 | 3697 | 0 | 0 | 0.00% | 0.00% |  |
| C | 3697 | 3697 | 0 | 0 | 0.00% | 0.00% |  |
| D | 3697 | 3697 | 0 | 0 | 0.00% | 0.00% |  |
Top three noisy pixels from each quadrant. If the there are fewer than three noisy pixels in the level2.evt file, extra rows are filled as -1
| Pixel properties | Quadrant properties | ||||||
|---|---|---|---|---|---|---|---|
| Quadrant | DetID | PixID | Counts | Sigma | Mean | Median | Sigma |
| A | 0 | 29 | 206 | 10.31 | 53 | 50 | 15.1 |
| A | 7 | 110 | 171 | 8.0 | 53 | 50 | 15.1 |
| A | 15 | 236 | 161 | 7.34 | 53 | 50 | 15.1 |
| B | 2 | 9 | 166 | 9.27 | 51 | 49 | 12.6 |
| B | 3 | 80 | 152 | 8.16 | 51 | 49 | 12.6 |
| B | 10 | 128 | 134 | 6.73 | 51 | 49 | 12.6 |
| C | 3 | 234 | 168 | 7.66 | 53 | 50 | 15.4 |
| C | 1 | 80 | 154 | 6.75 | 53 | 50 | 15.4 |
| C | 12 | 241 | 153 | 6.68 | 53 | 50 | 15.4 |
| D | 10 | 189 | 138 | 6.2 | 50 | 45 | 15.0 |
| D | 13 | 238 | 137 | 6.13 | 50 | 45 | 15.0 |
| D | 3 | 14 | 137 | 6.13 | 50 | 45 | 15.0 |
Histogram calculated using DETX and DETY for each event in the final _common_clean file
| Quadrant A | 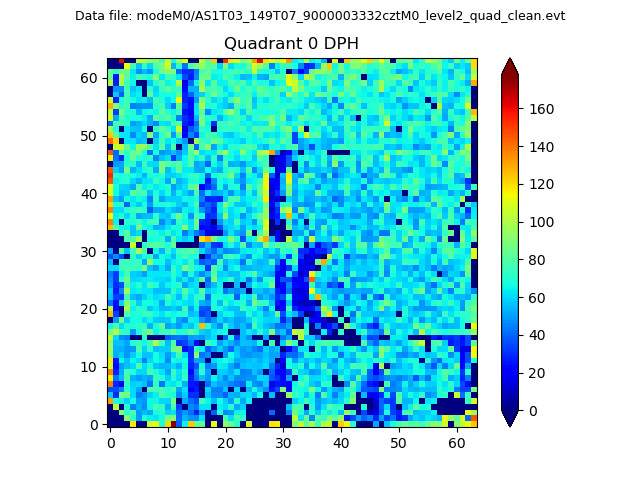 |
 |
Quadrant B |
|---|---|---|---|
| Quadrant D | 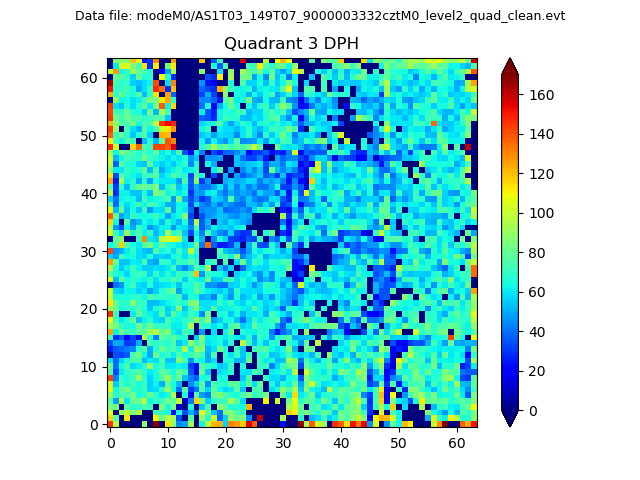 |
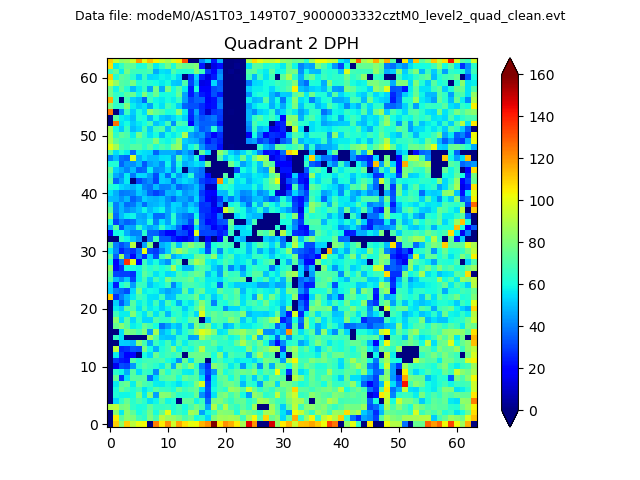 |
Quadrant C |
| Plot type | Count rate plots | Images |
|---|---|---|
| Comparison with Poisson distribution Blue bars denote a histogram of data divided into 1 sec bins. Red curve is a Poisson curve with rate = median count rate of data. |
 |
 |
| Quadrant-wise count rates Data is divided into 100 sec bins |
 |
|
| Module-wise count rates for Quadrant A Data is divided into 100 sec bins |
 |
 |
| Module-wise count rates for Quadrant B Data is divided into 100 sec bins |
 |
 |
| Module-wise count rates for Quadrant C Data is divided into 100 sec bins |
 |
 |
| Module-wise count rates for Quadrant D Data is divided into 100 sec bins |
 |
 |
| Parameter | Plot |
|---|---|
| CZT HV Monitor |  |
| D_VDD |  |
| Temperature 1 |  |
| Veto HV Monitor |  |
| Veto LLD |  |
| Alpha Counter |  |
| _CPM_Rate |  |
| CZT Counter |  |
| +2.5 Volts monitor |  |
| +5 Volts monitor |  |
| _ROLL_ROT |  |
| _Roll_DEC |  |
| _Roll_RA |  |
| Veto Counter |  |