| Param | Original file | Final file |
|---|---|---|
| Filename | modeM0/AS1T03_149T07_9000003332_22455cztM0_level2.evt | modeM0/AS1T03_149T07_9000003332_22455cztM0_level2_quad_clean.evt |
| Size (bytes) | 256,553,280 | 39,893,760 |
| Size | 244.7 MB | 38.0 MB |
| Events in quadrant A | 1,660,194 | 241,520 |
| Events in quadrant B | 2,413,145 | 236,089 |
| Events in quadrant C | 1,720,515 | 234,553 |
| Events in quadrant D | 1,722,707 | 233,769 |
| Mode SS | |||
|---|---|---|---|
| Quadrant | BADHDUFLAG | Total packets | Discarded packets |
| A | 0 | 74 | 0 |
| B | 0 | 74 | 0 |
| C | 0 | 74 | 0 |
| D | 0 | 74 | 0 |
| Mode M0 | |||
|---|---|---|---|
| Quadrant | BADHDUFLAG | Total packets | Discarded packets |
| A | 0 | 7411 | 0 |
| B | 0 | 9546 | 0 |
| C | 0 | 7522 | 0 |
| D | 0 | 7747 | 0 |
| Quadrant | Total seconds | Saturated seconds | Saturation percentage |
|---|---|---|---|
| A | 3697 | 4 | 0.108196% |
| B | 3697 | 196 | 5.301596% |
| C | 3697 | 16 | 0.432783% |
| D | 3697 | 13 | 0.351636% |
Noise dominated data is calculated using 1-second bins in cleaned event files. If a bin has >2000 counts, and if more than 50% of those come from <1% of pixels, then it is considered to be noise-dominated and hence unusable.
| Quadrant | # 1 sec bins | Bins with >0 counts | Bins with >2000 counts | High rate bins dominated by noise | Noise dominated (total time) | Noise dominated (detector-on time) | Marked lightcurve |
|---|---|---|---|---|---|---|---|
| A | 3697 | 3697 | 0 | 0 | 0.00% | 0.00% | 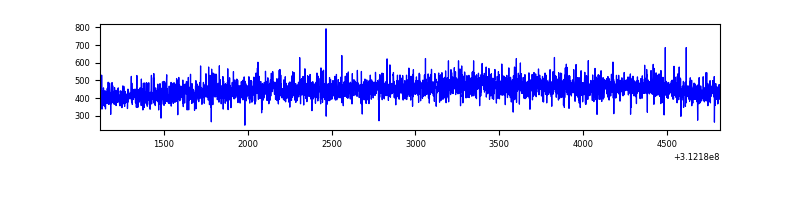 |
| B | 3697 | 3697 | 141 | 141 | 3.81% | 3.81% | 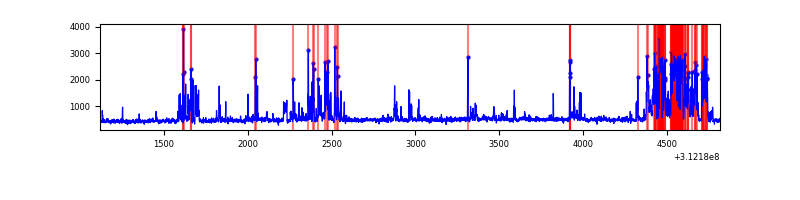 |
| C | 3697 | 3697 | 0 | 0 | 0.00% | 0.00% | 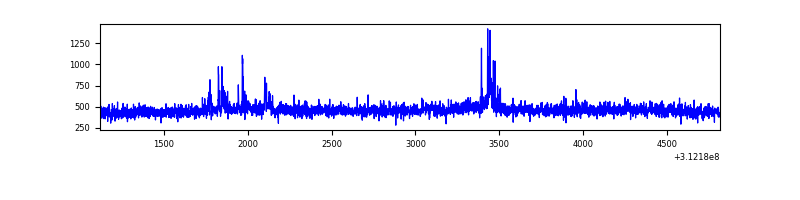 |
| D | 3697 | 3697 | 14 | 14 | 0.38% | 0.38% | 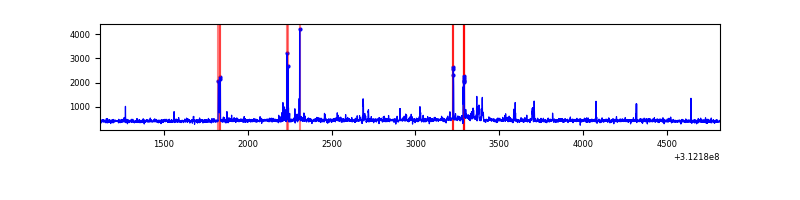 |
Top three noisy pixels from each quadrant. If the there are fewer than three noisy pixels in the level2.evt file, extra rows are filled as -1
| Pixel properties | Quadrant properties | ||||||
|---|---|---|---|---|---|---|---|
| Quadrant | DetID | PixID | Counts | Sigma | Mean | Median | Sigma |
| A | 13 | 254 | 4501 | 46.08 | 430 | 422 | 88.5 |
| A | 3 | 137 | 3871 | 38.96 | 430 | 422 | 88.5 |
| A | 0 | 226 | 3755 | 37.65 | 430 | 422 | 88.5 |
| B | 10 | 245 | 746828 | 9091.33 | 423 | 412 | 82.1 |
| B | 12 | 111 | 10285 | 120.25 | 423 | 412 | 82.1 |
| B | 11 | 111 | 8956 | 104.07 | 423 | 412 | 82.1 |
| C | 14 | 238 | 65217 | 656.96 | 412 | 414 | 98.6 |
| C | 10 | 22 | 48974 | 492.29 | 412 | 414 | 98.6 |
| C | 13 | 61 | 2885 | 25.05 | 412 | 414 | 98.6 |
| D | 1 | 52 | 90300 | 875.13 | 417 | 405 | 102.7 |
| D | 13 | 172 | 29946 | 287.58 | 417 | 405 | 102.7 |
| D | 9 | 85 | 15655 | 148.46 | 417 | 405 | 102.7 |
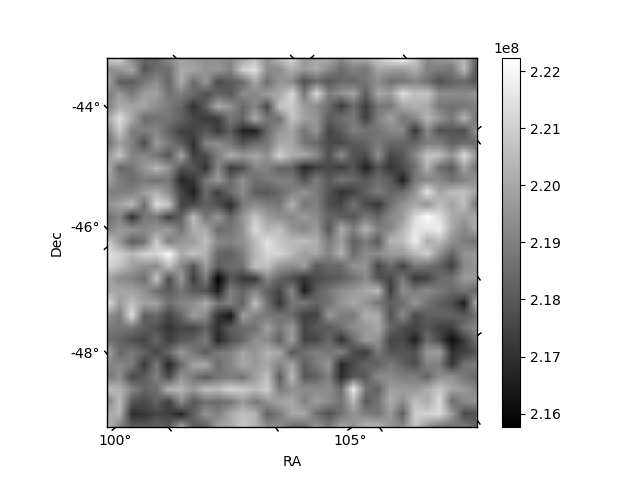
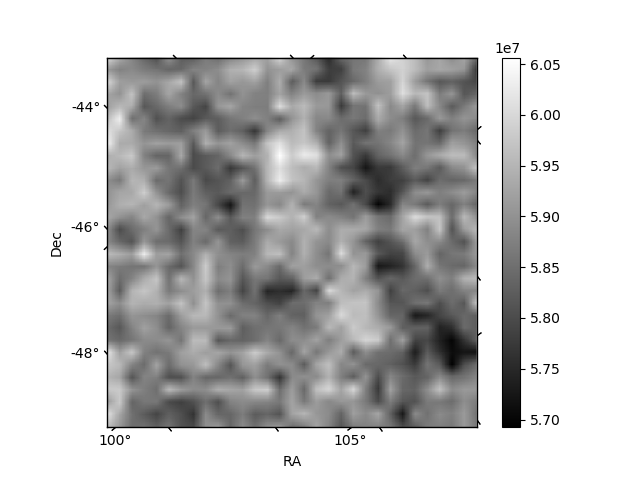
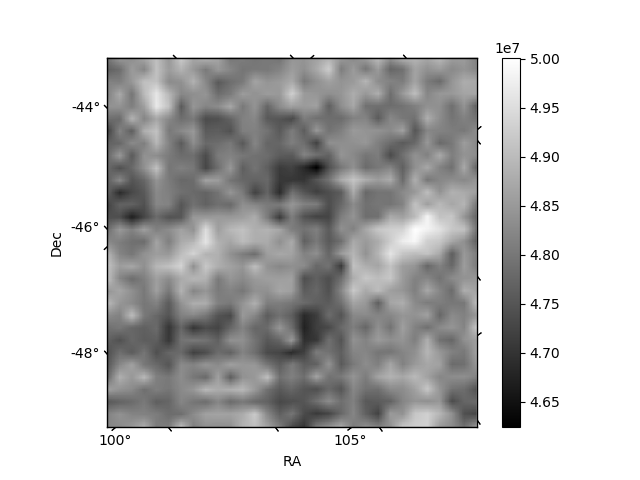
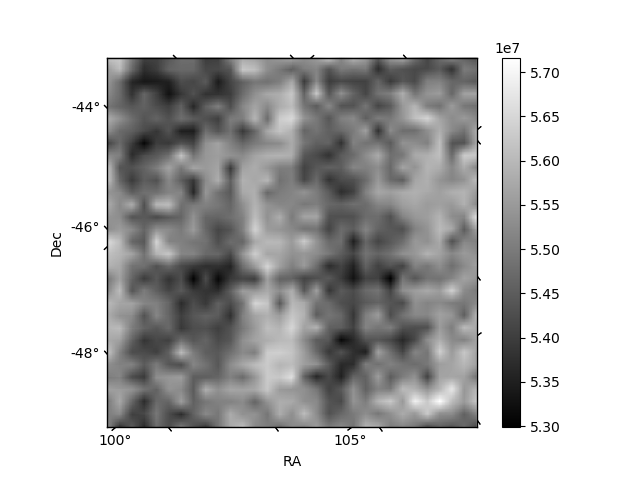
Histogram calculated using DETX and DETY for each event in the final _common_clean file
| Quadrant A | 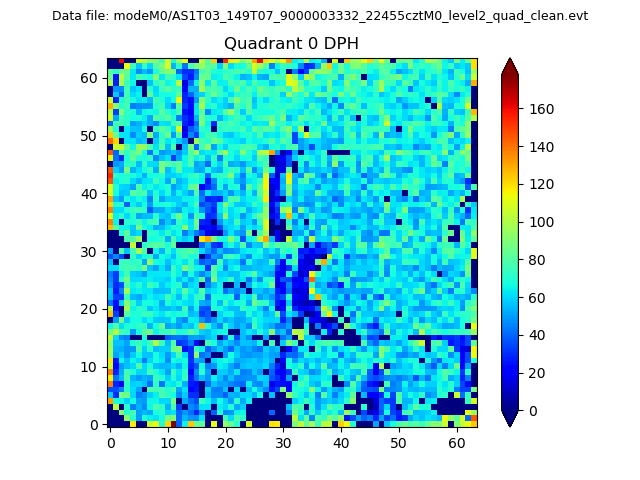 |
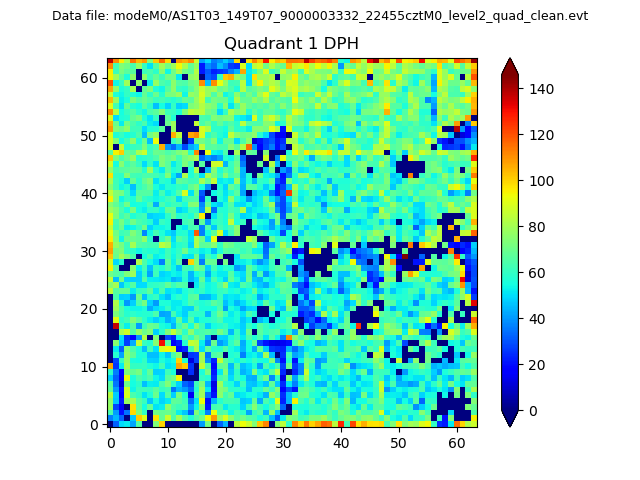 |
Quadrant B |
|---|---|---|---|
| Quadrant D | 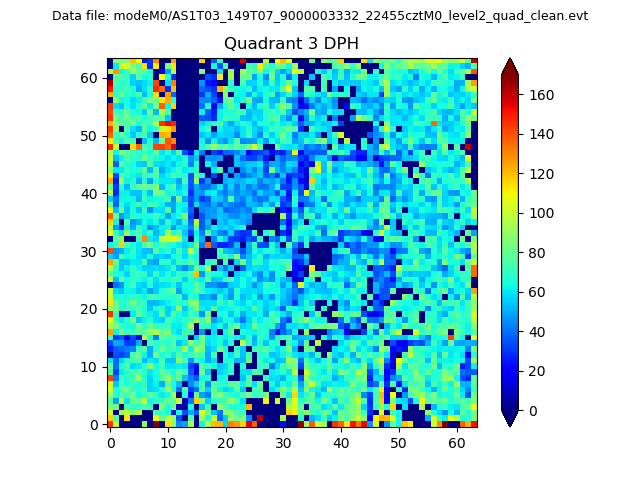 |
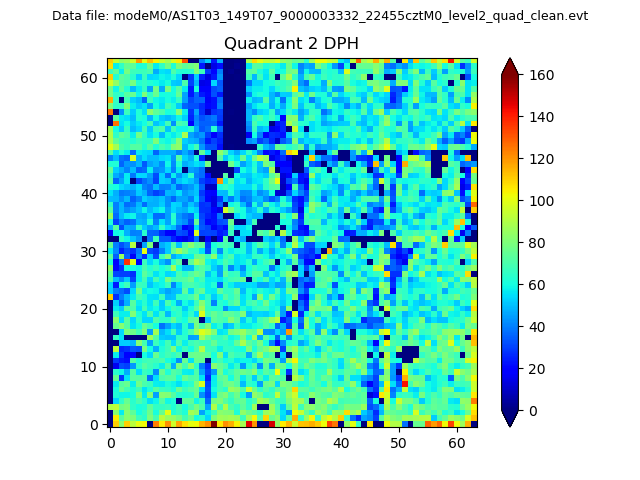 |
Quadrant C |
| Plot type | Count rate plots | Images |
|---|---|---|
| Comparison with Poisson distribution Blue bars denote a histogram of data divided into 1 sec bins. Red curve is a Poisson curve with rate = median count rate of data. |
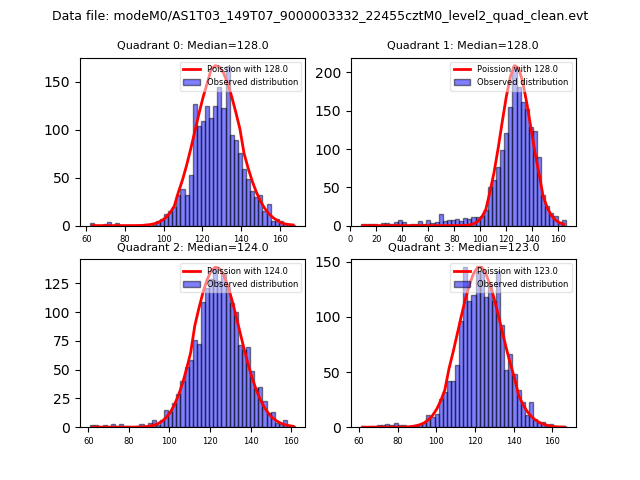 |
 |
| Quadrant-wise count rates Data is divided into 100 sec bins |
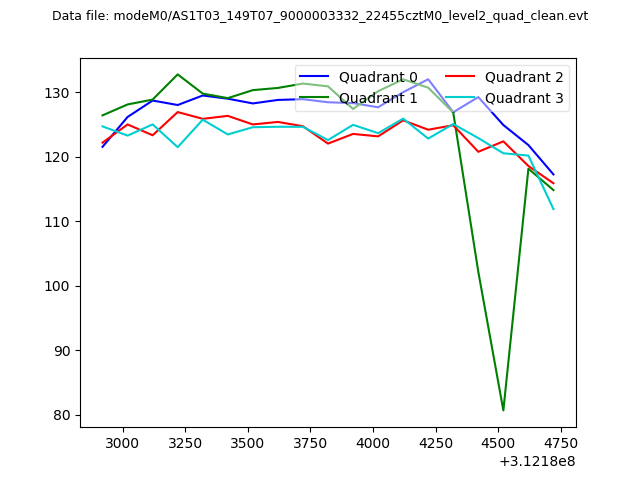 |
|
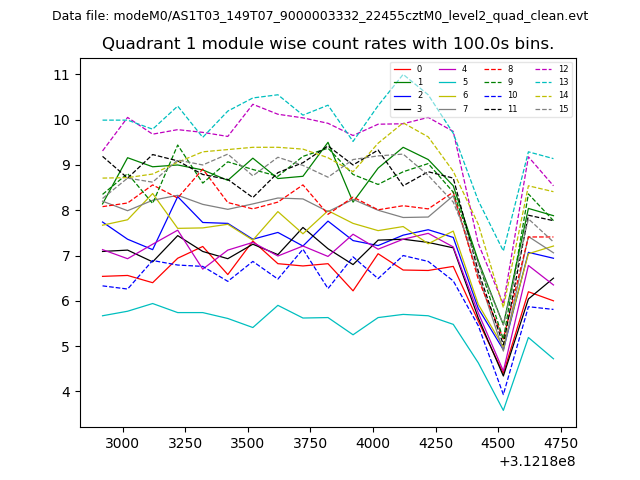
| Module-wise count rates for Quadrant A Data is divided into 100 sec bins |
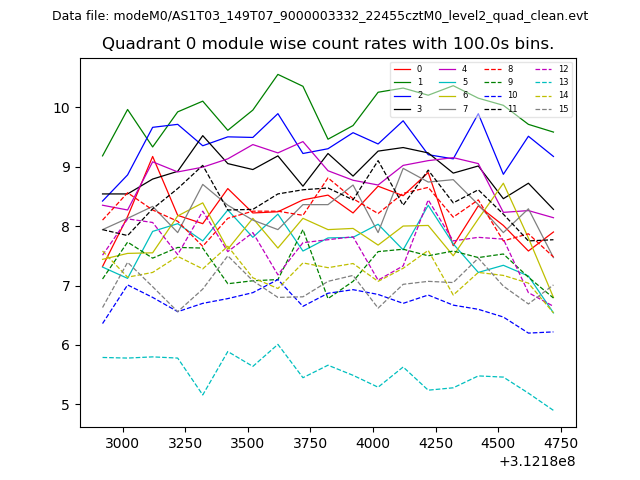 |
 |
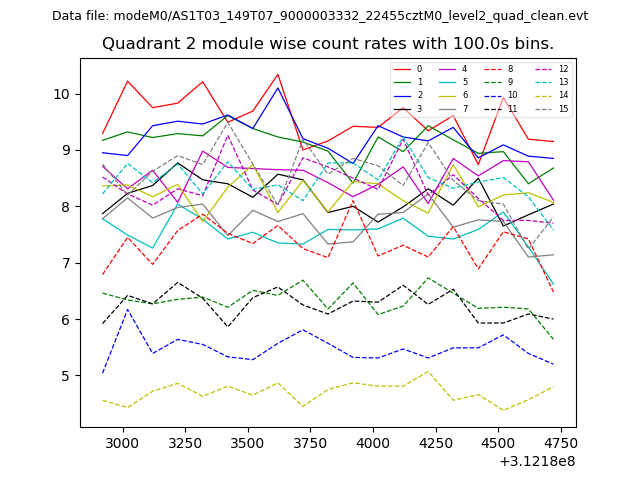
| Module-wise count rates for Quadrant B Data is divided into 100 sec bins |
 |
 |
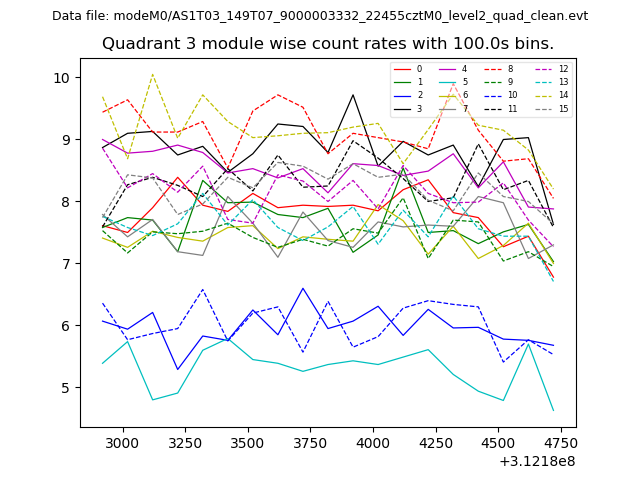
| Module-wise count rates for Quadrant C Data is divided into 100 sec bins |
 |
 |
| Module-wise count rates for Quadrant D Data is divided into 100 sec bins |
 |
 |
| Parameter | Plot |
|---|---|
| CZT HV Monitor | 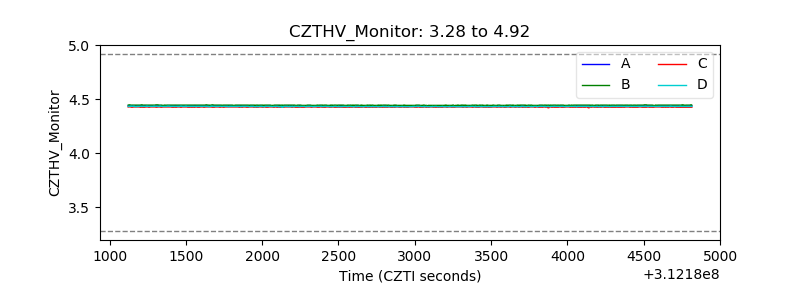 |
| D_VDD | 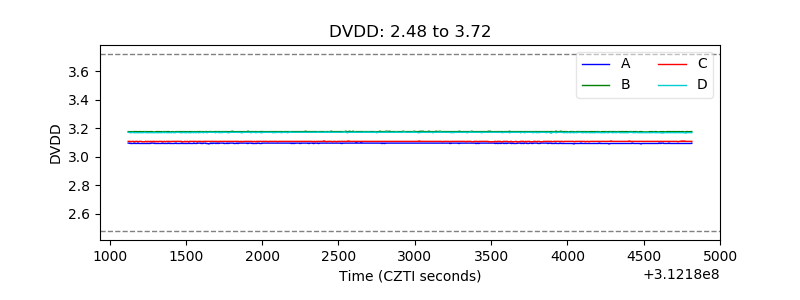 |
| Temperature 1 | 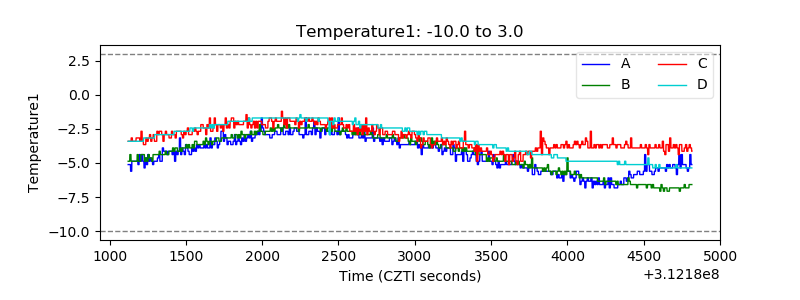 |
| Veto HV Monitor | 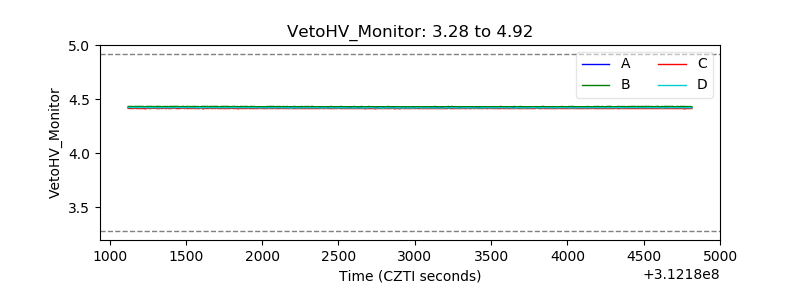 |
| Veto LLD | 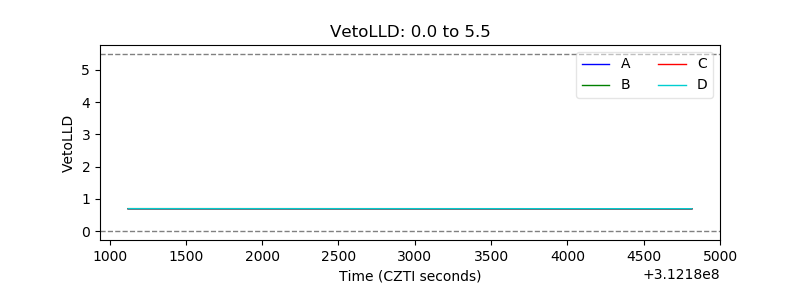 |
| Alpha Counter | 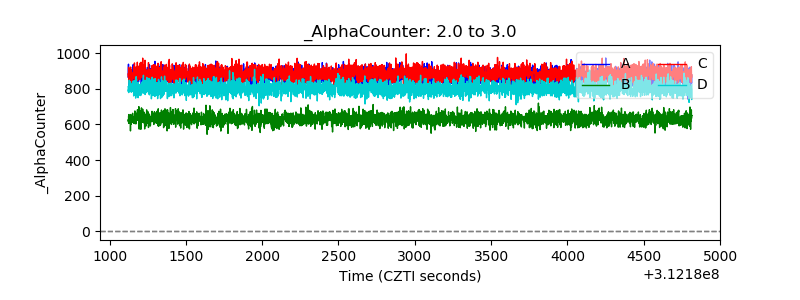 |
| _CPM_Rate | 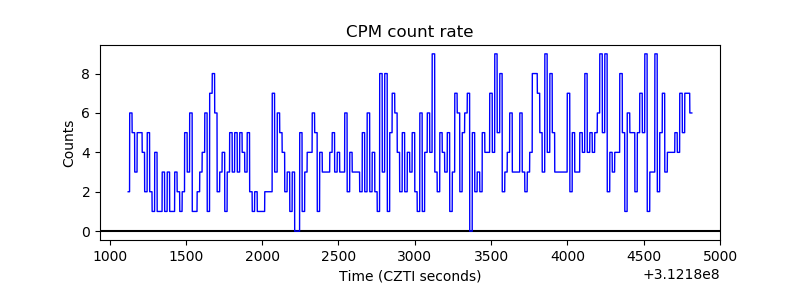 |
| CZT Counter | 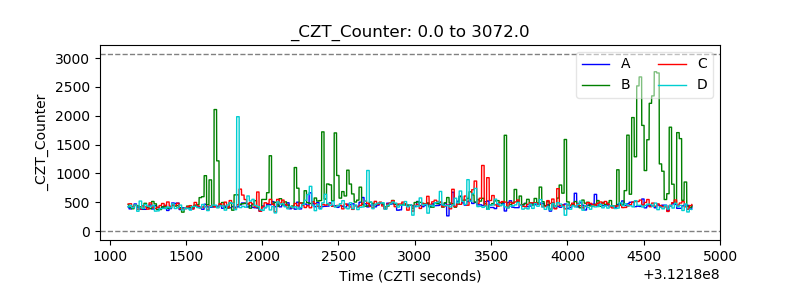 |
| +2.5 Volts monitor |  |
| +5 Volts monitor |  |
| _ROLL_ROT | 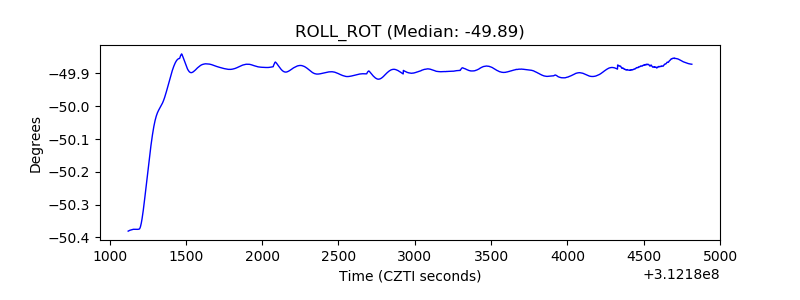 |
| _Roll_DEC | 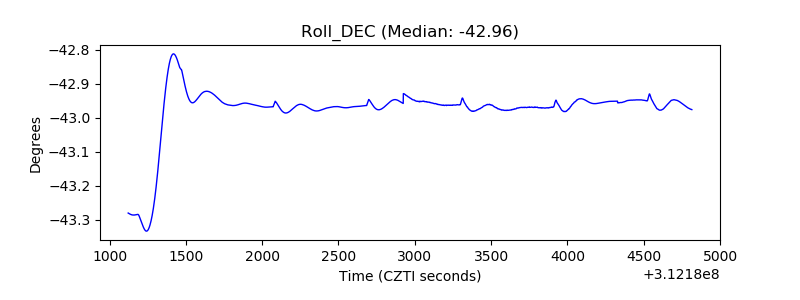 |
| _Roll_RA | 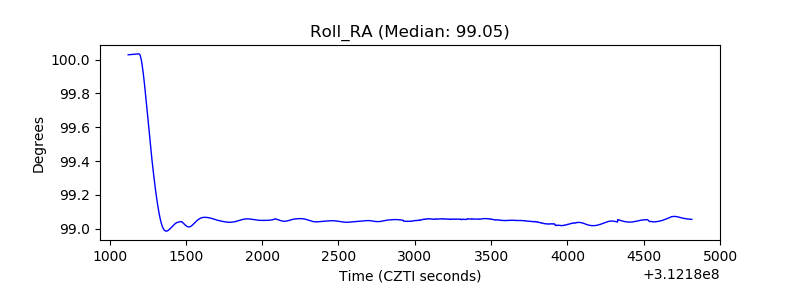 |
| Veto Counter | 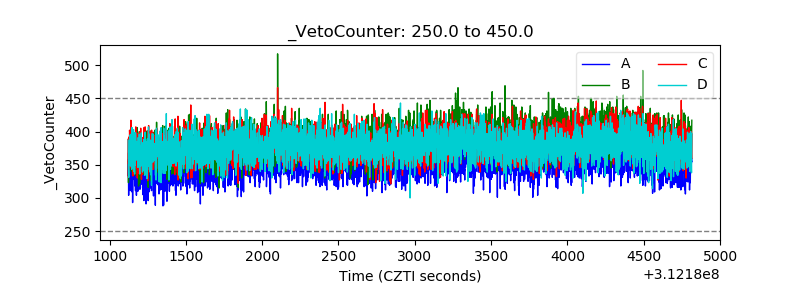 |