| Param | Original file | Final file |
|---|---|---|
| Filename | modeM0/AS1T03_149T08_9000003334cztM0_level2.fits | modeM0/AS1T03_149T08_9000003334cztM0_level2_quad_clean.evt |
| Size (bytes) | 40,864,320 | 38,926,080 |
| Size | 39.0 MB | 37.1 MB |
| Events in quadrant A | 245,218 | 228,517 |
| Events in quadrant B | 229,932 | 223,128 |
| Events in quadrant C | 241,746 | 217,768 |
| Events in quadrant D | 212,634 | 200,370 |
| Mode M0 | |||
|---|---|---|---|
| Quadrant | BADHDUFLAG | Total packets | Discarded packets |
| A | 0 | 8996 | 0 |
| B | 0 | 11378 | 0 |
| C | 0 | 8998 | 0 |
| D | 0 | 9409 | 0 |
| Mode SS | |||
|---|---|---|---|
| Quadrant | BADHDUFLAG | Total packets | Discarded packets |
| A | 0 | 88 | 0 |
| B | 0 | 88 | 0 |
| C | 0 | 88 | 0 |
| D | 0 | 88 | 0 |
| Mode M9 | |||
|---|---|---|---|
| Quadrant | BADHDUFLAG | Total packets | Discarded packets |
| A | 0 | 2 | 0 |
| B | 0 | 2 | 0 |
| C | 0 | 2 | 0 |
| D | 0 | 2 | 0 |
| Quadrant | Total seconds | Saturated seconds | Saturation percentage |
|---|---|---|---|
| A | 4385 | 104 | 2.371722% |
| B | 4385 | 312 | 7.115165% |
| C | 4385 | 122 | 2.782212% |
| D | 4385 | 112 | 2.554162% |
Noise dominated data is calculated using 1-second bins in cleaned event files. If a bin has >2000 counts, and if more than 50% of those come from <1% of pixels, then it is considered to be noise-dominated and hence unusable.
| Quadrant | # 1 sec bins | Bins with >0 counts | Bins with >2000 counts | High rate bins dominated by noise | Noise dominated (total time) | Noise dominated (detector-on time) | Marked lightcurve |
|---|---|---|---|---|---|---|---|
| A | 4550 | 4384 | 0 | 0 | 0.00% | 0.00% |  |
| B | 4550 | 4384 | 0 | 0 | 0.00% | 0.00% |  |
| C | 4550 | 4384 | 0 | 0 | 0.00% | 0.00% |  |
| D | 4550 | 4384 | 0 | 0 | 0.00% | 0.00% |  |
Top three noisy pixels from each quadrant. If the there are fewer than three noisy pixels in the level2.evt file, extra rows are filled as -1
| Pixel properties | Quadrant properties | ||||||
|---|---|---|---|---|---|---|---|
| Quadrant | DetID | PixID | Counts | Sigma | Mean | Median | Sigma |
| A | 0 | 29 | 211 | 8.44 | 63 | 60 | 17.9 |
| A | 9 | 19 | 190 | 7.26 | 63 | 60 | 17.9 |
| A | 7 | 110 | 190 | 7.26 | 63 | 60 | 17.9 |
| B | 2 | 9 | 189 | 9.26 | 60 | 58 | 14.1 |
| B | 3 | 17 | 162 | 7.35 | 60 | 58 | 14.1 |
| B | 5 | 255 | 156 | 6.93 | 60 | 58 | 14.1 |
| C | 4 | 254 | 184 | 6.86 | 63 | 59 | 18.2 |
| C | 3 | 234 | 174 | 6.31 | 63 | 59 | 18.2 |
| C | 12 | 241 | 173 | 6.26 | 63 | 59 | 18.2 |
| D | 3 | 14 | 165 | 6.12 | 60 | 54 | 18.0 |
| D | 7 | 5 | 159 | 5.79 | 60 | 54 | 18.0 |
| D | 10 | 113 | 158 | 5.74 | 60 | 54 | 18.0 |
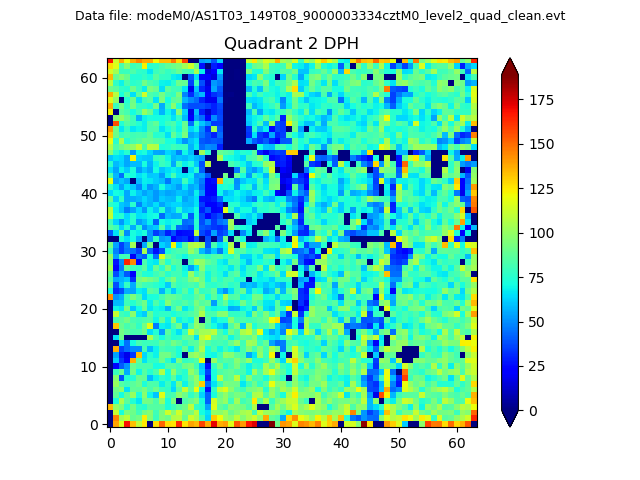
Histogram calculated using DETX and DETY for each event in the final _common_clean file
| Quadrant A |  |
 |
Quadrant B |
|---|---|---|---|
| Quadrant D |  |
 |
Quadrant C |
| Plot type | Count rate plots | Images |
|---|---|---|
| Comparison with Poisson distribution Blue bars denote a histogram of data divided into 1 sec bins. Red curve is a Poisson curve with rate = median count rate of data. |
 |
 |
| Quadrant-wise count rates Data is divided into 100 sec bins |
 |
|
| Module-wise count rates for Quadrant A Data is divided into 100 sec bins |
 |
 |
| Module-wise count rates for Quadrant B Data is divided into 100 sec bins |
 |
 |
| Module-wise count rates for Quadrant C Data is divided into 100 sec bins |
 |
 |
| Module-wise count rates for Quadrant D Data is divided into 100 sec bins |
 |
 |
| Parameter | Plot |
|---|---|
| CZT HV Monitor |  |
| D_VDD |  |
| Temperature 1 |  |
| Veto HV Monitor |  |
| Veto LLD |  |
| Alpha Counter |  |
| _CPM_Rate |  |
| CZT Counter |  |
| +2.5 Volts monitor |  |
| +5 Volts monitor |  |
| _ROLL_ROT |  |
| _Roll_DEC |  |
| _Roll_RA |  |
| Veto Counter |  |