| Param | Original file | Final file |
|---|---|---|
| Filename | modeM0/AS1T03_149T08_9000003334_22456cztM0_level2.evt | modeM0/AS1T03_149T08_9000003334_22456cztM0_level2_quad_clean.evt |
| Size (bytes) | 253,563,840 | 36,259,200 |
| Size | 241.8 MB | 34.6 MB |
| Events in quadrant A | 1,611,337 | 213,036 |
| Events in quadrant B | 2,433,961 | 211,722 |
| Events in quadrant C | 1,644,833 | 208,451 |
| Events in quadrant D | 1,738,003 | 204,791 |
| Mode M0 | |||
|---|---|---|---|
| Quadrant | BADHDUFLAG | Total packets | Discarded packets |
| A | 0 | 7354 | 0 |
| B | 0 | 9624 | 0 |
| C | 0 | 7359 | 0 |
| D | 0 | 7789 | 0 |
| Mode SS | |||
|---|---|---|---|
| Quadrant | BADHDUFLAG | Total packets | Discarded packets |
| A | 0 | 72 | 0 |
| B | 0 | 72 | 0 |
| C | 0 | 72 | 0 |
| D | 0 | 72 | 0 |
| Quadrant | Total seconds | Saturated seconds | Saturation percentage |
|---|---|---|---|
| A | 3669 | 3 | 0.081766% |
| B | 3670 | 186 | 5.068120% |
| C | 3670 | 13 | 0.354223% |
| D | 3670 | 23 | 0.626703% |
Noise dominated data is calculated using 1-second bins in cleaned event files. If a bin has >2000 counts, and if more than 50% of those come from <1% of pixels, then it is considered to be noise-dominated and hence unusable.
| Quadrant | # 1 sec bins | Bins with >0 counts | Bins with >2000 counts | High rate bins dominated by noise | Noise dominated (total time) | Noise dominated (detector-on time) | Marked lightcurve |
|---|---|---|---|---|---|---|---|
| A | 3669 | 3669 | 0 | 0 | 0.00% | 0.00% | 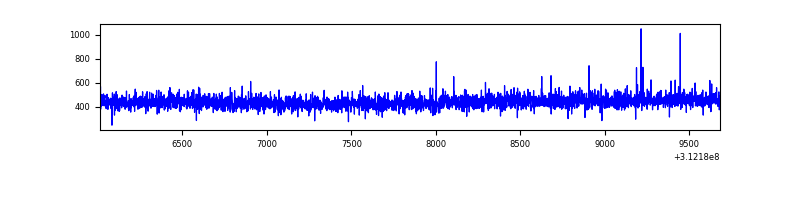 |
| B | 3670 | 3670 | 140 | 140 | 3.81% | 3.81% | 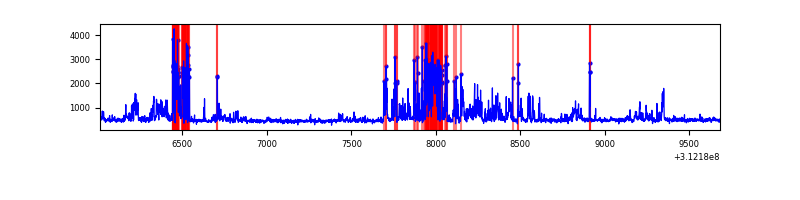 |
| C | 3670 | 3670 | 0 | 0 | 0.00% | 0.00% | 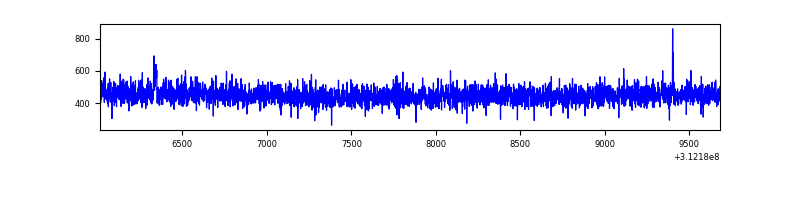 |
| D | 3670 | 3670 | 18 | 18 | 0.49% | 0.49% | 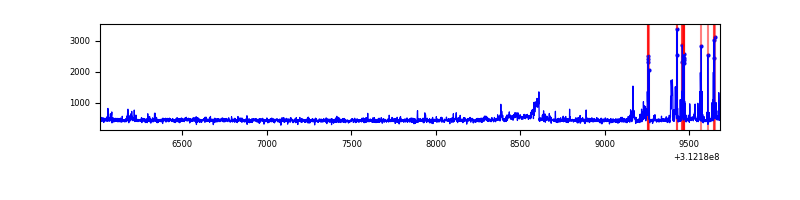 |
Top three noisy pixels from each quadrant. If the there are fewer than three noisy pixels in the level2.evt file, extra rows are filled as -1
| Pixel properties | Quadrant properties | ||||||
|---|---|---|---|---|---|---|---|
| Quadrant | DetID | PixID | Counts | Sigma | Mean | Median | Sigma |
| A | 13 | 254 | 4453 | 47.37 | 417 | 405 | 85.5 |
| A | 3 | 137 | 3651 | 37.99 | 417 | 405 | 85.5 |
| A | 0 | 226 | 3580 | 37.16 | 417 | 405 | 85.5 |
| B | 10 | 245 | 832739 | 10506.19 | 406 | 395 | 79.2 |
| B | 12 | 111 | 9371 | 113.3 | 406 | 395 | 79.2 |
| B | 11 | 111 | 8454 | 101.72 | 406 | 395 | 79.2 |
| C | 14 | 238 | 63532 | 653.49 | 404 | 405 | 96.6 |
| C | 10 | 22 | 5327 | 50.95 | 404 | 405 | 96.6 |
| C | 13 | 61 | 2771 | 24.49 | 404 | 405 | 96.6 |
| D | 13 | 172 | 107869 | 1058.36 | 412 | 399 | 101.5 |
| D | 7 | 223 | 36019 | 350.78 | 412 | 399 | 101.5 |
| D | 9 | 85 | 27228 | 264.21 | 412 | 399 | 101.5 |
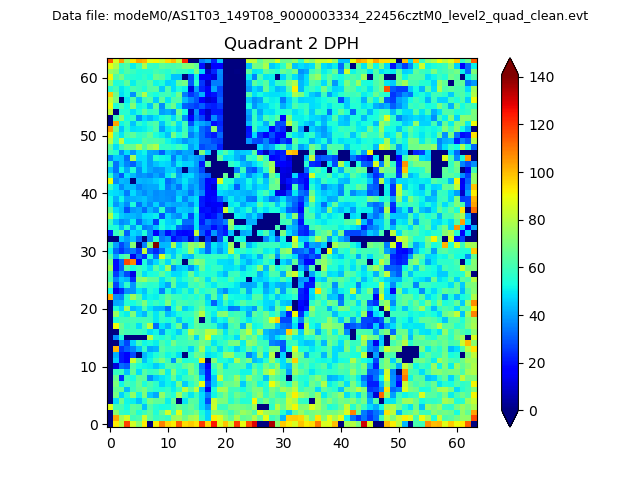
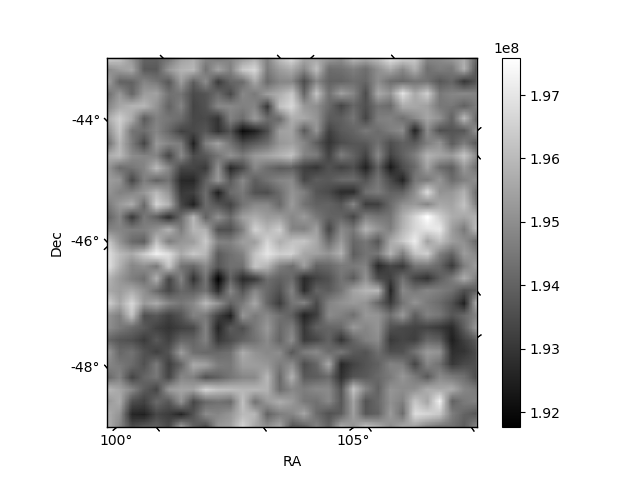
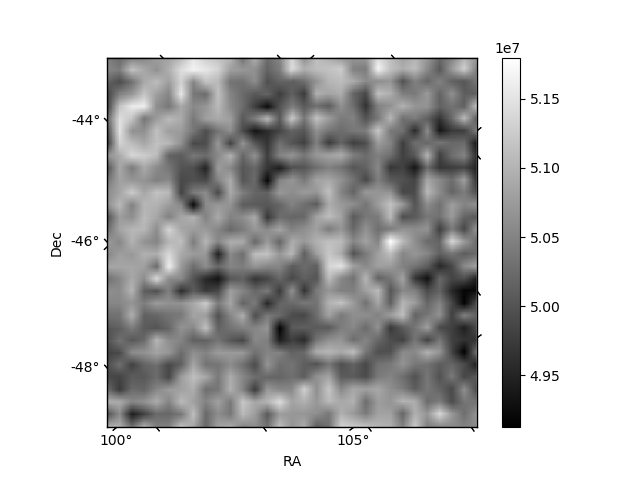
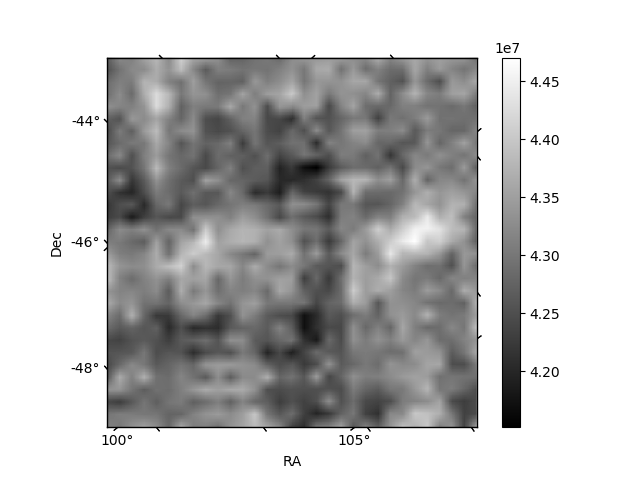
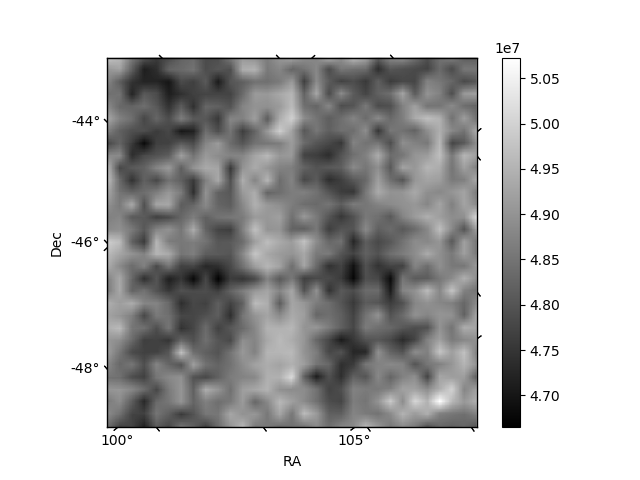
Histogram calculated using DETX and DETY for each event in the final _common_clean file
| Quadrant A | 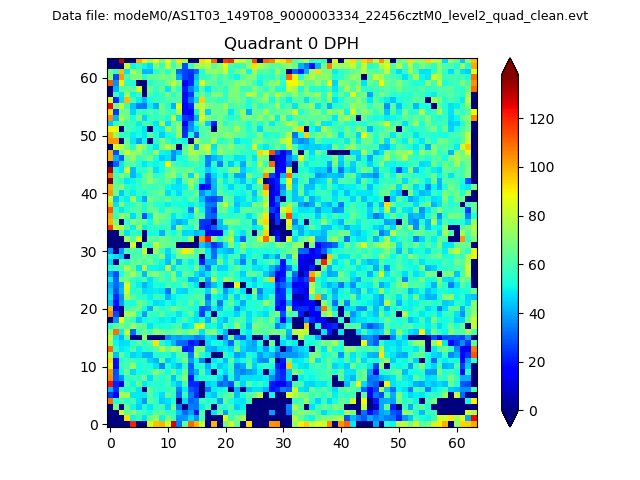 |
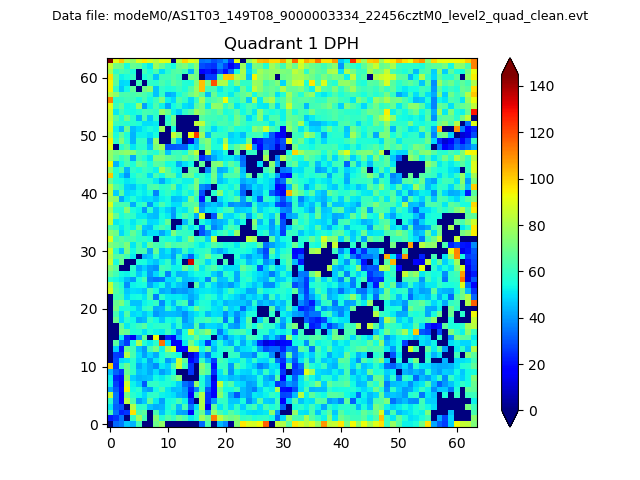 |
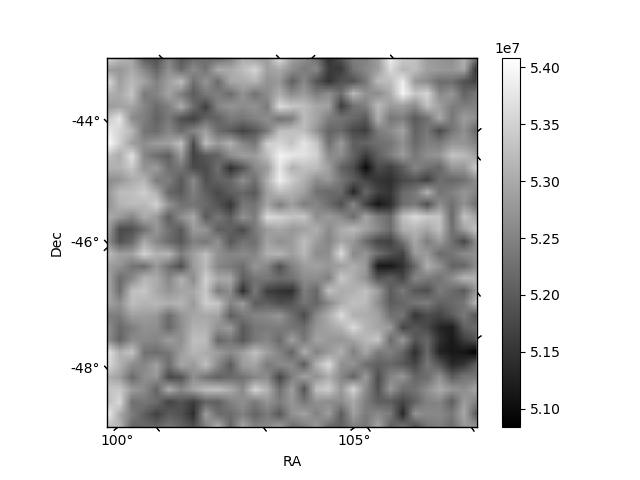
Quadrant B |
|---|---|---|---|
| Quadrant D | 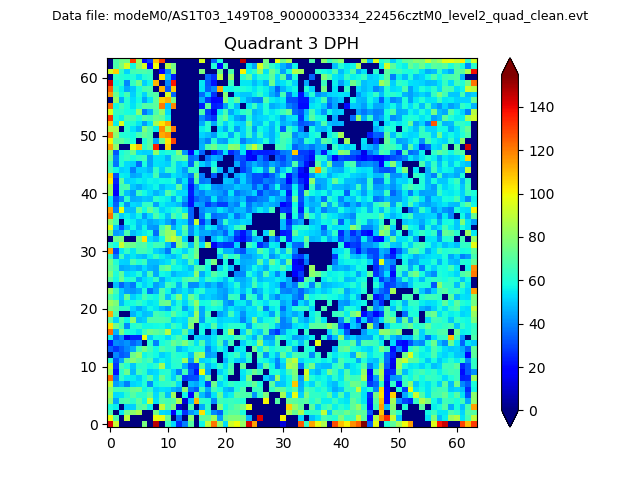 |
 |
Quadrant C |
| Plot type | Count rate plots | Images |
|---|---|---|
| Comparison with Poisson distribution Blue bars denote a histogram of data divided into 1 sec bins. Red curve is a Poisson curve with rate = median count rate of data. |
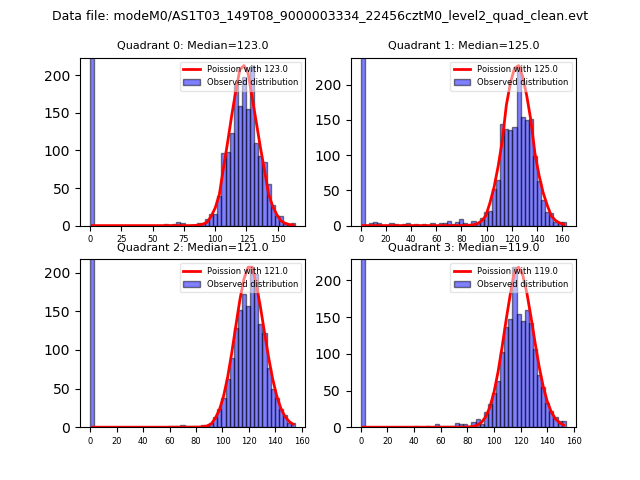 |
 |
| Quadrant-wise count rates Data is divided into 100 sec bins |
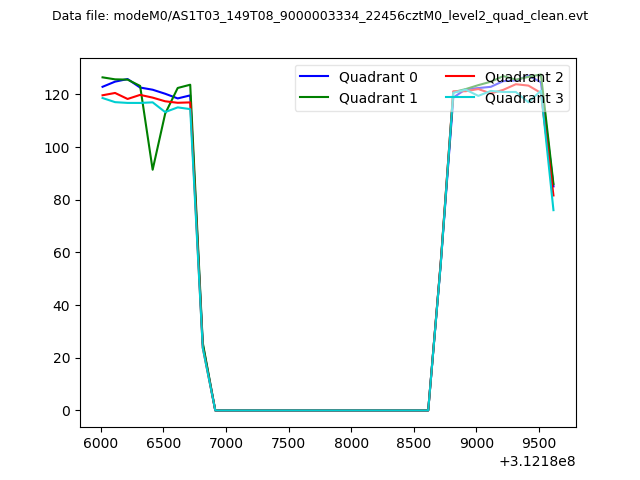 |
|
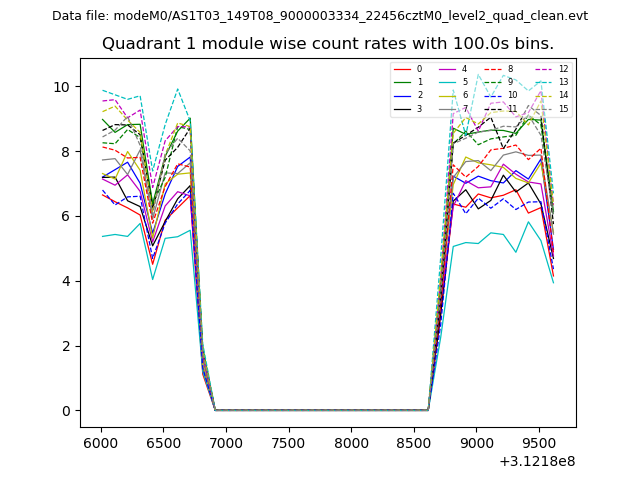
| Module-wise count rates for Quadrant A Data is divided into 100 sec bins |
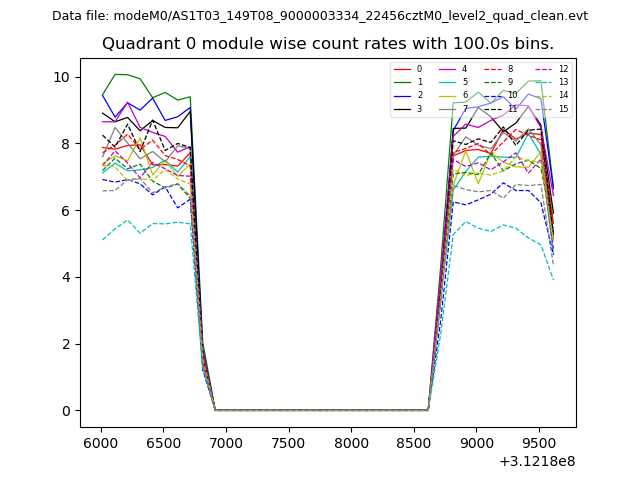 |
 |
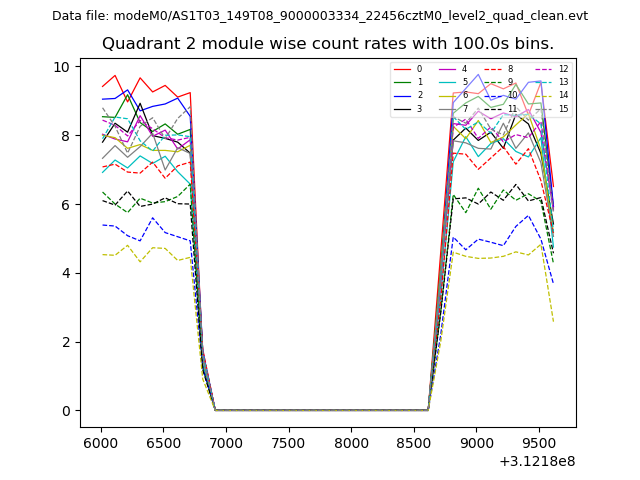
| Module-wise count rates for Quadrant B Data is divided into 100 sec bins |
 |
 |
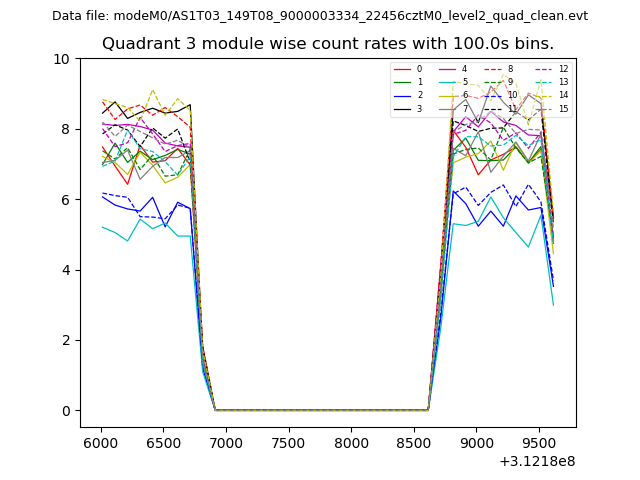
| Module-wise count rates for Quadrant C Data is divided into 100 sec bins |
 |
 |
| Module-wise count rates for Quadrant D Data is divided into 100 sec bins |
 |
 |
| Parameter | Plot |
|---|---|
| CZT HV Monitor | 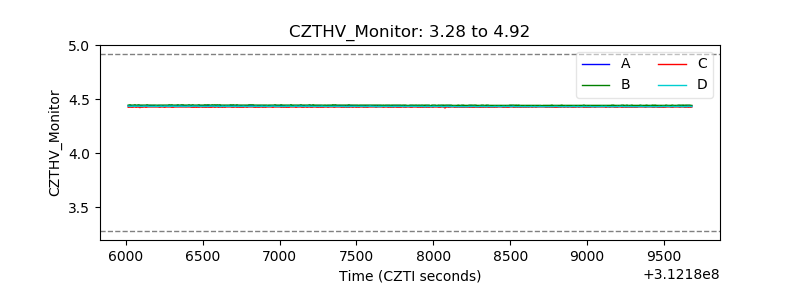 |
| D_VDD | 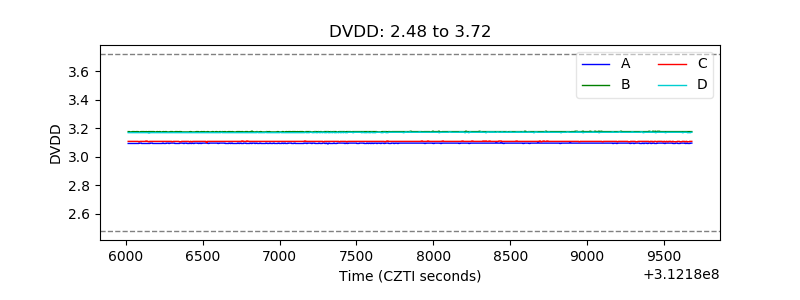 |
| Temperature 1 | 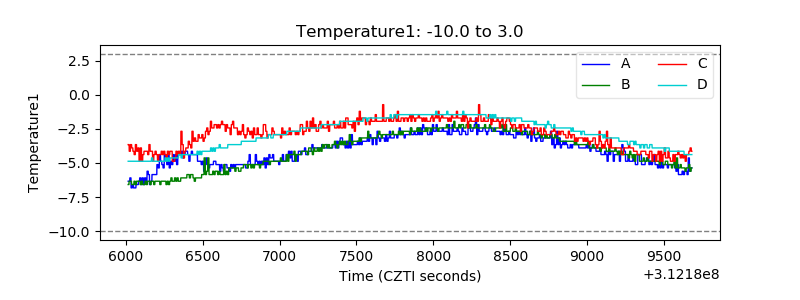 |
| Veto HV Monitor | 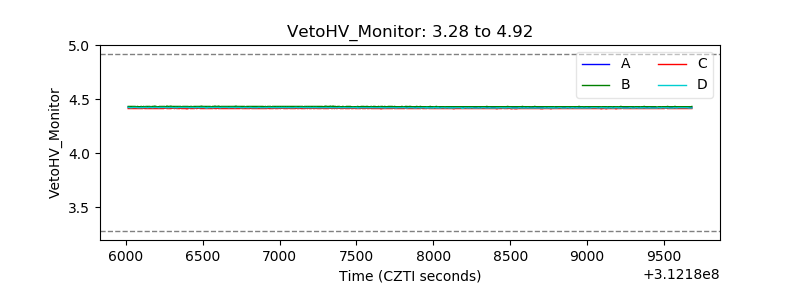 |
| Veto LLD | 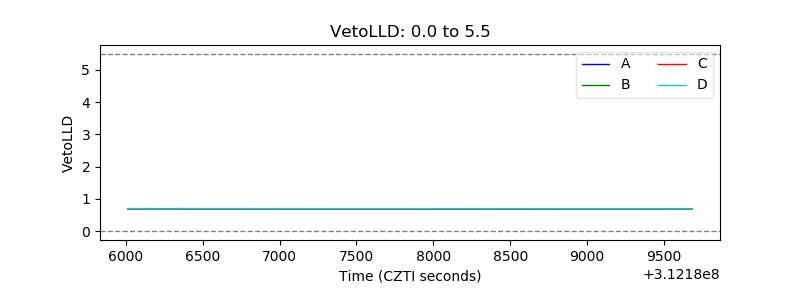 |
| Alpha Counter | 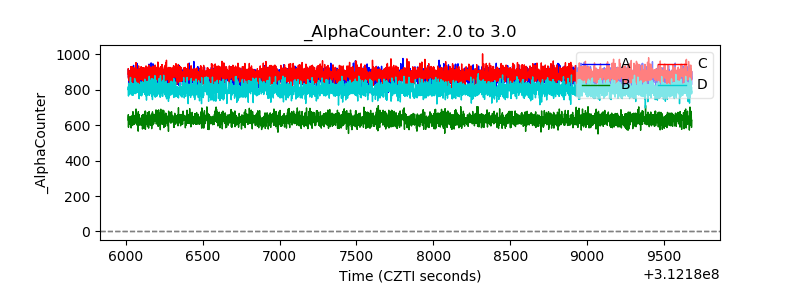 |
| _CPM_Rate | 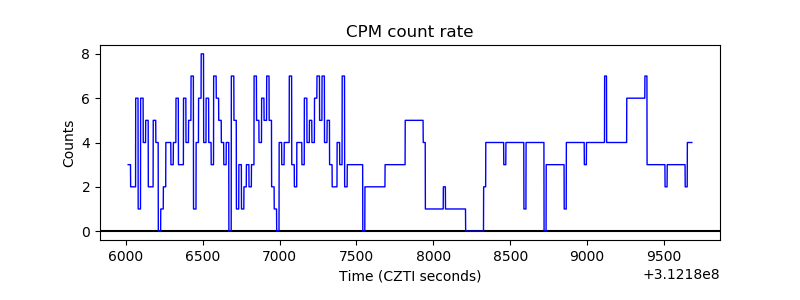 |
| CZT Counter | 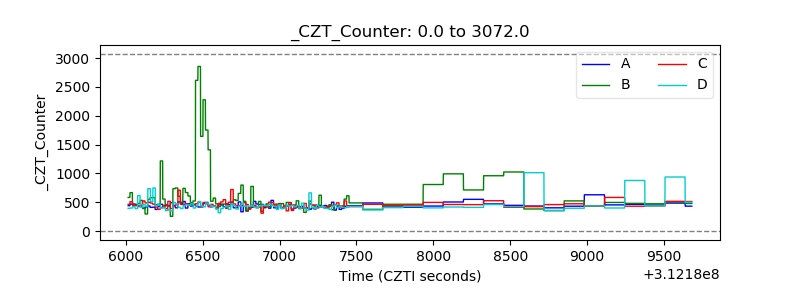 |
| +2.5 Volts monitor |  |
| +5 Volts monitor |  |
| _ROLL_ROT | 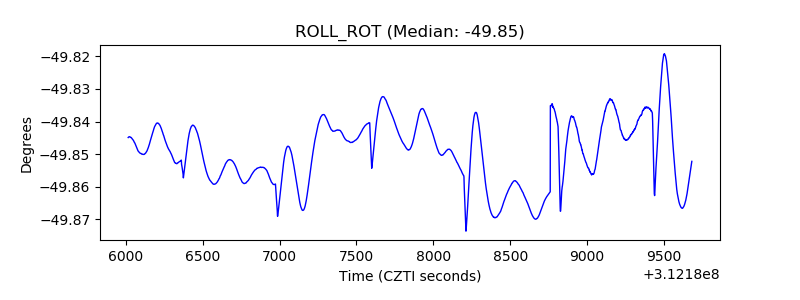 |
| _Roll_DEC | 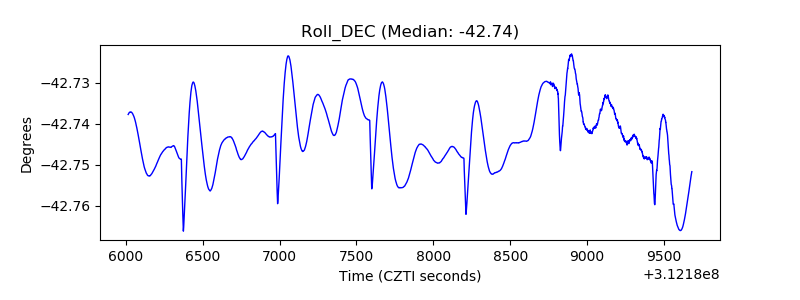 |
| _Roll_RA | 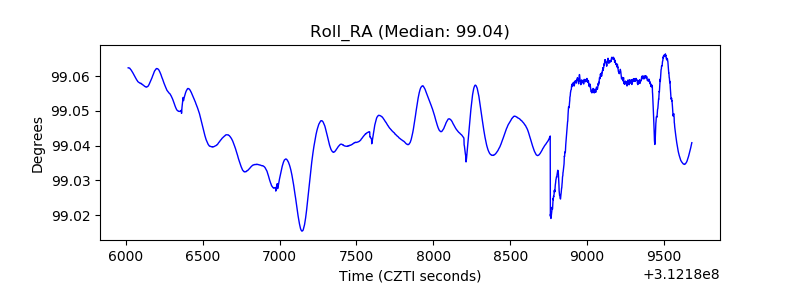 |
| Veto Counter | 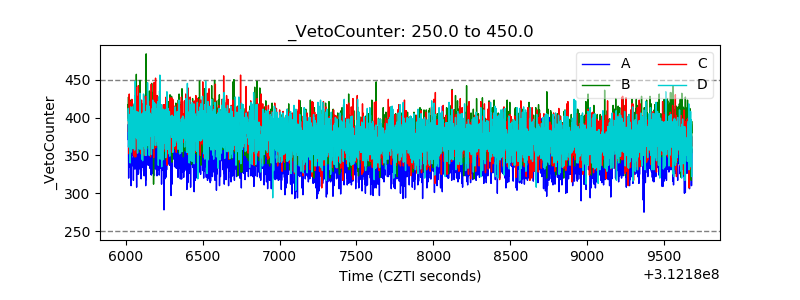 |