| Param | Original file | Final file |
|---|---|---|
| Filename | modeM0/AS1T03_149T09_9000003336cztM0_level2.fits | modeM0/AS1T03_149T09_9000003336cztM0_level2_quad_clean.evt |
| Size (bytes) | 48,660,480 | 32,417,280 |
| Size | 46.4 MB | 30.9 MB |
| Events in quadrant A | 291,268 | 160,946 |
| Events in quadrant B | 275,502 | 155,353 |
| Events in quadrant C | 287,354 | 154,844 |
| Events in quadrant D | 253,896 | 143,564 |
| Mode M0 | |||
|---|---|---|---|
| Quadrant | BADHDUFLAG | Total packets | Discarded packets |
| A | 0 | 10721 | 0 |
| B | 0 | 13679 | 0 |
| C | 0 | 10736 | 0 |
| D | 0 | 11354 | 0 |
| Mode SS | |||
|---|---|---|---|
| Quadrant | BADHDUFLAG | Total packets | Discarded packets |
| A | 0 | 104 | 0 |
| B | 0 | 104 | 0 |
| C | 0 | 104 | 0 |
| D | 0 | 104 | 0 |
| Mode M9 | |||
|---|---|---|---|
| Quadrant | BADHDUFLAG | Total packets | Discarded packets |
| A | 0 | 4 | 0 |
| B | 0 | 4 | 0 |
| C | 0 | 4 | 0 |
| D | 0 | 4 | 0 |
| Quadrant | Total seconds | Saturated seconds | Saturation percentage |
|---|---|---|---|
| A | 5229 | 93 | 1.778543% |
| B | 5229 | 384 | 7.343660% |
| C | 5229 | 122 | 2.333142% |
| D | 5229 | 115 | 2.199273% |
Noise dominated data is calculated using 1-second bins in cleaned event files. If a bin has >2000 counts, and if more than 50% of those come from <1% of pixels, then it is considered to be noise-dominated and hence unusable.
| Quadrant | # 1 sec bins | Bins with >0 counts | Bins with >2000 counts | High rate bins dominated by noise | Noise dominated (total time) | Noise dominated (detector-on time) | Marked lightcurve |
|---|---|---|---|---|---|---|---|
| A | 5584 | 5228 | 0 | 0 | 0.00% | 0.00% |  |
| B | 5584 | 5226 | 0 | 0 | 0.00% | 0.00% |  |
| C | 5584 | 5228 | 0 | 0 | 0.00% | 0.00% |  |
| D | 5584 | 5227 | 0 | 0 | 0.00% | 0.00% |  |
Top three noisy pixels from each quadrant. If the there are fewer than three noisy pixels in the level2.evt file, extra rows are filled as -1
| Pixel properties | Quadrant properties | ||||||
|---|---|---|---|---|---|---|---|
| Quadrant | DetID | PixID | Counts | Sigma | Mean | Median | Sigma |
| A | 0 | 29 | 278 | 9.8 | 75 | 71 | 21.1 |
| A | 7 | 110 | 229 | 7.48 | 75 | 71 | 21.1 |
| A | 9 | 19 | 226 | 7.34 | 75 | 71 | 21.1 |
| B | 2 | 9 | 225 | 9.16 | 72 | 69 | 17.0 |
| B | 3 | 17 | 189 | 7.05 | 72 | 69 | 17.0 |
| B | 5 | 235 | 188 | 6.99 | 72 | 69 | 17.0 |
| C | 2 | 191 | 212 | 6.73 | 75 | 71 | 20.9 |
| C | 12 | 241 | 206 | 6.44 | 75 | 71 | 20.9 |
| C | 1 | 81 | 206 | 6.44 | 75 | 71 | 20.9 |
| D | 3 | 14 | 219 | 7.5 | 72 | 66 | 20.4 |
| D | 15 | 46 | 197 | 6.42 | 72 | 66 | 20.4 |
| D | 10 | 189 | 187 | 5.93 | 72 | 66 | 20.4 |
Histogram calculated using DETX and DETY for each event in the final _common_clean file
| Quadrant A | 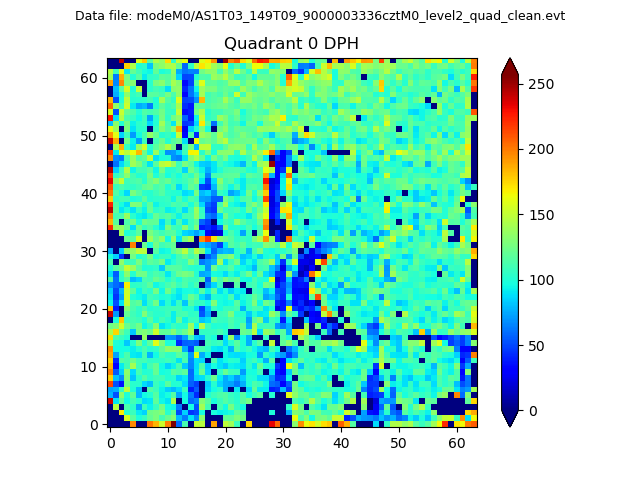 |
 |
Quadrant B |
|---|---|---|---|
| Quadrant D |  |
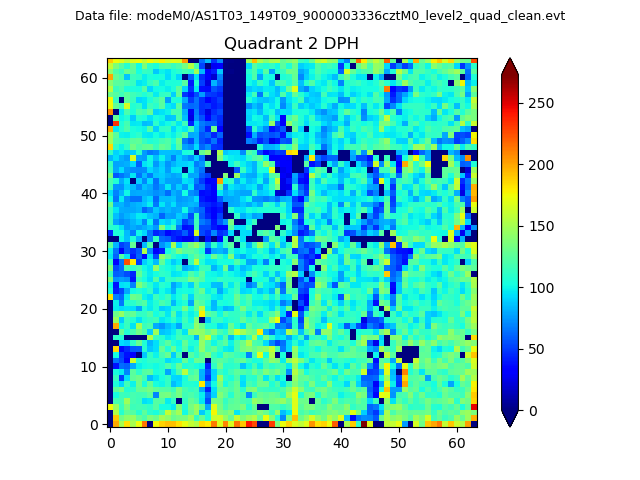 |
Quadrant C |
| Plot type | Count rate plots | Images |
|---|---|---|
| Comparison with Poisson distribution Blue bars denote a histogram of data divided into 1 sec bins. Red curve is a Poisson curve with rate = median count rate of data. |
 |
 |
| Quadrant-wise count rates Data is divided into 100 sec bins |
 |
|
| Module-wise count rates for Quadrant A Data is divided into 100 sec bins |
 |
 |
| Module-wise count rates for Quadrant B Data is divided into 100 sec bins |
 |
 |
| Module-wise count rates for Quadrant C Data is divided into 100 sec bins |
 |
 |
| Module-wise count rates for Quadrant D Data is divided into 100 sec bins |
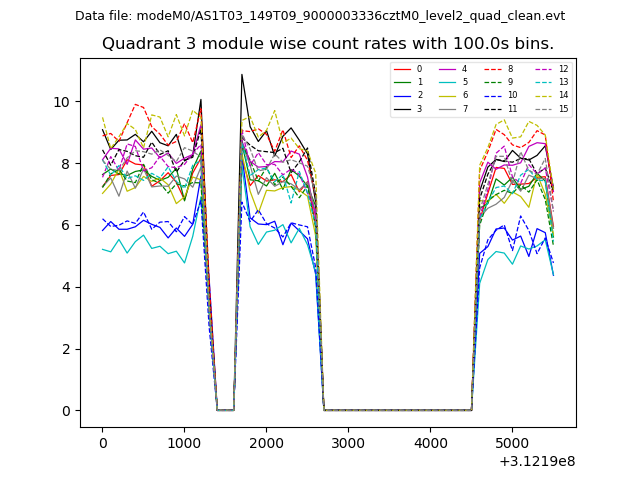 |
 |
| Parameter | Plot |
|---|---|
| CZT HV Monitor |  |
| D_VDD |  |
| Temperature 1 |  |
| Veto HV Monitor | 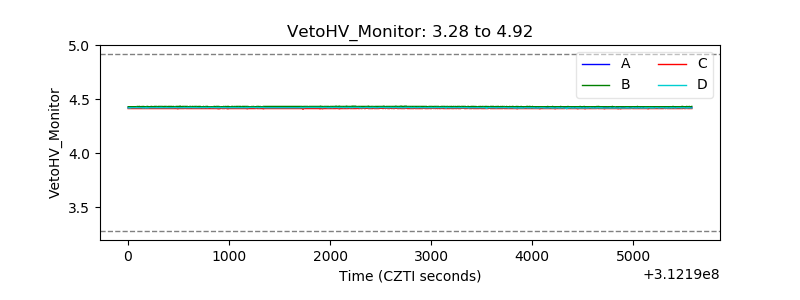 |
| Veto LLD |  |
| Alpha Counter |  |
| _CPM_Rate | 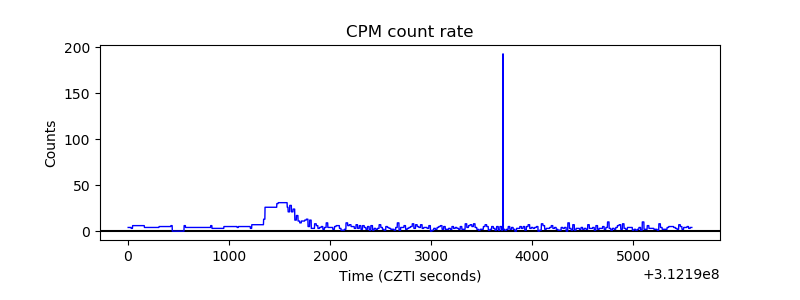 |
| CZT Counter | 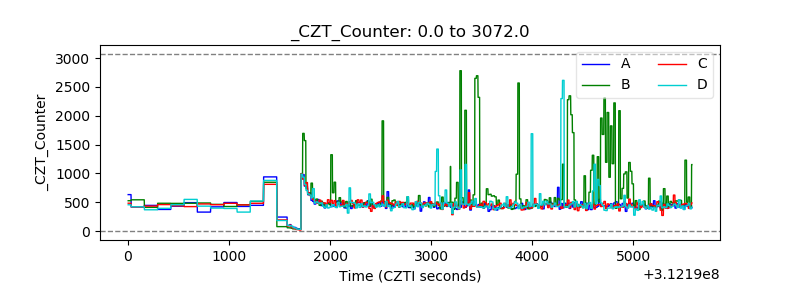 |
| +2.5 Volts monitor |  |
| +5 Volts monitor | 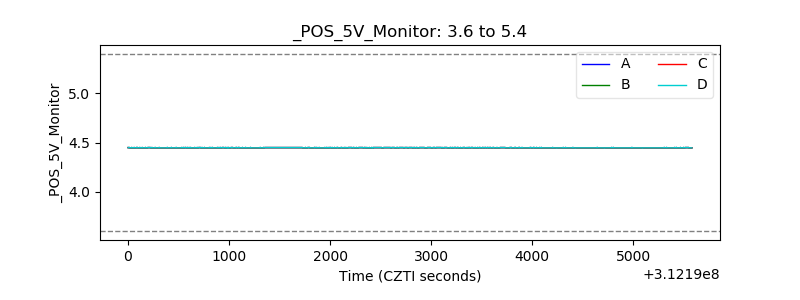 |
| _ROLL_ROT | 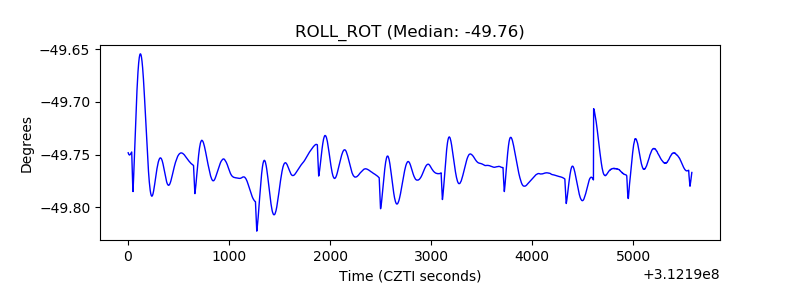 |
| _Roll_DEC |  |
| _Roll_RA |  |
| Veto Counter | 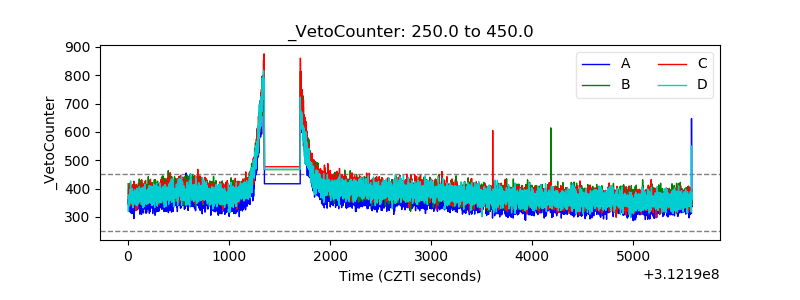 |