| Param | Original file | Final file |
|---|---|---|
| Filename | modeM0/AS1T03_149T09_9000003336_22458cztM0_level2.evt | modeM0/AS1T03_149T09_9000003336_22458cztM0_level2_quad_clean.evt |
| Size (bytes) | 244,722,240 | 31,449,600 |
| Size | 233.4 MB | 30.0 MB |
| Events in quadrant A | 1,511,551 | 180,435 |
| Events in quadrant B | 2,450,770 | 178,543 |
| Events in quadrant C | 1,531,055 | 176,420 |
| Events in quadrant D | 1,684,671 | 174,580 |
| Mode M0 | |||
|---|---|---|---|
| Quadrant | BADHDUFLAG | Total packets | Discarded packets |
| A | 0 | 6836 | 0 |
| B | 0 | 9519 | 0 |
| C | 0 | 6843 | 0 |
| D | 0 | 7415 | 0 |
| Mode SS | |||
|---|---|---|---|
| Quadrant | BADHDUFLAG | Total packets | Discarded packets |
| A | 0 | 68 | 0 |
| B | 0 | 68 | 0 |
| C | 0 | 68 | 0 |
| D | 0 | 68 | 0 |
| Quadrant | Total seconds | Saturated seconds | Saturation percentage |
|---|---|---|---|
| A | 3408 | 3 | 0.088028% |
| B | 3408 | 253 | 7.423709% |
| C | 3409 | 13 | 0.381344% |
| D | 3409 | 42 | 1.232033% |
Noise dominated data is calculated using 1-second bins in cleaned event files. If a bin has >2000 counts, and if more than 50% of those come from <1% of pixels, then it is considered to be noise-dominated and hence unusable.
| Quadrant | # 1 sec bins | Bins with >0 counts | Bins with >2000 counts | High rate bins dominated by noise | Noise dominated (total time) | Noise dominated (detector-on time) | Marked lightcurve |
|---|---|---|---|---|---|---|---|
| A | 3408 | 3408 | 0 | 0 | 0.00% | 0.00% | 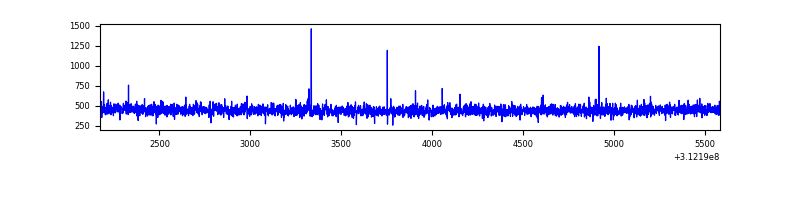 |
| B | 3408 | 3408 | 207 | 207 | 6.07% | 6.07% | 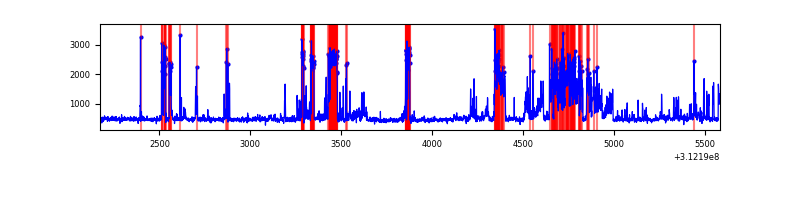 |
| C | 3409 | 3409 | 0 | 0 | 0.00% | 0.00% | 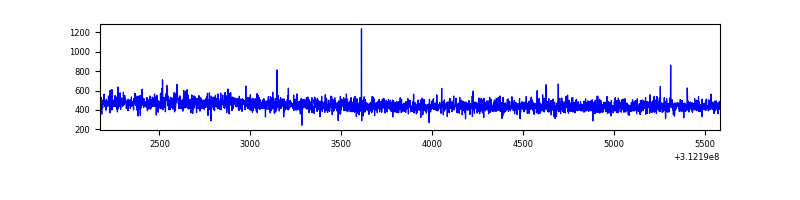 |
| D | 3409 | 3409 | 36 | 36 | 1.06% | 1.06% | 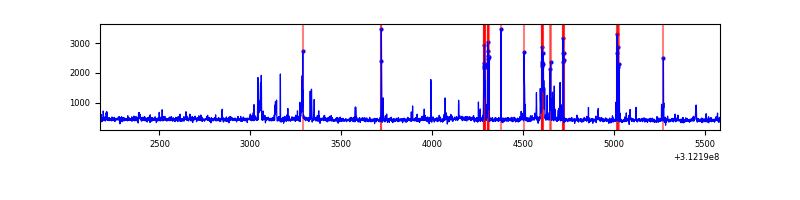 |
Top three noisy pixels from each quadrant. If the there are fewer than three noisy pixels in the level2.evt file, extra rows are filled as -1
| Pixel properties | Quadrant properties | ||||||
|---|---|---|---|---|---|---|---|
| Quadrant | DetID | PixID | Counts | Sigma | Mean | Median | Sigma |
| A | 3 | 1 | 5678 | 65.78 | 390 | 381 | 80.5 |
| A | 13 | 254 | 4948 | 56.71 | 390 | 381 | 80.5 |
| A | 3 | 137 | 3412 | 37.64 | 390 | 381 | 80.5 |
| B | 10 | 245 | 923122 | 12522.78 | 376 | 366 | 73.7 |
| B | 4 | 173 | 52752 | 710.93 | 376 | 366 | 73.7 |
| B | 12 | 111 | 8644 | 112.34 | 376 | 366 | 73.7 |
| C | 14 | 238 | 60343 | 669.96 | 376 | 377 | 89.5 |
| C | 13 | 61 | 2644 | 25.33 | 376 | 377 | 89.5 |
| C | 10 | 91 | 1931 | 17.36 | 376 | 377 | 89.5 |
| D | 1 | 52 | 158239 | 1656.49 | 381 | 369 | 95.3 |
| D | 13 | 172 | 78406 | 818.82 | 381 | 369 | 95.3 |
| D | 2 | 234 | 14061 | 143.67 | 381 | 369 | 95.3 |
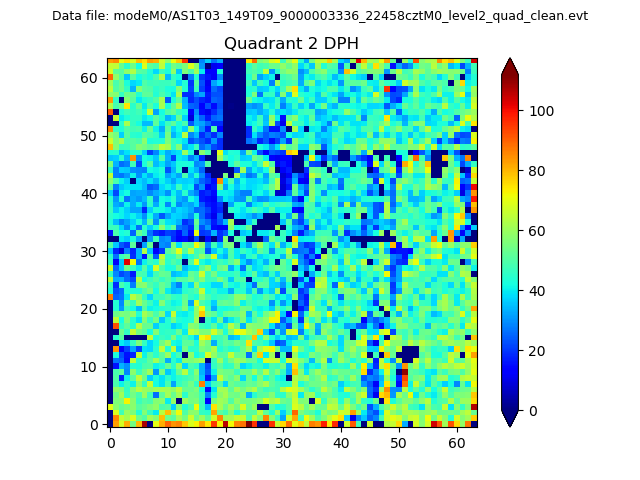
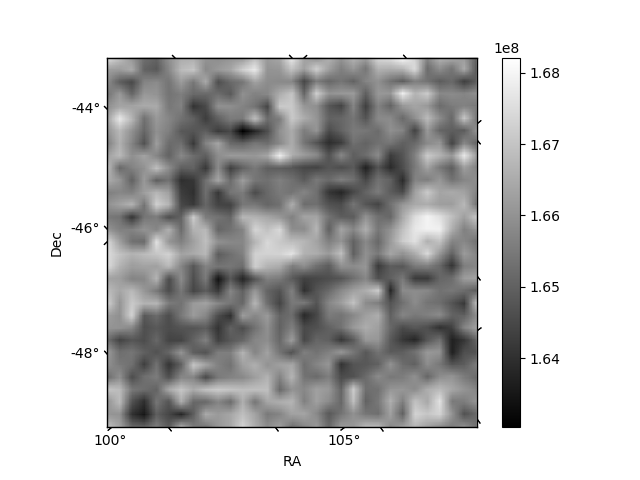
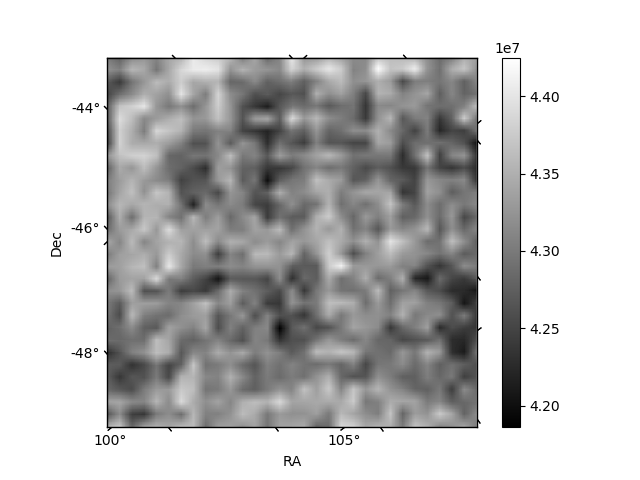
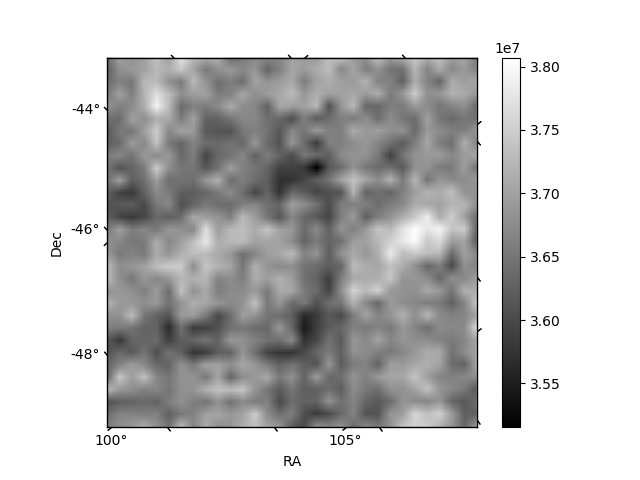
Histogram calculated using DETX and DETY for each event in the final _common_clean file
| Quadrant A | 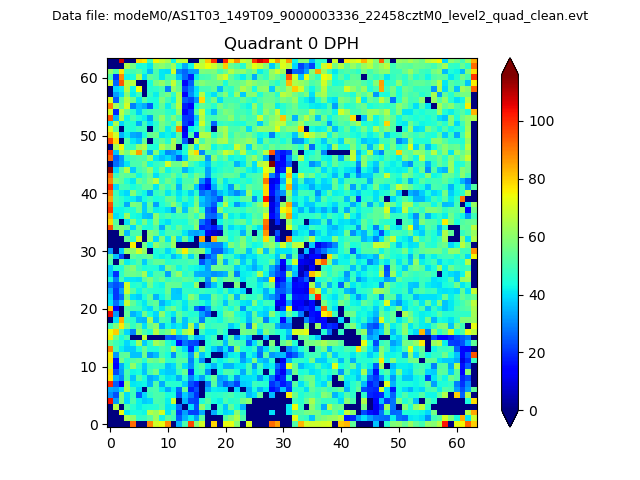 |
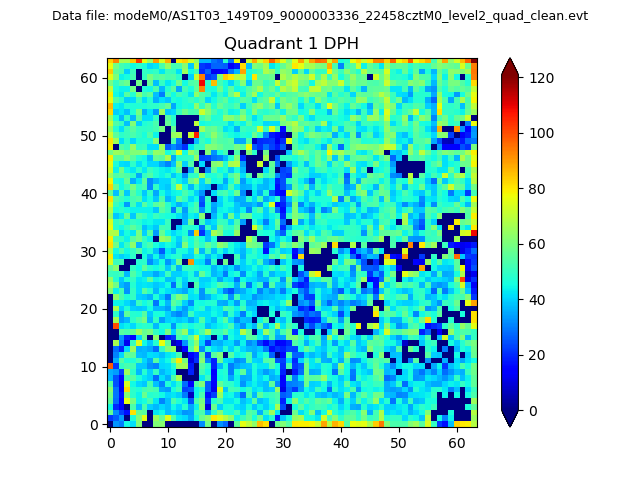 |
Quadrant B |
|---|---|---|---|
| Quadrant D | 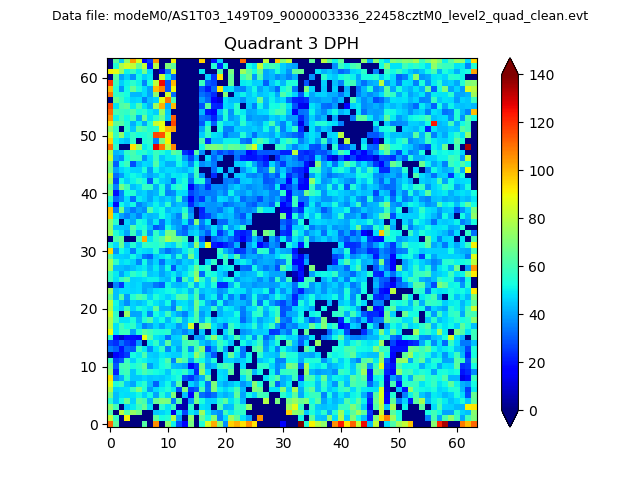 |
 |
Quadrant C |
| Plot type | Count rate plots | Images |
|---|---|---|
| Comparison with Poisson distribution Blue bars denote a histogram of data divided into 1 sec bins. Red curve is a Poisson curve with rate = median count rate of data. |
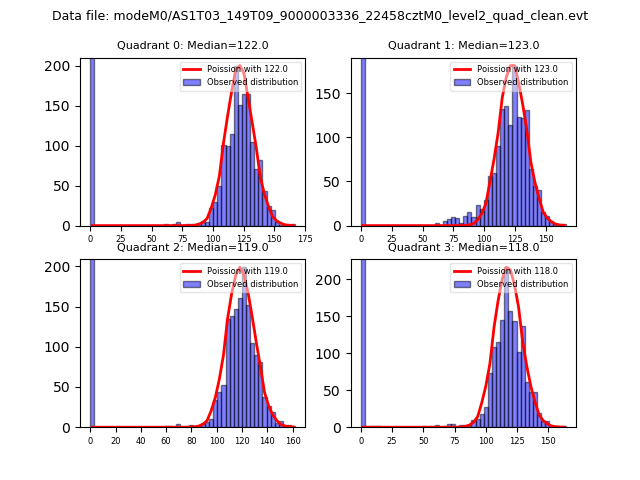 |
 |
| Quadrant-wise count rates Data is divided into 100 sec bins |
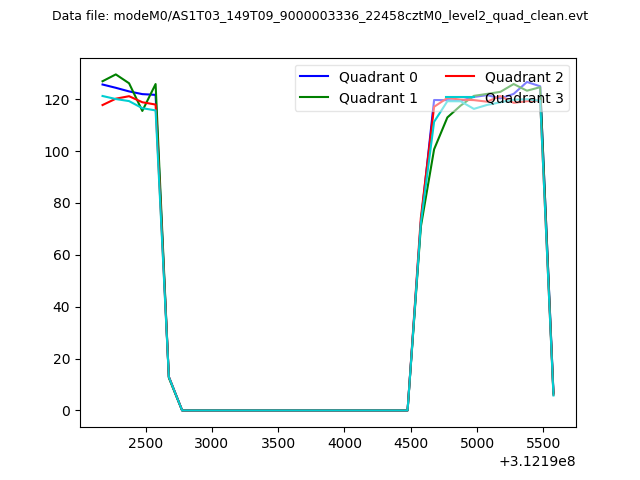 |
|
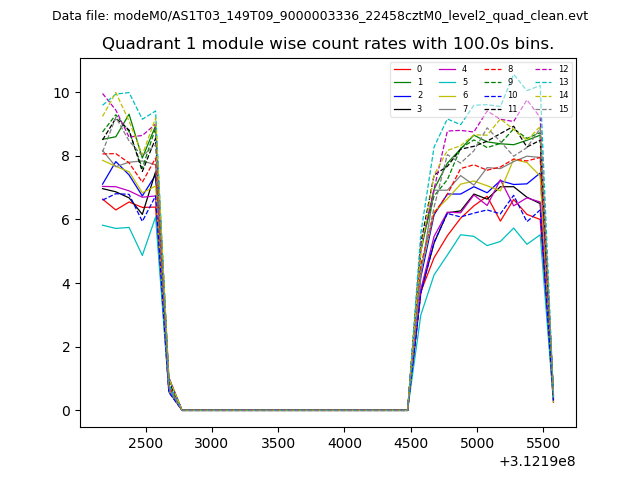
| Module-wise count rates for Quadrant A Data is divided into 100 sec bins |
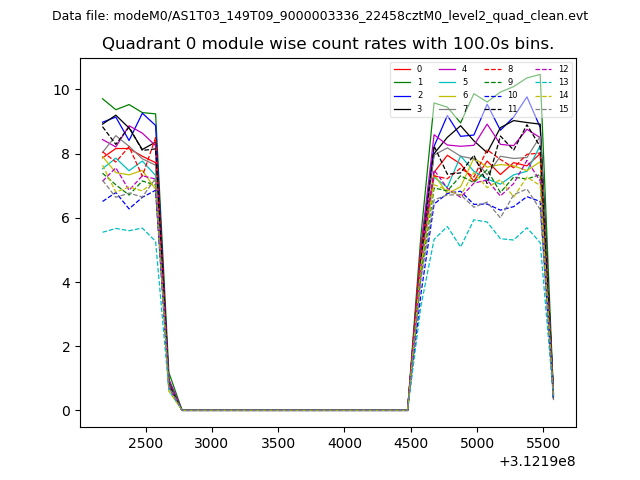 |
 |
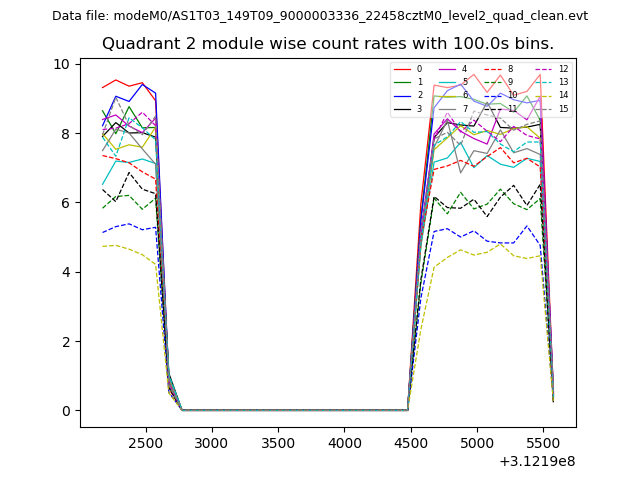
| Module-wise count rates for Quadrant B Data is divided into 100 sec bins |
 |
 |
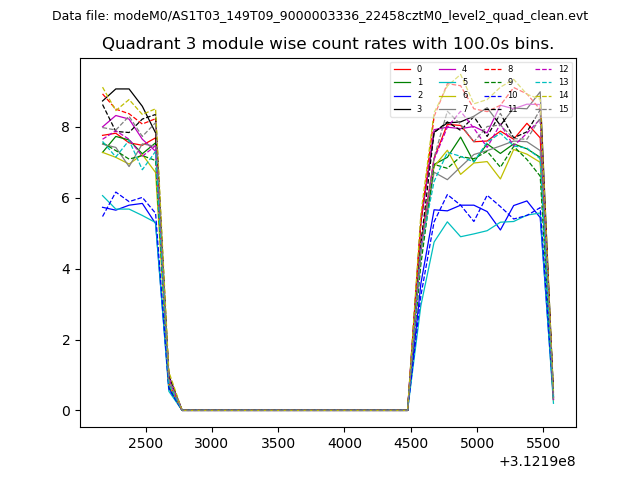
| Module-wise count rates for Quadrant C Data is divided into 100 sec bins |
 |
 |
| Module-wise count rates for Quadrant D Data is divided into 100 sec bins |
 |
 |
| Parameter | Plot |
|---|---|
| CZT HV Monitor | 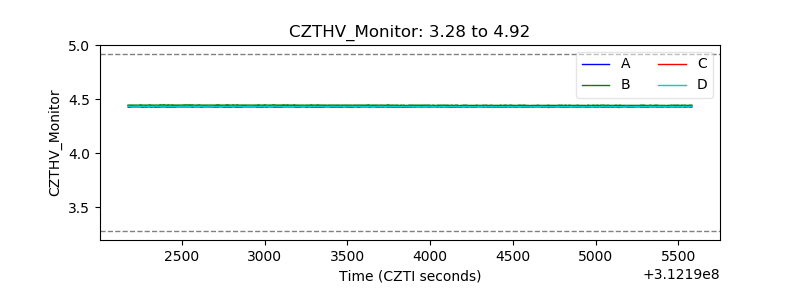 |
| D_VDD | 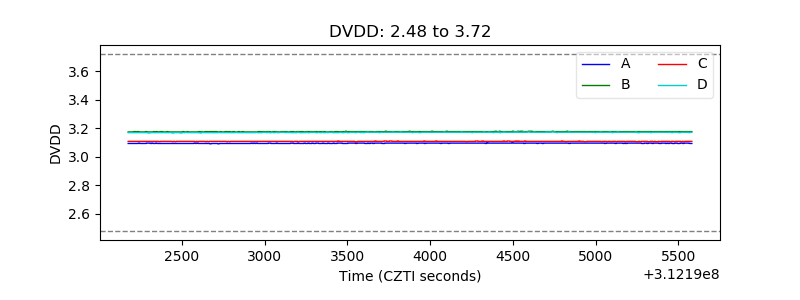 |
| Temperature 1 | 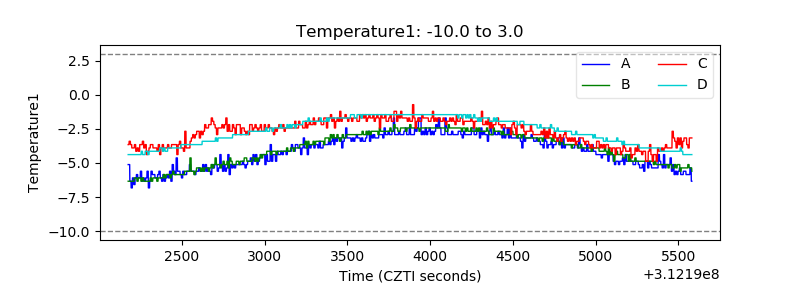 |
| Veto HV Monitor |  |
| Veto LLD | 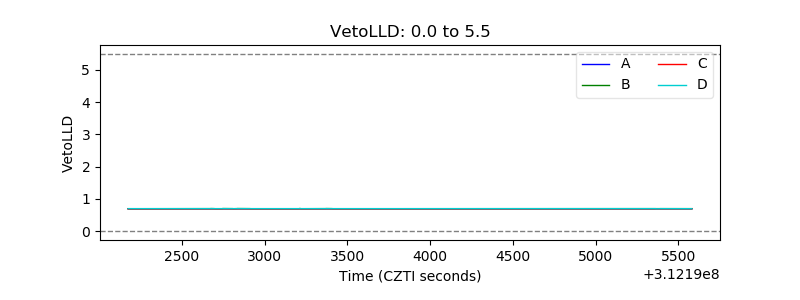 |
| Alpha Counter | 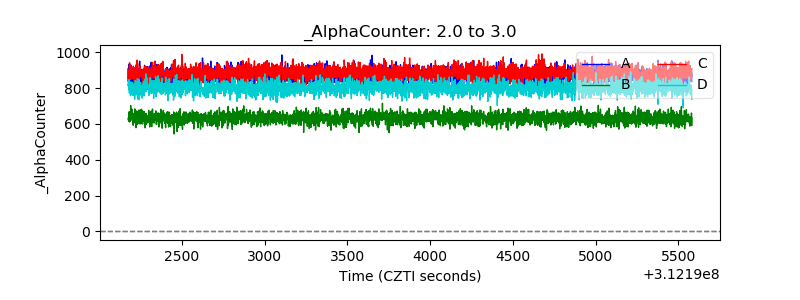 |
| _CPM_Rate |  |
| CZT Counter | 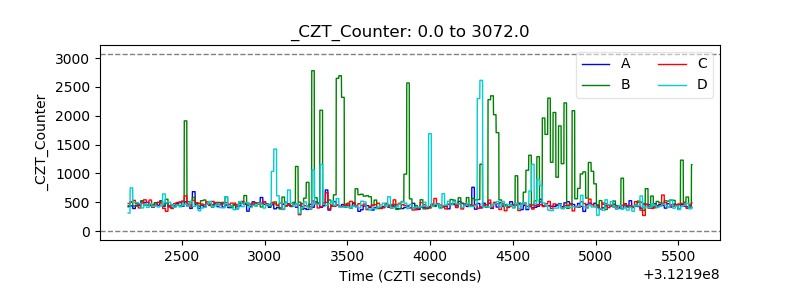 |
| +2.5 Volts monitor | 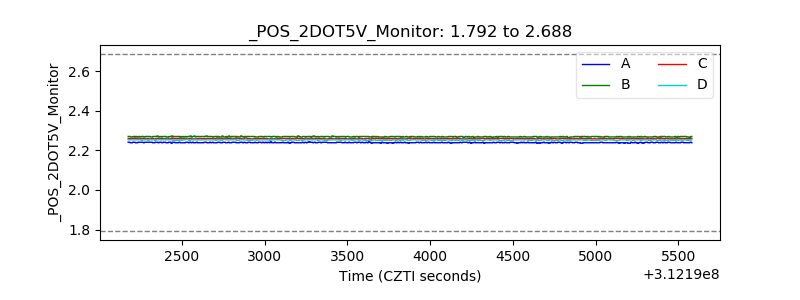 |
| +5 Volts monitor | 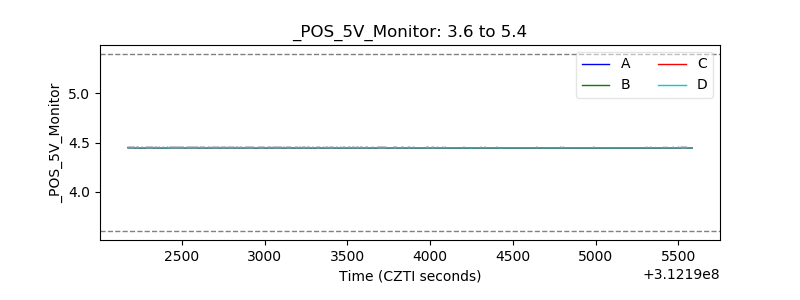 |
| _ROLL_ROT | 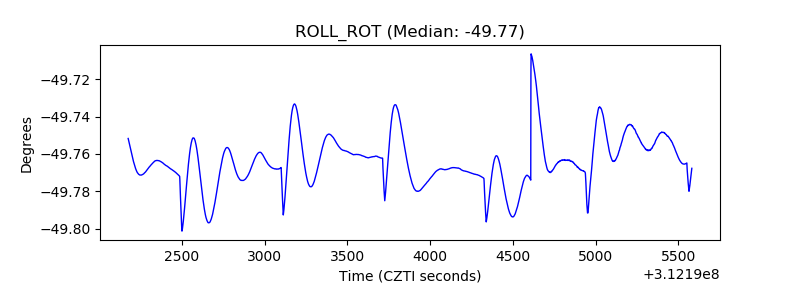 |
| _Roll_DEC | 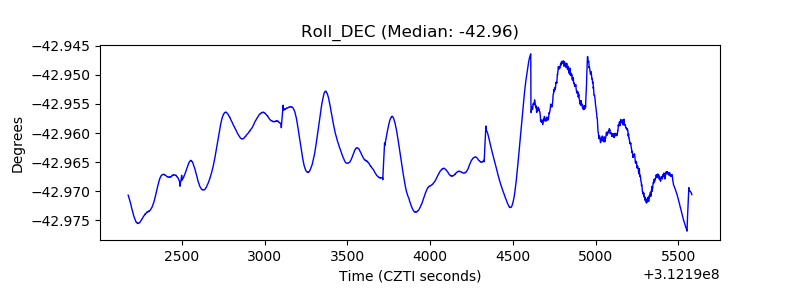 |
| _Roll_RA | 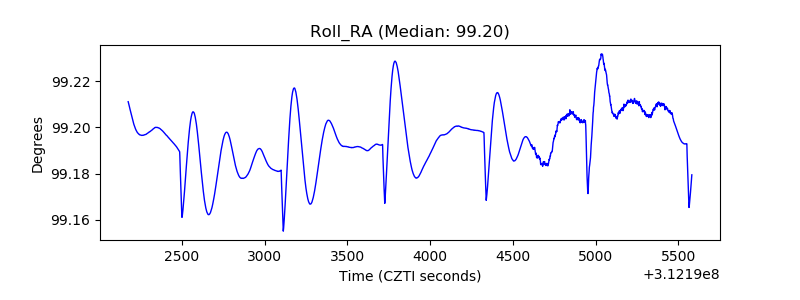 |
| Veto Counter | 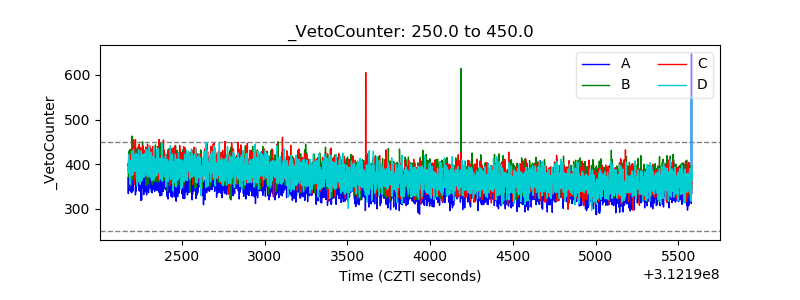 |