| Param | Original file | Final file |
|---|---|---|
| Filename | modeM0/AS1A07_144T02_9000003340_22473cztM0_level2.evt | modeM0/AS1A07_144T02_9000003340_22473cztM0_level2_quad_clean.evt |
| Size (bytes) | 1,166,440,320 | 218,753,280 |
| Size | 1.1 GB | 208.6 MB |
| Events in quadrant A | 8,455,899 | 1,359,809 |
| Events in quadrant B | 8,524,017 | 1,393,799 |
| Events in quadrant C | 8,485,586 | 1,335,600 |
| Events in quadrant D | 8,651,517 | 1,304,835 |
| Mode M9 | |||
|---|---|---|---|
| Quadrant | BADHDUFLAG | Total packets | Discarded packets |
| A | 0 | 19 | 0 |
| B | 0 | 19 | 0 |
| C | 0 | 19 | 0 |
| D | 0 | 19 | 0 |
| Mode SS | |||
|---|---|---|---|
| Quadrant | BADHDUFLAG | Total packets | Discarded packets |
| A | 0 | 364 | 0 |
| B | 0 | 364 | 0 |
| C | 0 | 364 | 0 |
| D | 0 | 364 | 0 |
| Mode M0 | |||
|---|---|---|---|
| Quadrant | BADHDUFLAG | Total packets | Discarded packets |
| A | 0 | 36369 | 3 |
| B | 0 | 36723 | 3 |
| C | 0 | 36638 | 3 |
| D | 0 | 38032 | 3 |
| Quadrant | Total seconds | Saturated seconds | Saturation percentage |
|---|---|---|---|
| A | 17860 | 109 | 0.610302% |
| B | 17861 | 150 | 0.839819% |
| C | 17861 | 179 | 1.002184% |
| D | 17860 | 160 | 0.895857% |
Noise dominated data is calculated using 1-second bins in cleaned event files. If a bin has >2000 counts, and if more than 50% of those come from <1% of pixels, then it is considered to be noise-dominated and hence unusable.
| Quadrant | # 1 sec bins | Bins with >0 counts | Bins with >2000 counts | High rate bins dominated by noise | Noise dominated (total time) | Noise dominated (detector-on time) | Marked lightcurve |
|---|---|---|---|---|---|---|---|
| A | 19760 | 17861 | 0 | 0 | 0.00% | 0.00% | 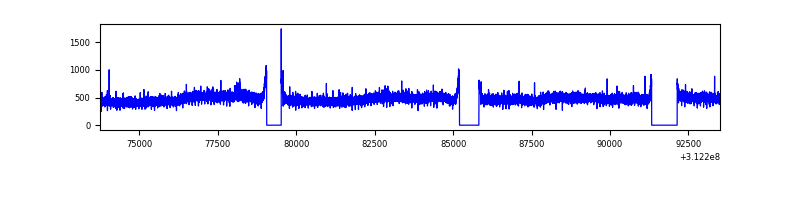 |
| B | 19761 | 17861 | 14 | 14 | 0.07% | 0.08% | 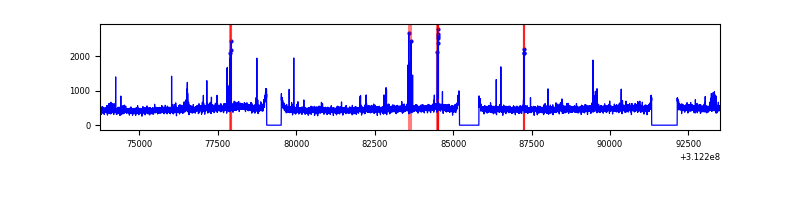 |
| C | 19761 | 17861 | 8 | 8 | 0.04% | 0.04% | 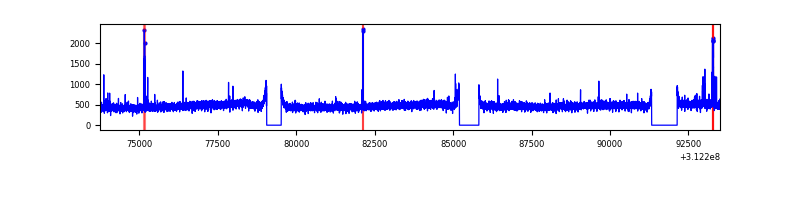 |
| D | 19760 | 17860 | 70 | 70 | 0.35% | 0.39% | 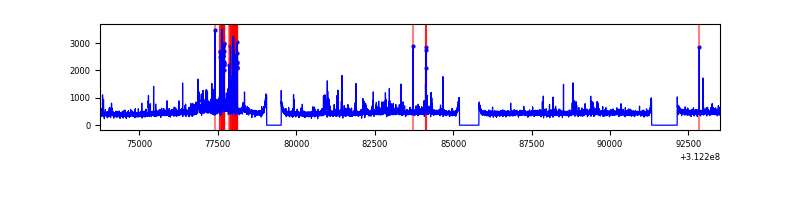 |
Top three noisy pixels from each quadrant. If the there are fewer than three noisy pixels in the level2.evt file, extra rows are filled as -1
| Pixel properties | Quadrant properties | ||||||
|---|---|---|---|---|---|---|---|
| Quadrant | DetID | PixID | Counts | Sigma | Mean | Median | Sigma |
| A | 15 | 174 | 190298 | 438.01 | 2139 | 2089 | 429.7 |
| A | 3 | 1 | 27462 | 59.05 | 2139 | 2089 | 429.7 |
| A | 13 | 254 | 24075 | 51.17 | 2139 | 2089 | 429.7 |
| B | 4 | 52 | 58624 | 137.71 | 2129 | 2072 | 410.7 |
| B | 12 | 111 | 51117 | 119.43 | 2129 | 2072 | 410.7 |
| B | 0 | 190 | 47244 | 110.0 | 2129 | 2072 | 410.7 |
| C | 14 | 238 | 321504 | 660.59 | 2055 | 2065 | 483.6 |
| C | 10 | 22 | 129786 | 264.12 | 2055 | 2065 | 483.6 |
| C | 9 | 54 | 24651 | 46.71 | 2055 | 2065 | 483.6 |
| D | 1 | 52 | 510512 | 992.13 | 2085 | 2021 | 512.5 |
| D | 13 | 172 | 209435 | 404.69 | 2085 | 2021 | 512.5 |
| D | 2 | 234 | 75687 | 143.73 | 2085 | 2021 | 512.5 |
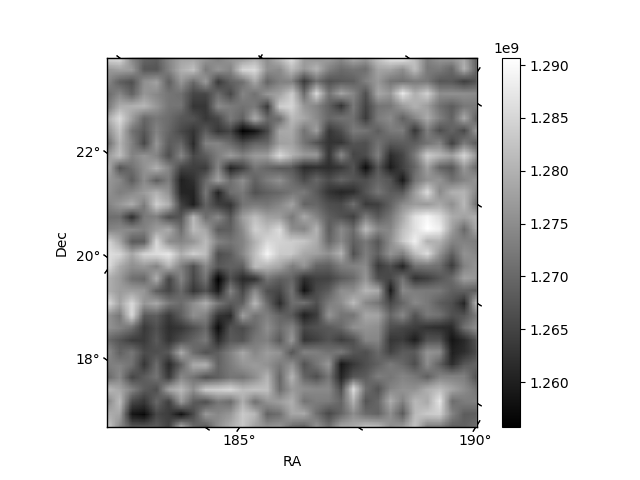
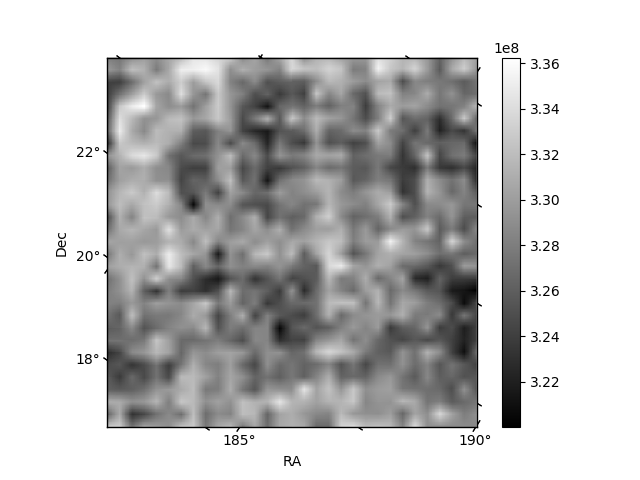
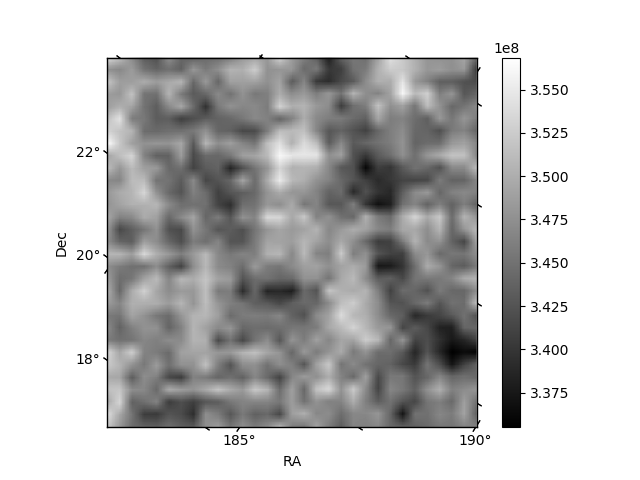
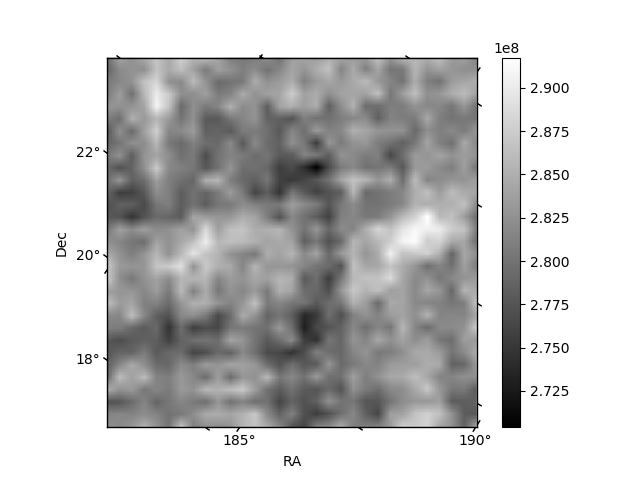
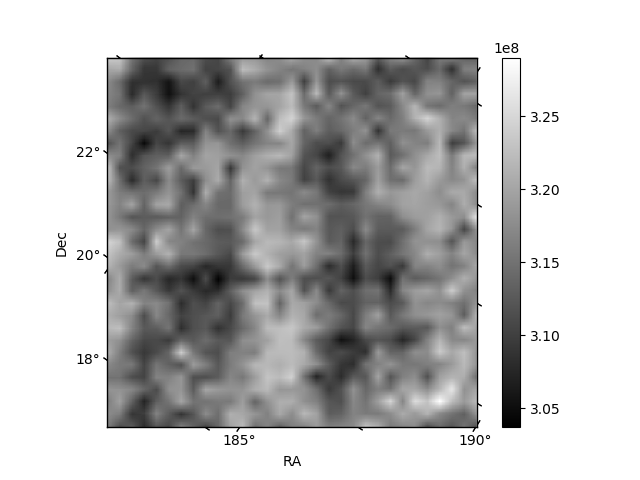
Histogram calculated using DETX and DETY for each event in the final _common_clean file
| Quadrant A | 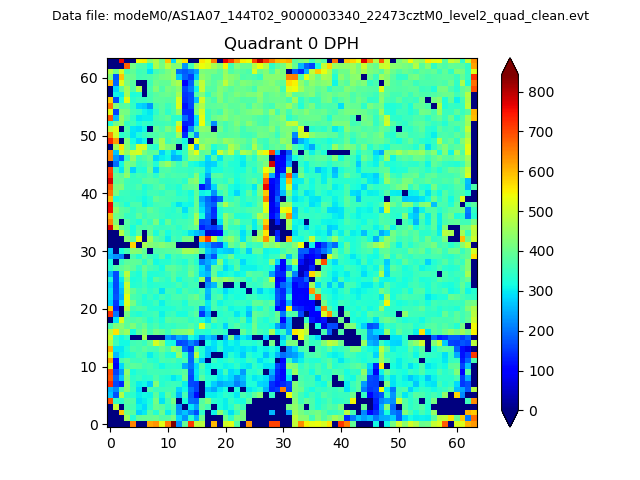 |
 |
Quadrant B |
|---|---|---|---|
| Quadrant D | 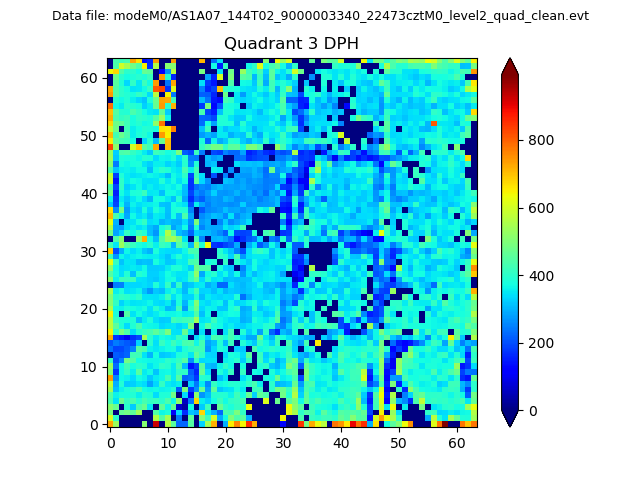 |
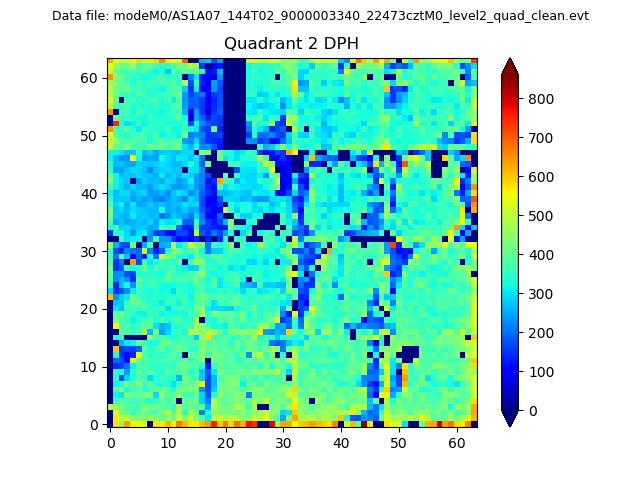 |
Quadrant C |
| Plot type | Count rate plots | Images |
|---|---|---|
| Comparison with Poisson distribution Blue bars denote a histogram of data divided into 1 sec bins. Red curve is a Poisson curve with rate = median count rate of data. |
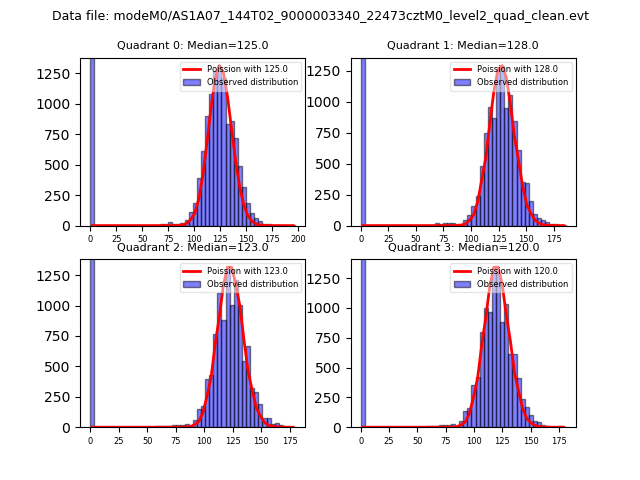 |
 |
| Quadrant-wise count rates Data is divided into 100 sec bins |
 |
|
| Module-wise count rates for Quadrant A Data is divided into 100 sec bins |
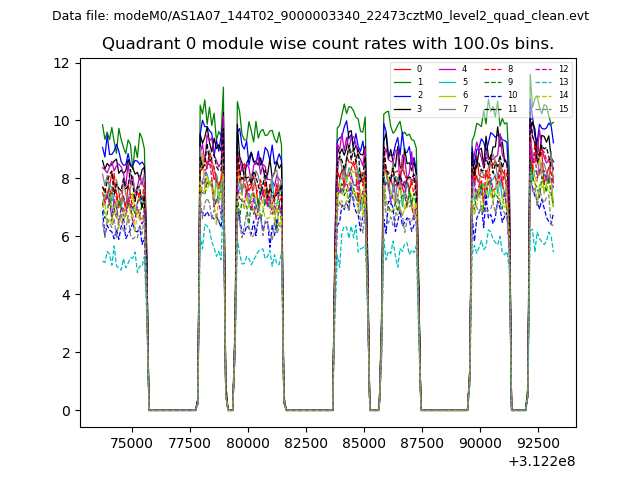 |
 |
| Module-wise count rates for Quadrant B Data is divided into 100 sec bins |
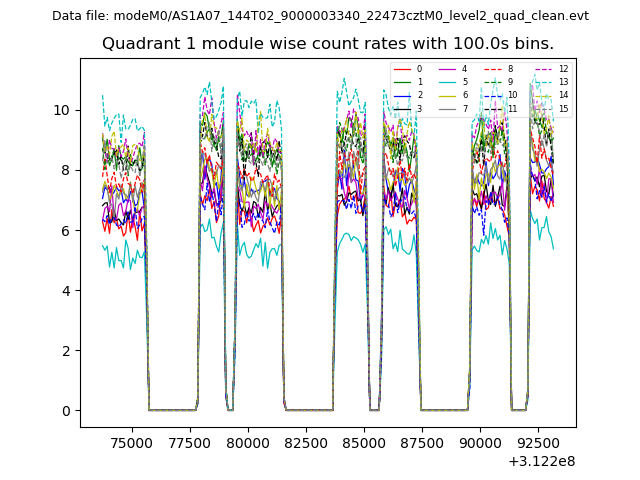 |
 |
| Module-wise count rates for Quadrant C Data is divided into 100 sec bins |
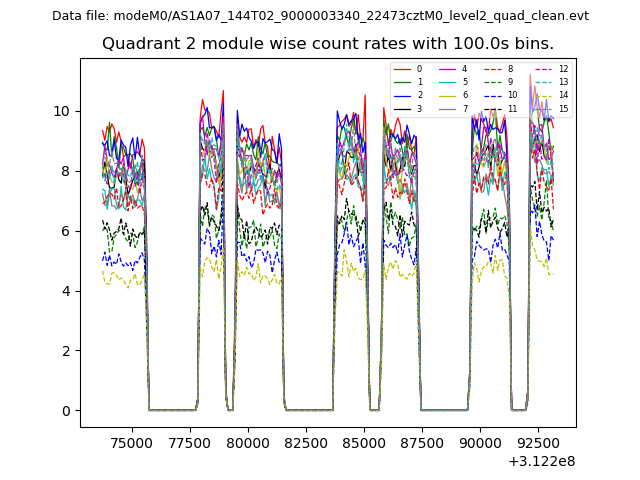 |
 |
| Module-wise count rates for Quadrant D Data is divided into 100 sec bins |
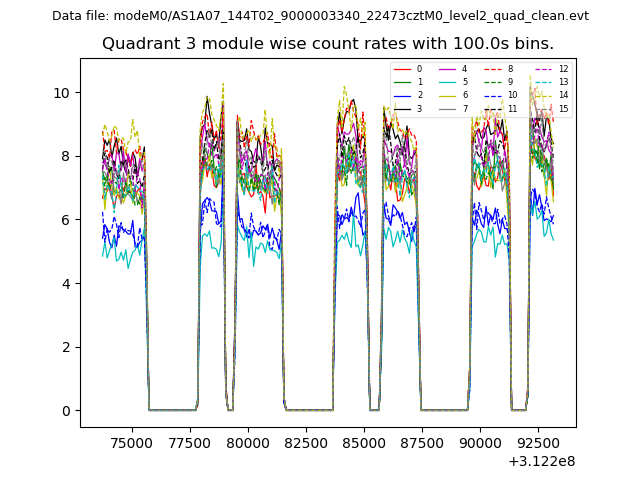 |
 |
| Parameter | Plot |
|---|---|
| CZT HV Monitor | 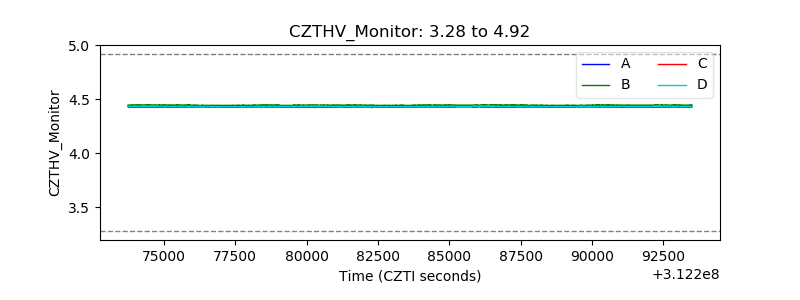 |
| D_VDD | 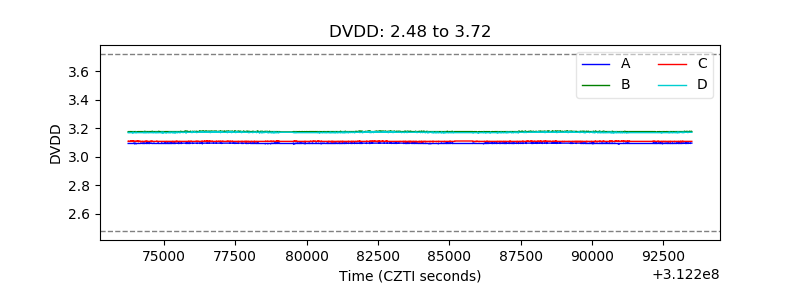 |
| Temperature 1 | 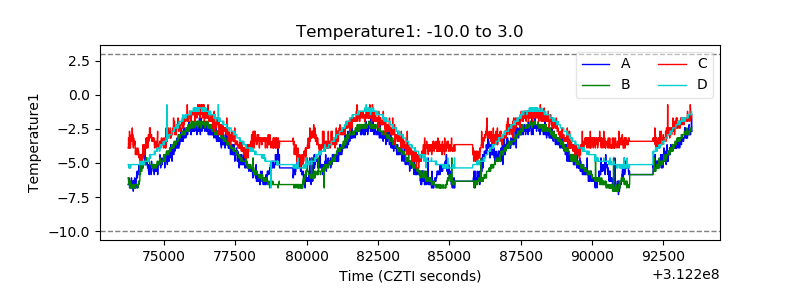 |
| Veto HV Monitor |  |
| Veto LLD | 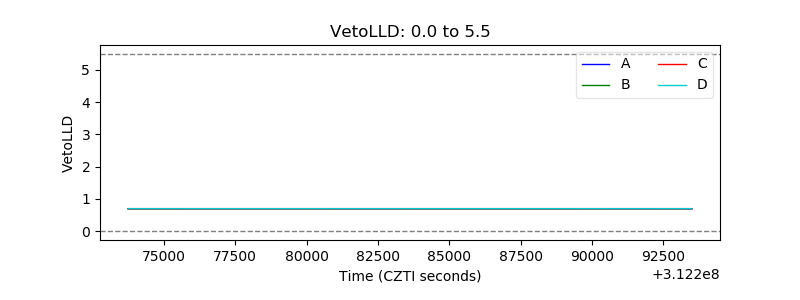 |
| Alpha Counter | 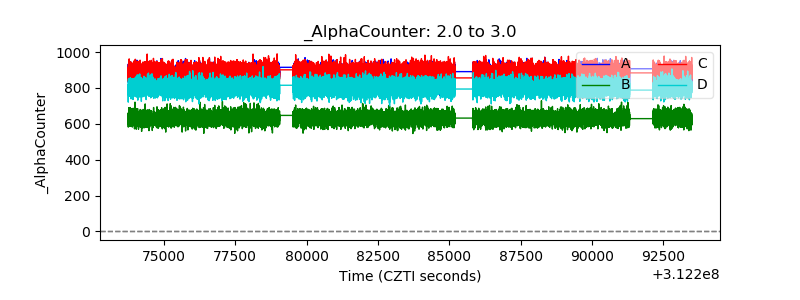 |
| _CPM_Rate | 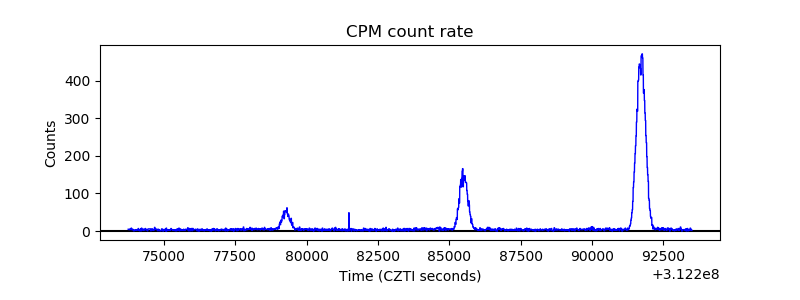 |
| CZT Counter | 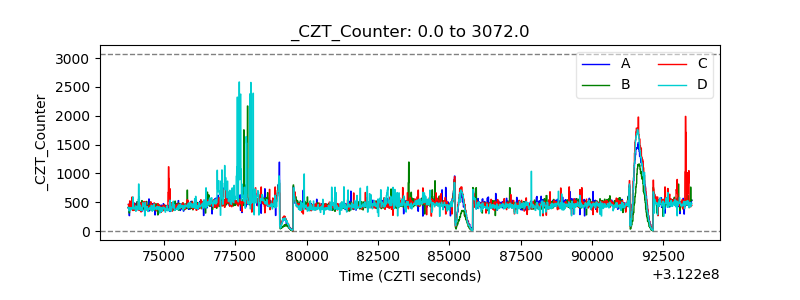 |
| +2.5 Volts monitor |  |
| +5 Volts monitor |  |
| _ROLL_ROT | 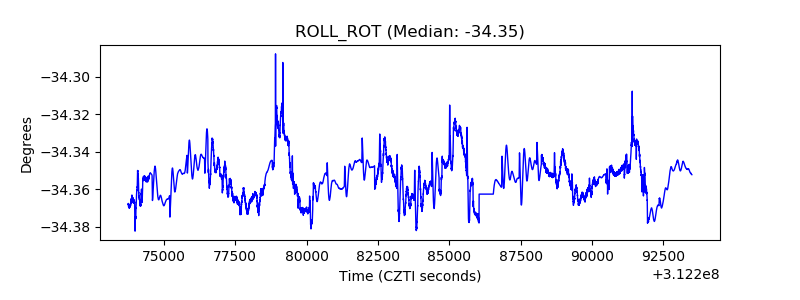 |
| _Roll_DEC | 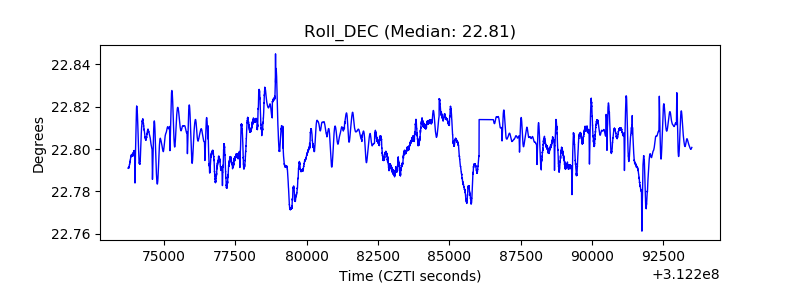 |
| _Roll_RA | 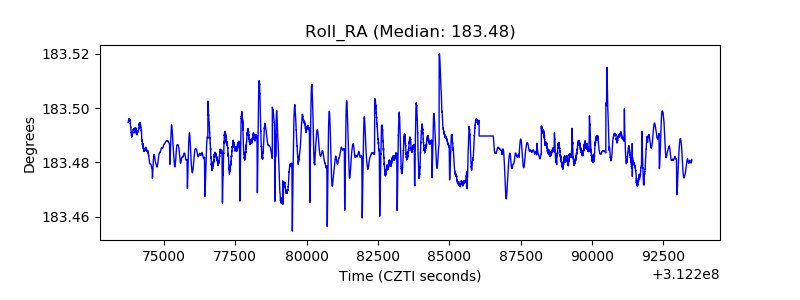 |
| Veto Counter | 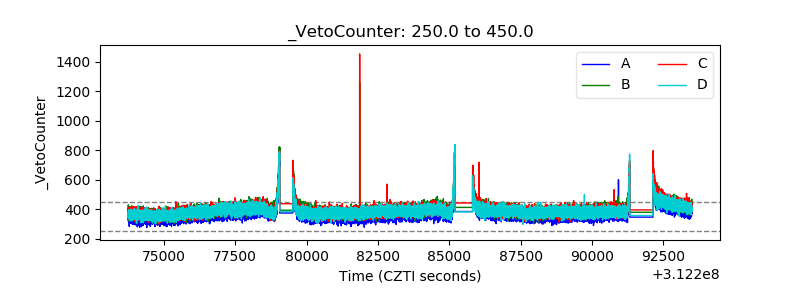 |