| Param | Original file | Final file |
|---|---|---|
| Filename | modeM0/AS1A07_144T02_9000003340_22474cztM0_level2.evt | modeM0/AS1A07_144T02_9000003340_22474cztM0_level2_quad_clean.evt |
| Size (bytes) | 451,494,720 | 73,134,720 |
| Size | 430.6 MB | 69.7 MB |
| Events in quadrant A | 3,032,522 | 448,791 |
| Events in quadrant B | 3,114,893 | 459,696 |
| Events in quadrant C | 3,226,600 | 440,813 |
| Events in quadrant D | 3,871,059 | 425,180 |
| Mode M9 | |||
|---|---|---|---|
| Quadrant | BADHDUFLAG | Total packets | Discarded packets |
| A | 0 | 10 | 0 |
| B | 0 | 10 | 0 |
| C | 0 | 10 | 0 |
| D | 0 | 10 | 0 |
| Mode SS | |||
|---|---|---|---|
| Quadrant | BADHDUFLAG | Total packets | Discarded packets |
| A | 0 | 128 | 0 |
| B | 0 | 128 | 0 |
| C | 0 | 128 | 0 |
| D | 0 | 128 | 0 |
| Mode M0 | |||
|---|---|---|---|
| Quadrant | BADHDUFLAG | Total packets | Discarded packets |
| A | 0 | 12910 | 1 |
| B | 0 | 13078 | 1 |
| C | 0 | 13459 | 1 |
| D | 0 | 15654 | 1 |
| Quadrant | Total seconds | Saturated seconds | Saturation percentage |
|---|---|---|---|
| A | 6304 | 32 | 0.507614% |
| B | 6305 | 41 | 0.650278% |
| C | 6304 | 86 | 1.364213% |
| D | 6304 | 318 | 5.044416% |
Noise dominated data is calculated using 1-second bins in cleaned event files. If a bin has >2000 counts, and if more than 50% of those come from <1% of pixels, then it is considered to be noise-dominated and hence unusable.
| Quadrant | # 1 sec bins | Bins with >0 counts | Bins with >2000 counts | High rate bins dominated by noise | Noise dominated (total time) | Noise dominated (detector-on time) | Marked lightcurve |
|---|---|---|---|---|---|---|---|
| A | 7269 | 6304 | 0 | 0 | 0.00% | 0.00% |  |
| B | 7270 | 6305 | 1 | 1 | 0.01% | 0.02% |  |
| C | 7269 | 6304 | 17 | 17 | 0.23% | 0.27% |  |
| D | 7269 | 6304 | 276 | 276 | 3.80% | 4.38% | 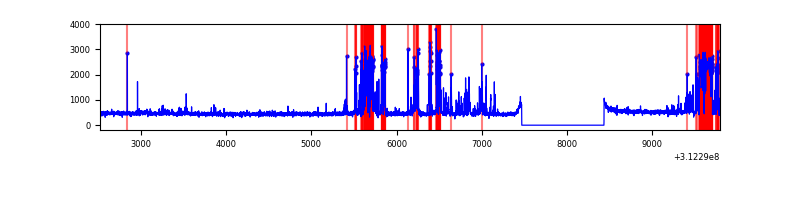 |
Top three noisy pixels from each quadrant. If the there are fewer than three noisy pixels in the level2.evt file, extra rows are filled as -1
| Pixel properties | Quadrant properties | ||||||
|---|---|---|---|---|---|---|---|
| Quadrant | DetID | PixID | Counts | Sigma | Mean | Median | Sigma |
| A | 13 | 254 | 8987 | 51.86 | 783 | 765 | 158.5 |
| A | 2 | 79 | 8478 | 48.65 | 783 | 765 | 158.5 |
| A | 0 | 226 | 6793 | 38.02 | 783 | 765 | 158.5 |
| B | 0 | 190 | 37262 | 242.12 | 777 | 757 | 150.8 |
| B | 0 | 245 | 24097 | 154.8 | 777 | 757 | 150.8 |
| B | 12 | 111 | 18260 | 116.09 | 777 | 757 | 150.8 |
| C | 10 | 22 | 172189 | 966.15 | 752 | 758 | 177.4 |
| C | 14 | 238 | 117840 | 659.85 | 752 | 758 | 177.4 |
| C | 13 | 61 | 5260 | 25.37 | 752 | 758 | 177.4 |
| D | 2 | 136 | 969439 | 5292.54 | 750 | 729 | 183.0 |
| D | 1 | 52 | 39681 | 212.81 | 750 | 729 | 183.0 |
| D | 2 | 234 | 25704 | 136.45 | 750 | 729 | 183.0 |
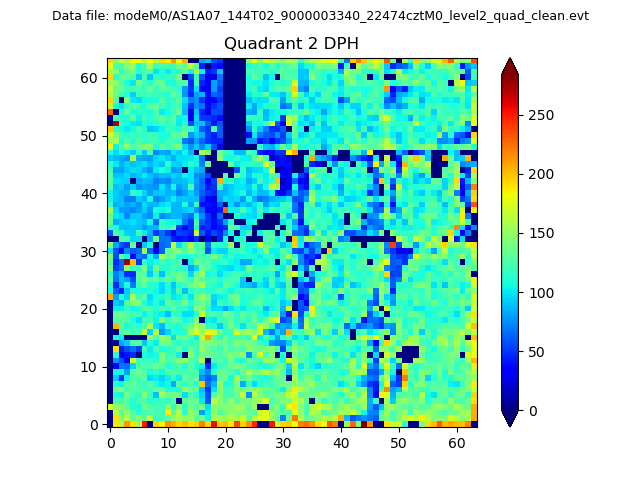
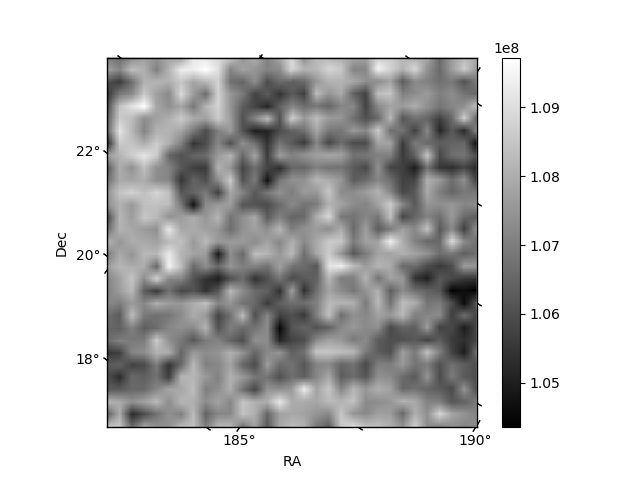
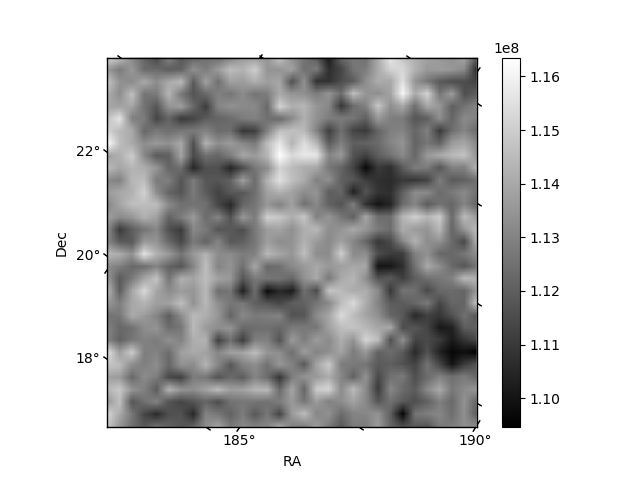
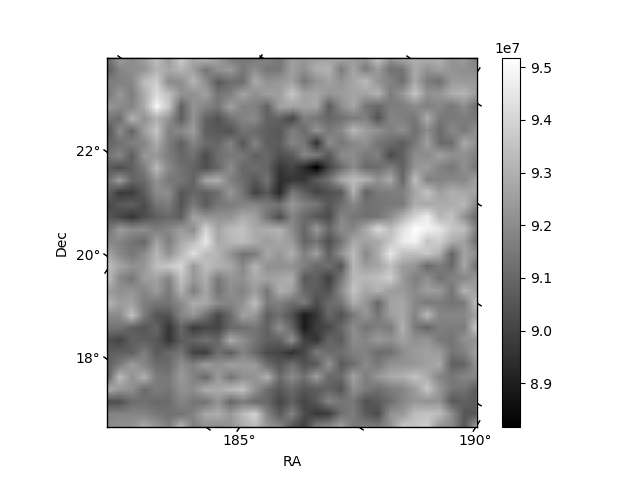
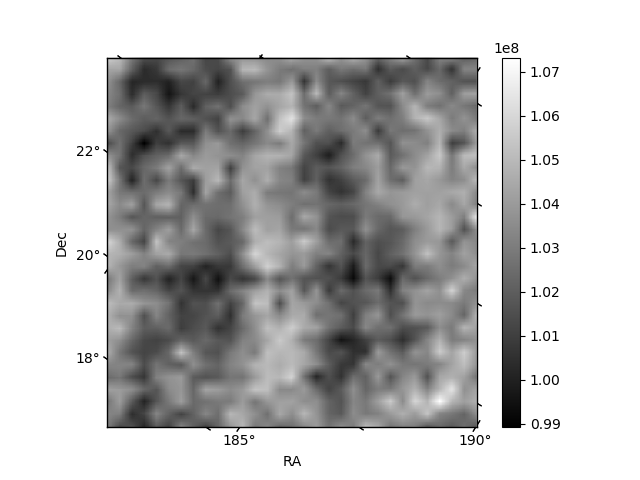
Histogram calculated using DETX and DETY for each event in the final _common_clean file
| Quadrant A | 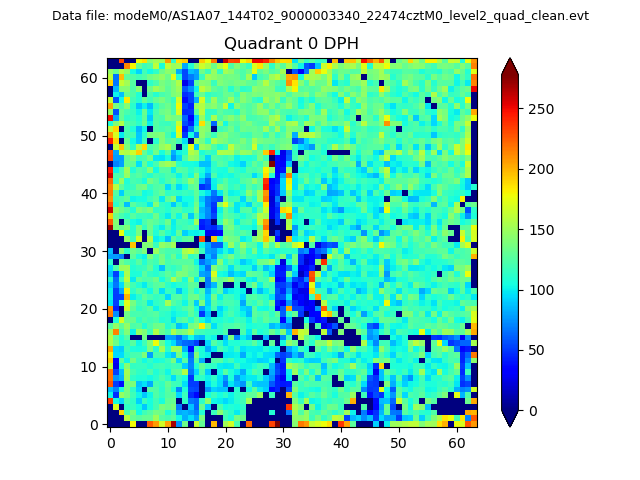 |
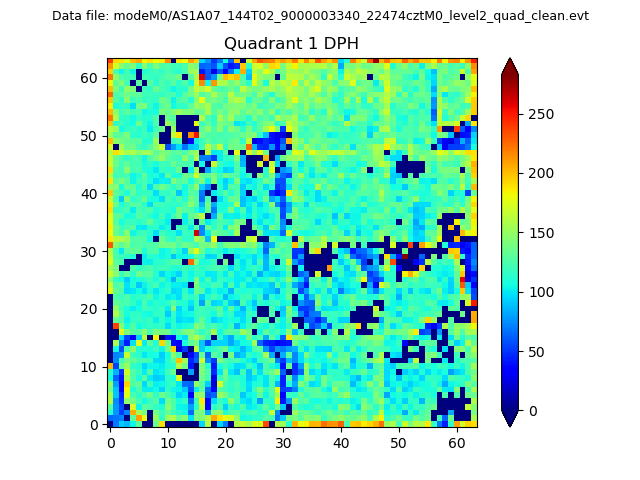 |
Quadrant B |
|---|---|---|---|
| Quadrant D | 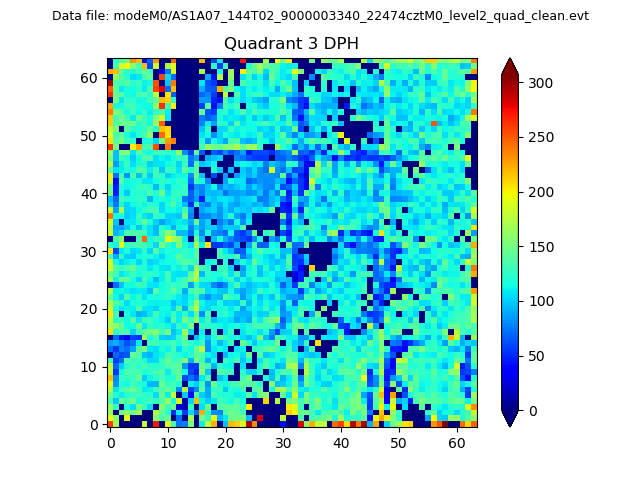 |
 |
Quadrant C |
| Plot type | Count rate plots | Images |
|---|---|---|
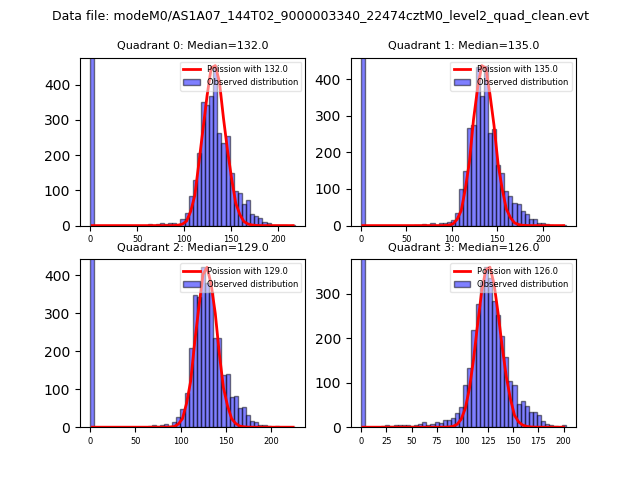
| Comparison with Poisson distribution Blue bars denote a histogram of data divided into 1 sec bins. Red curve is a Poisson curve with rate = median count rate of data. |
 |
 |
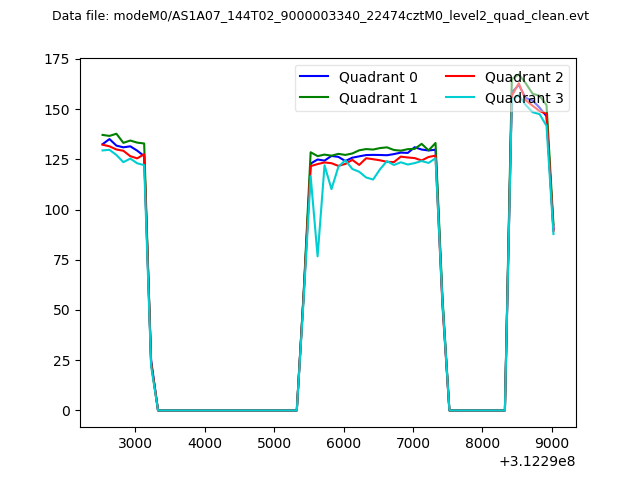
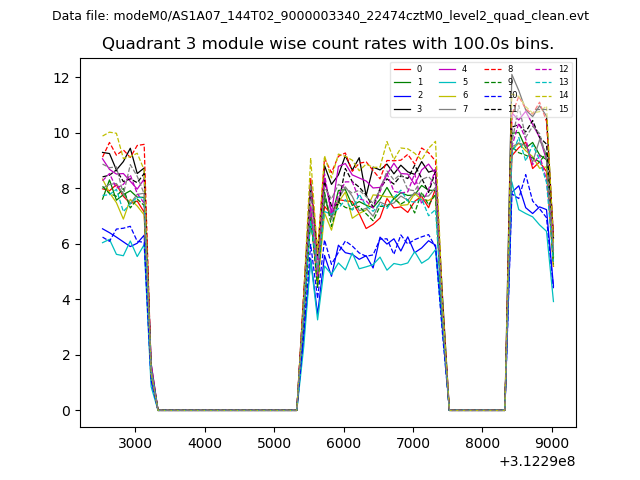
| Quadrant-wise count rates Data is divided into 100 sec bins |
 |
|
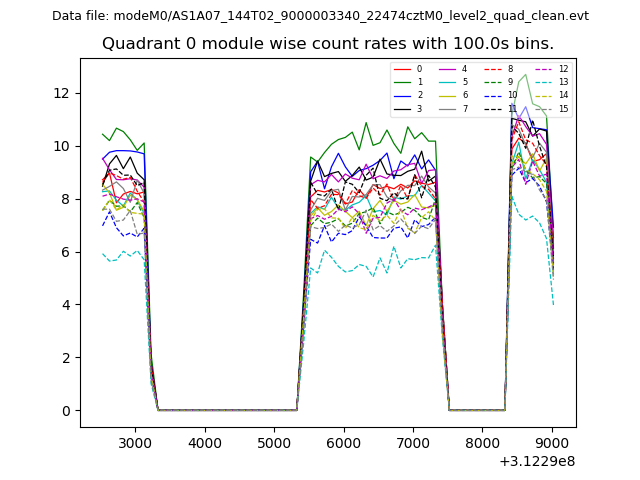
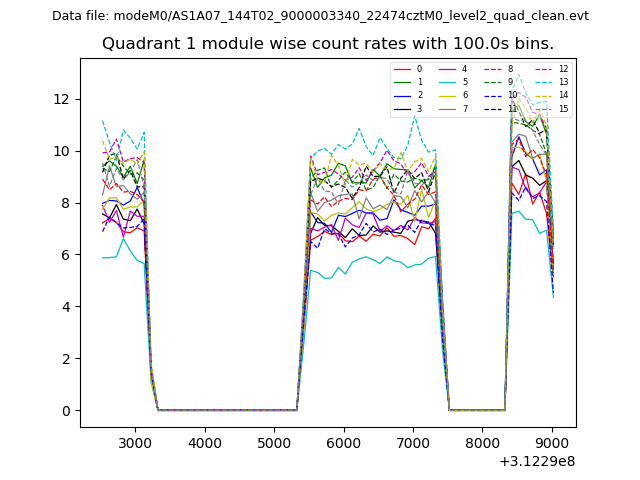
| Module-wise count rates for Quadrant A Data is divided into 100 sec bins |
 |
 |
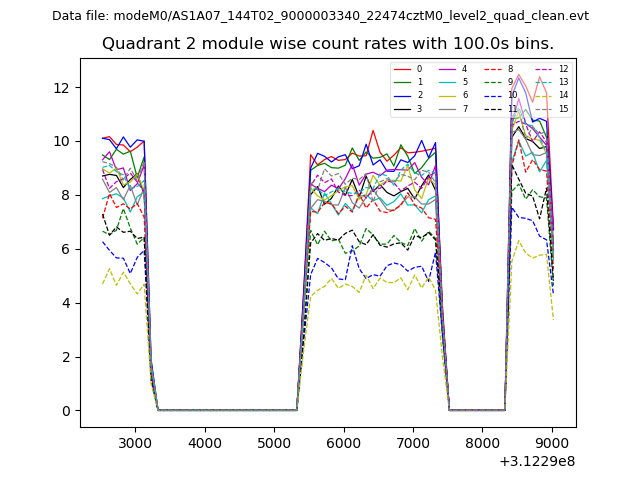
| Module-wise count rates for Quadrant B Data is divided into 100 sec bins |
 |
 |
| Module-wise count rates for Quadrant C Data is divided into 100 sec bins |
 |
 |
| Module-wise count rates for Quadrant D Data is divided into 100 sec bins |
 |
 |
| Parameter | Plot |
|---|---|
| CZT HV Monitor | 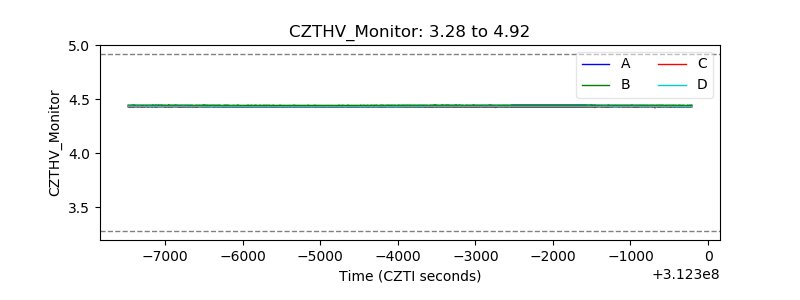 |
| D_VDD | 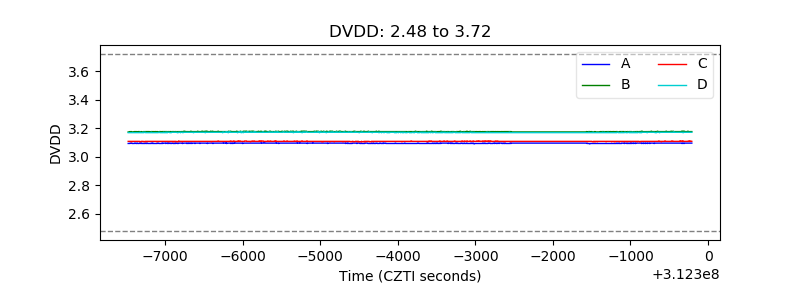 |
| Temperature 1 | 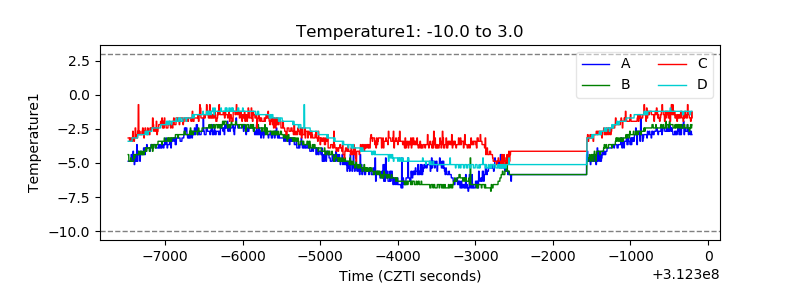 |
| Veto HV Monitor | 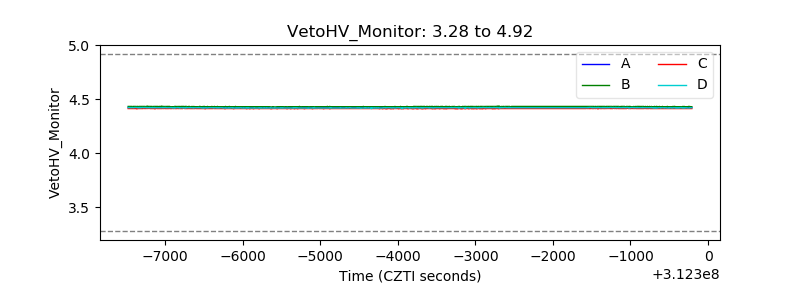 |
| Veto LLD | 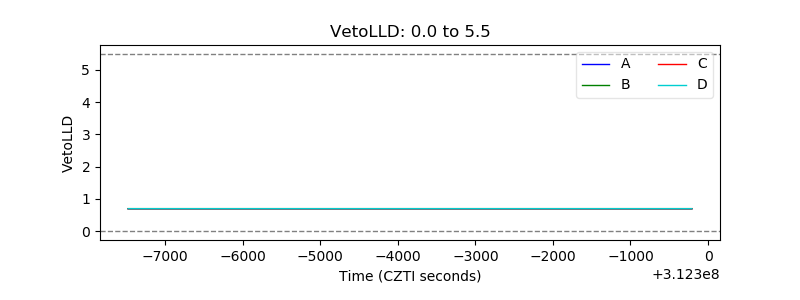 |
| Alpha Counter | 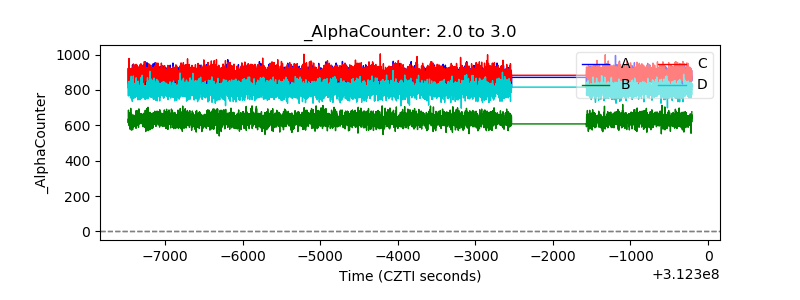 |
| _CPM_Rate | 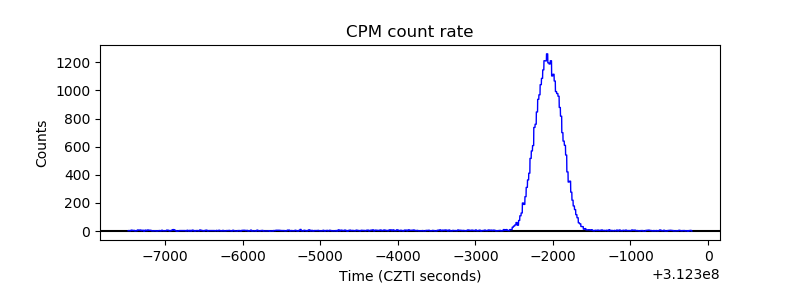 |
| CZT Counter | 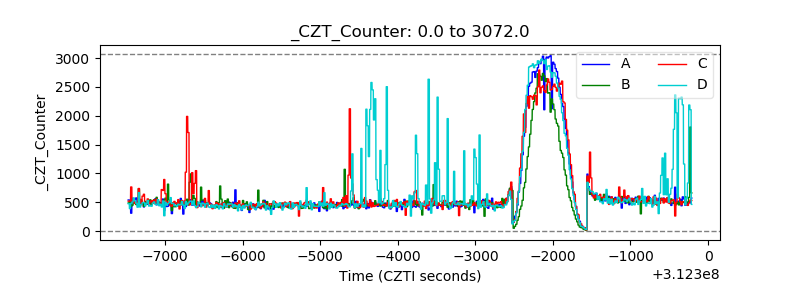 |
| +2.5 Volts monitor |  |
| +5 Volts monitor | 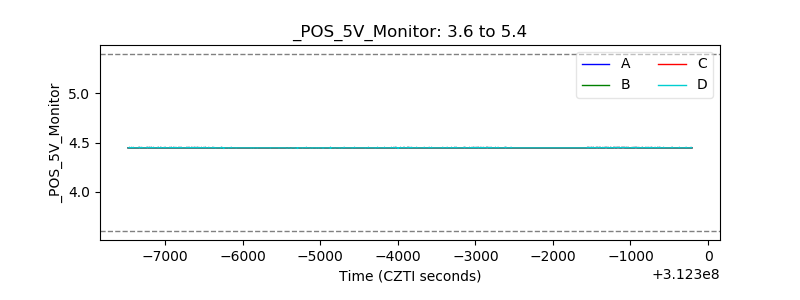 |
| _ROLL_ROT | 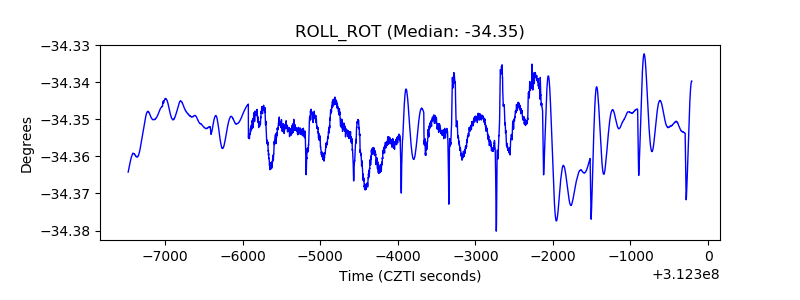 |
| _Roll_DEC | 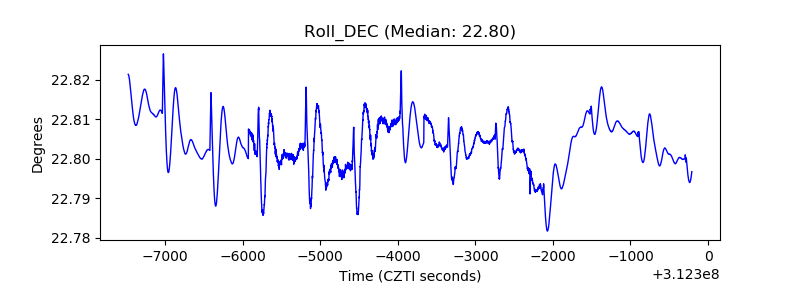 |
| _Roll_RA |  |
| Veto Counter | 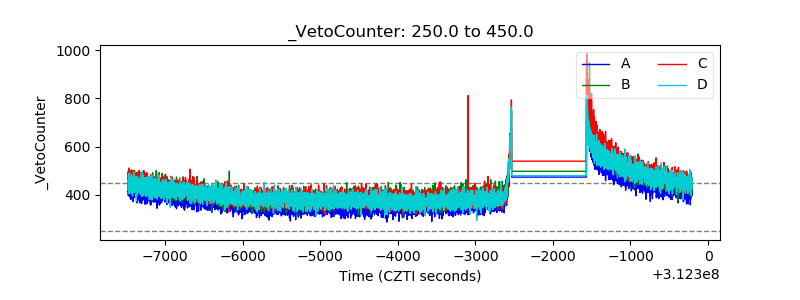 |