| Param | Original file | Final file |
|---|---|---|
| Filename | modeM0/AS1A07_144T02_9000003340_22477cztM0_level2.evt | modeM0/AS1A07_144T02_9000003340_22477cztM0_level2_quad_clean.evt |
| Size (bytes) | 490,746,240 | 66,936,960 |
| Size | 468.0 MB | 63.8 MB |
| Events in quadrant A | 3,464,531 | 395,240 |
| Events in quadrant B | 3,595,699 | 402,564 |
| Events in quadrant C | 3,557,759 | 390,679 |
| Events in quadrant D | 3,801,134 | 382,722 |
| Mode M9 | |||
|---|---|---|---|
| Quadrant | BADHDUFLAG | Total packets | Discarded packets |
| A | 0 | 16 | 0 |
| B | 0 | 17 | 0 |
| C | 0 | 17 | 0 |
| D | 0 | 17 | 0 |
| Mode SS | |||
|---|---|---|---|
| Quadrant | BADHDUFLAG | Total packets | Discarded packets |
| A | 0 | 134 | 0 |
| B | 0 | 134 | 0 |
| C | 0 | 134 | 0 |
| D | 0 | 134 | 0 |
| Mode M0 | |||
|---|---|---|---|
| Quadrant | BADHDUFLAG | Total packets | Discarded packets |
| A | 0 | 14511 | 2 |
| B | 0 | 14995 | 2 |
| C | 0 | 14787 | 2 |
| D | 0 | 15799 | 2 |
| Quadrant | Total seconds | Saturated seconds | Saturation percentage |
|---|---|---|---|
| A | 6526 | 89 | 1.363776% |
| B | 6526 | 103 | 1.578302% |
| C | 6525 | 152 | 2.329502% |
| D | 6525 | 143 | 2.191571% |
Noise dominated data is calculated using 1-second bins in cleaned event files. If a bin has >2000 counts, and if more than 50% of those come from <1% of pixels, then it is considered to be noise-dominated and hence unusable.
| Quadrant | # 1 sec bins | Bins with >0 counts | Bins with >2000 counts | High rate bins dominated by noise | Noise dominated (total time) | Noise dominated (detector-on time) | Marked lightcurve |
|---|---|---|---|---|---|---|---|
| A | 7706 | 6526 | 0 | 0 | 0.00% | 0.00% | 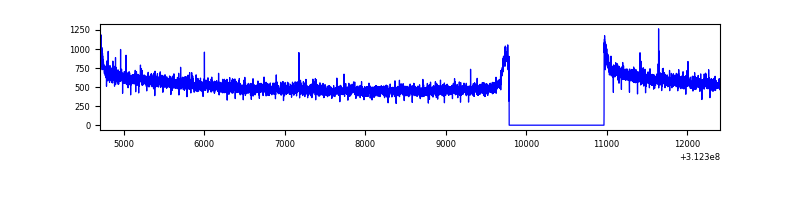 |
| B | 7706 | 6526 | 1 | 1 | 0.01% | 0.02% | 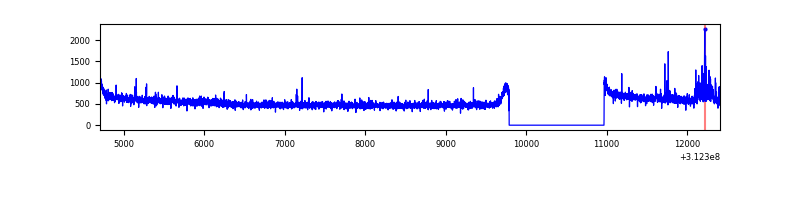 |
| C | 7705 | 6525 | 0 | 0 | 0.00% | 0.00% | 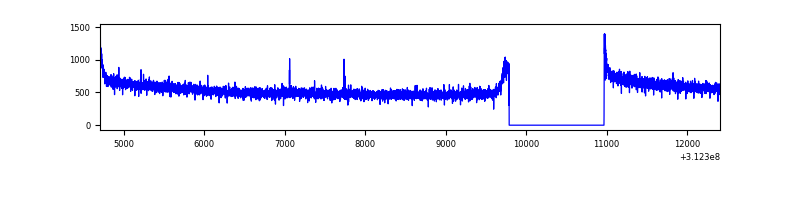 |
| D | 7705 | 6525 | 59 | 59 | 0.77% | 0.90% | 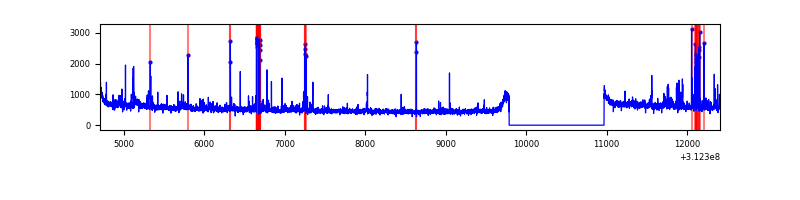 |
Top three noisy pixels from each quadrant. If the there are fewer than three noisy pixels in the level2.evt file, extra rows are filled as -1
| Pixel properties | Quadrant properties | ||||||
|---|---|---|---|---|---|---|---|
| Quadrant | DetID | PixID | Counts | Sigma | Mean | Median | Sigma |
| A | 13 | 254 | 10715 | 54.98 | 898 | 879 | 178.9 |
| A | 0 | 226 | 7770 | 38.52 | 898 | 879 | 178.9 |
| A | 3 | 137 | 7186 | 35.25 | 898 | 879 | 178.9 |
| B | 15 | 33 | 77488 | 456.72 | 891 | 873 | 167.7 |
| B | 12 | 111 | 19403 | 110.46 | 891 | 873 | 167.7 |
| B | 11 | 111 | 17415 | 98.61 | 891 | 873 | 167.7 |
| C | 14 | 238 | 138936 | 682.26 | 874 | 884 | 202.3 |
| C | 0 | 10 | 10381 | 46.93 | 874 | 884 | 202.3 |
| C | 13 | 61 | 6295 | 26.74 | 874 | 884 | 202.3 |
| D | 1 | 52 | 287278 | 1320.83 | 885 | 860 | 216.8 |
| D | 2 | 136 | 120162 | 550.17 | 885 | 860 | 216.8 |
| D | 2 | 234 | 28619 | 128.01 | 885 | 860 | 216.8 |
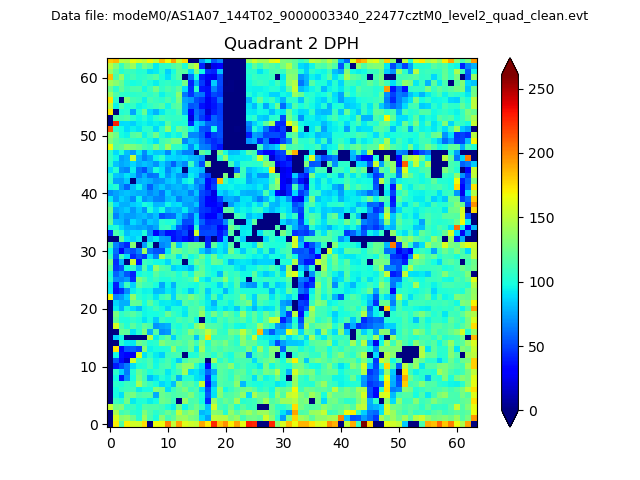
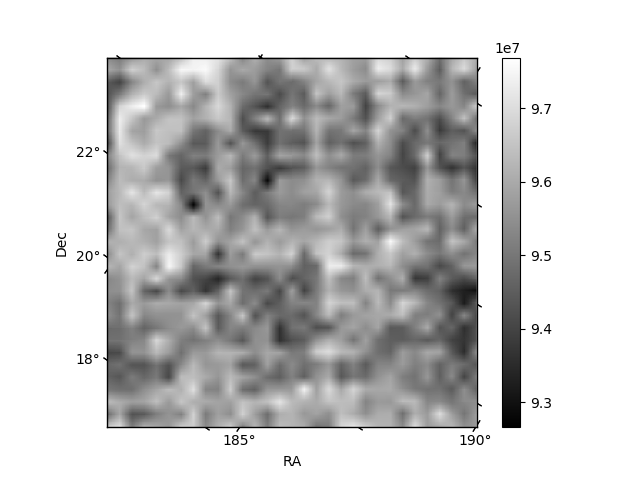
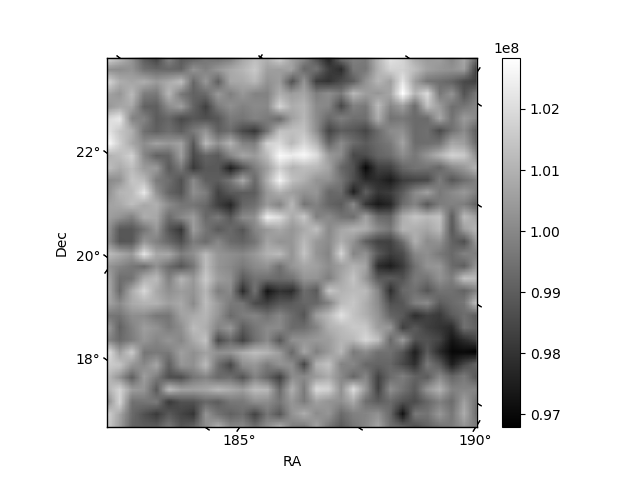
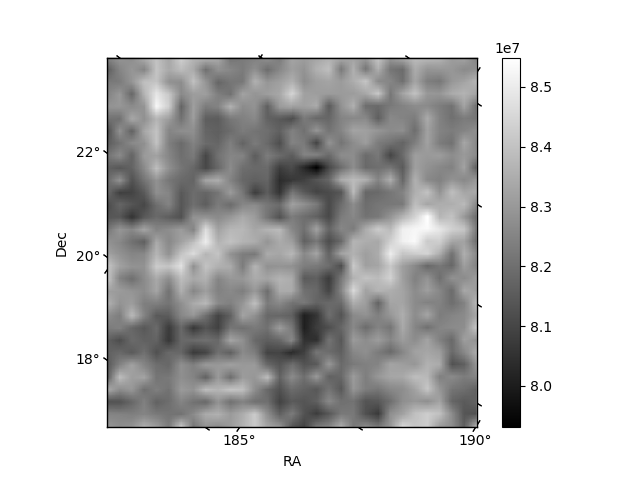
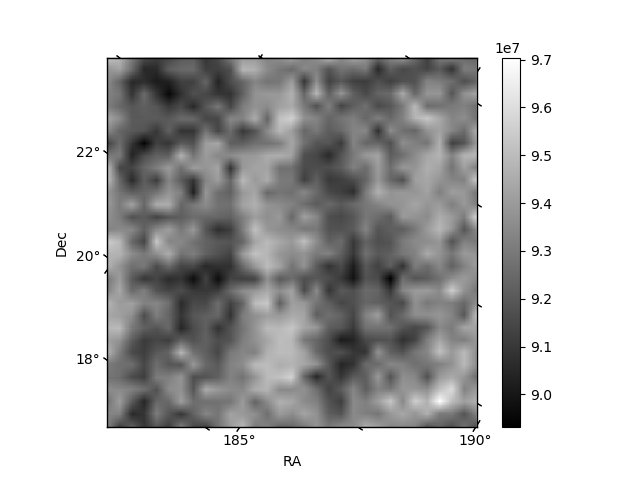
Histogram calculated using DETX and DETY for each event in the final _common_clean file
| Quadrant A | 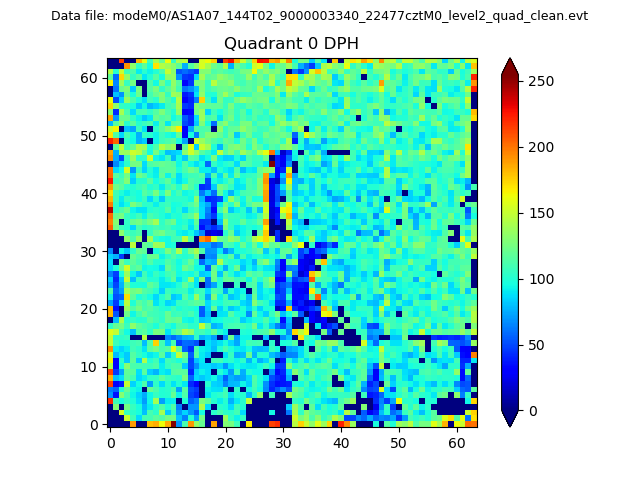 |
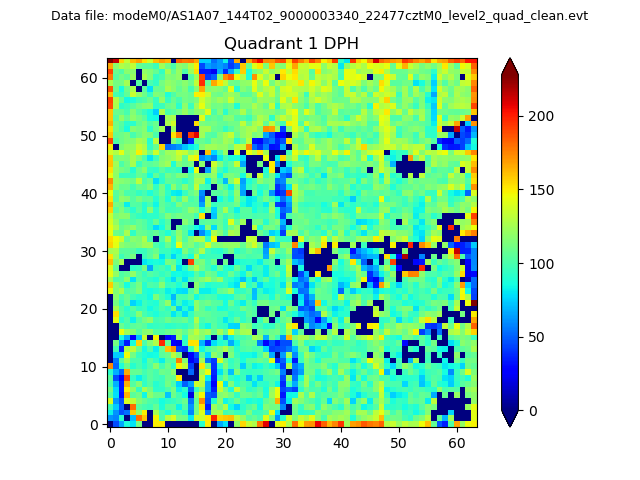 |
Quadrant B |
|---|---|---|---|
| Quadrant D | 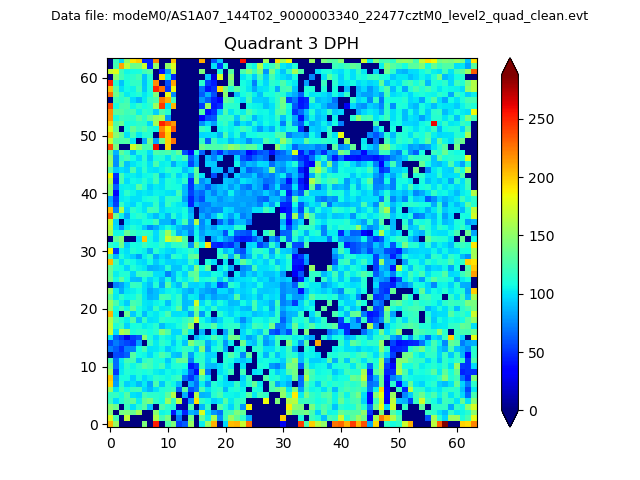 |
 |
Quadrant C |
| Plot type | Count rate plots | Images |
|---|---|---|
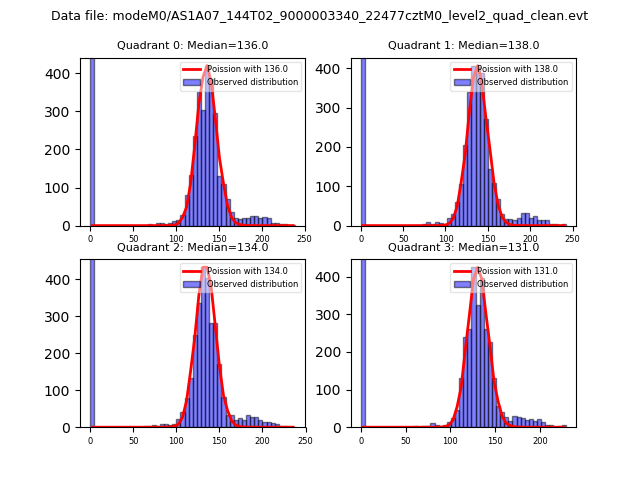
| Comparison with Poisson distribution Blue bars denote a histogram of data divided into 1 sec bins. Red curve is a Poisson curve with rate = median count rate of data. |
 |
 |
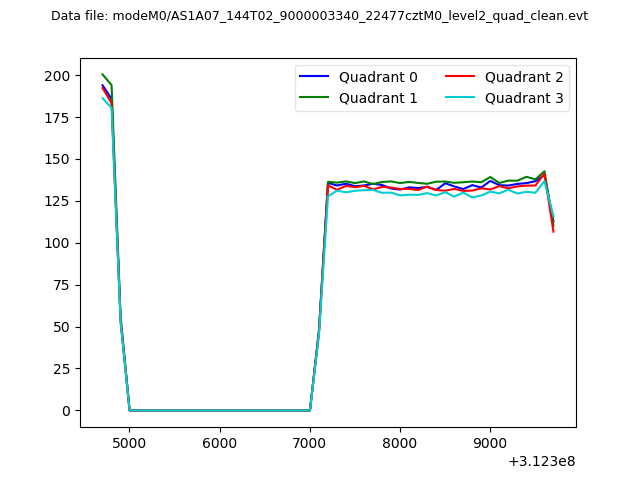
| Quadrant-wise count rates Data is divided into 100 sec bins |
 |
|
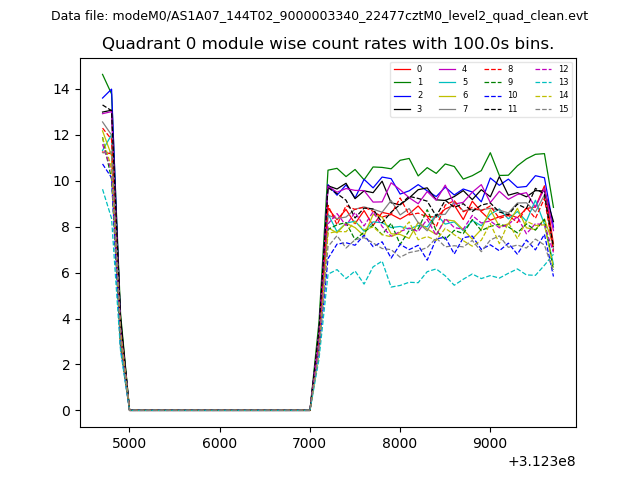
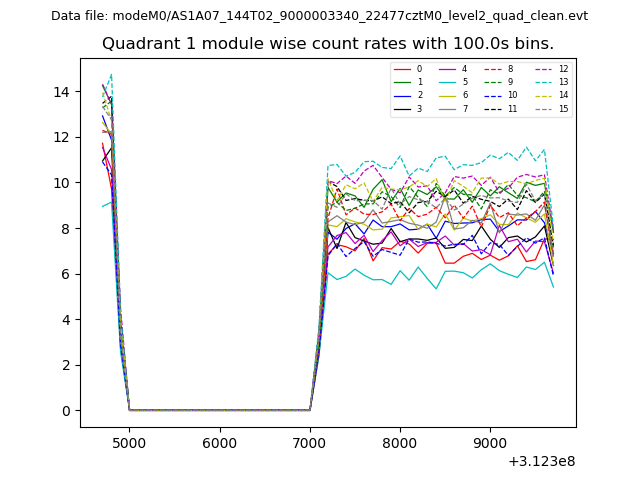
| Module-wise count rates for Quadrant A Data is divided into 100 sec bins |
 |
 |
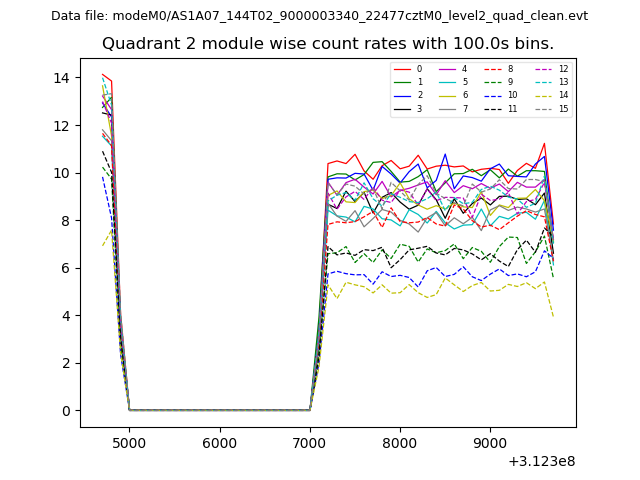
| Module-wise count rates for Quadrant B Data is divided into 100 sec bins |
 |
 |
| Module-wise count rates for Quadrant C Data is divided into 100 sec bins |
 |
 |
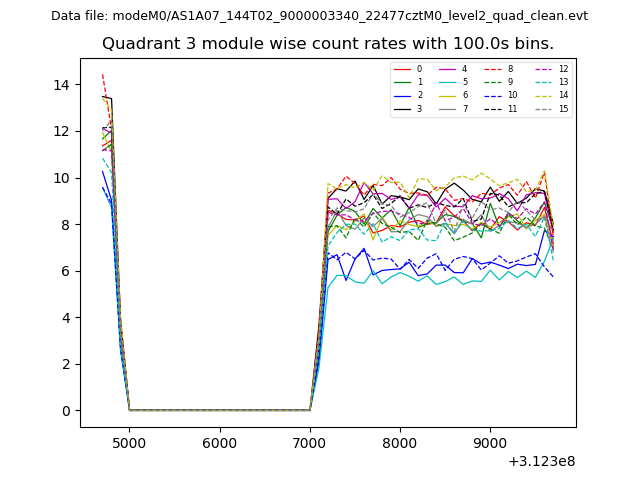
| Module-wise count rates for Quadrant D Data is divided into 100 sec bins |
 |
 |
| Parameter | Plot |
|---|---|
| CZT HV Monitor | 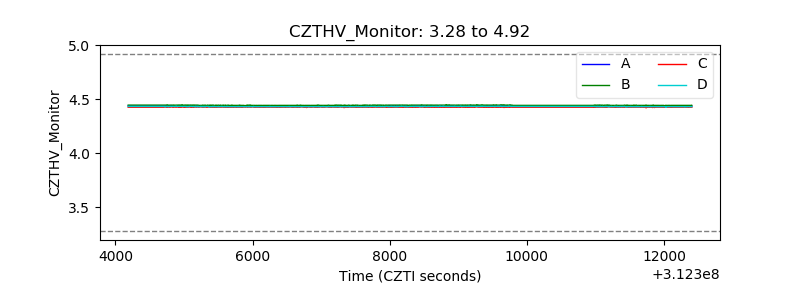 |
| D_VDD | 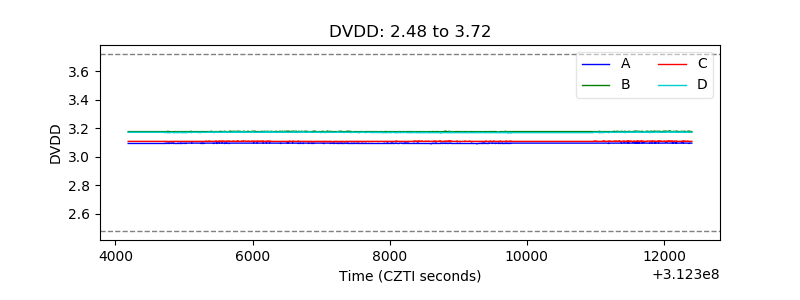 |
| Temperature 1 | 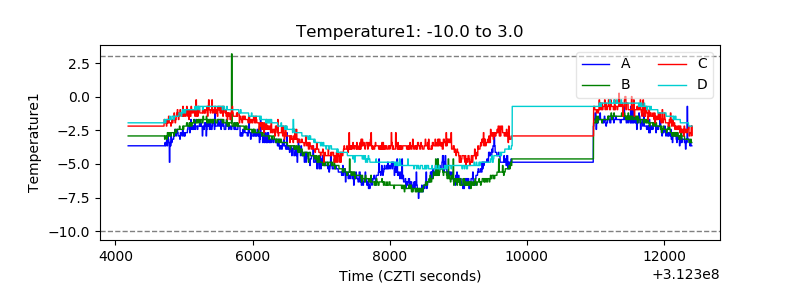 |
| Veto HV Monitor | 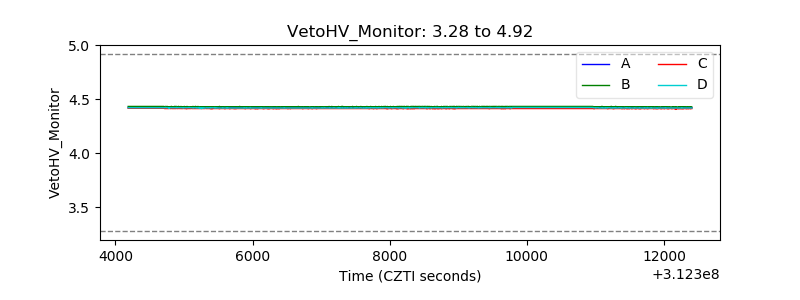 |
| Veto LLD | 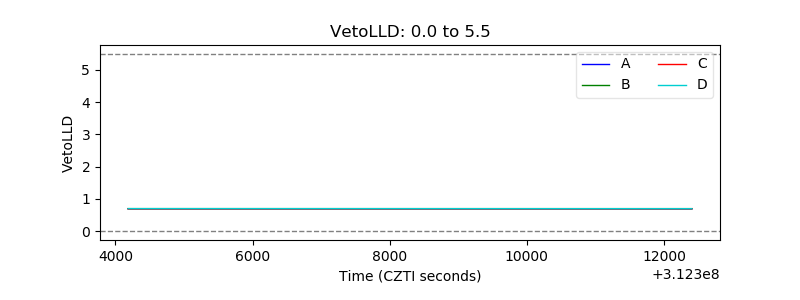 |
| Alpha Counter | 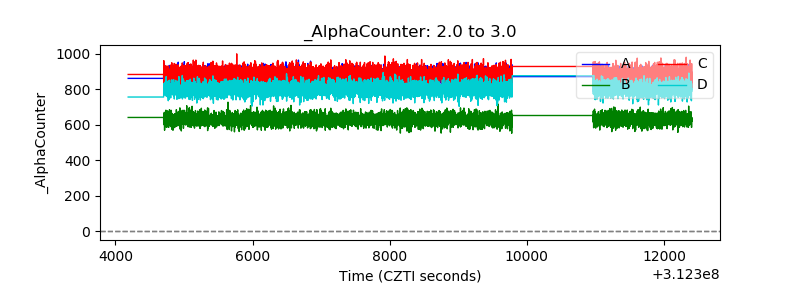 |
| _CPM_Rate | 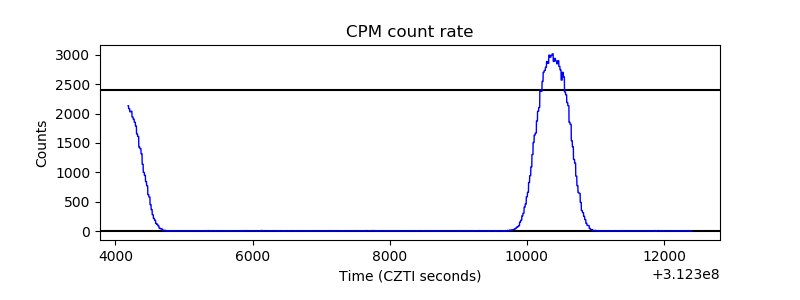 |
| CZT Counter | 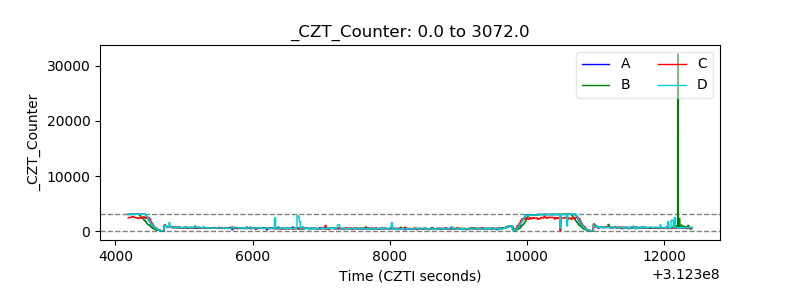 |
| +2.5 Volts monitor |  |
| +5 Volts monitor |  |
| _ROLL_ROT | 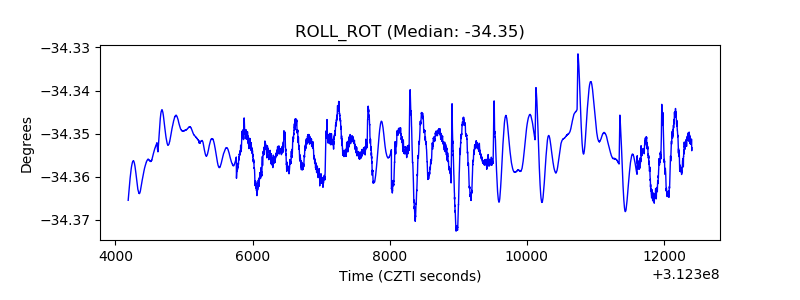 |
| _Roll_DEC | 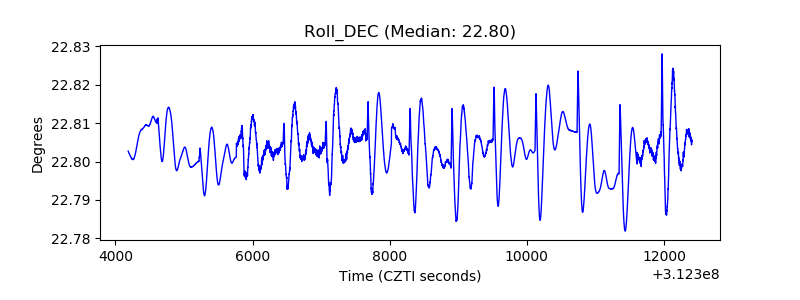 |
| _Roll_RA | 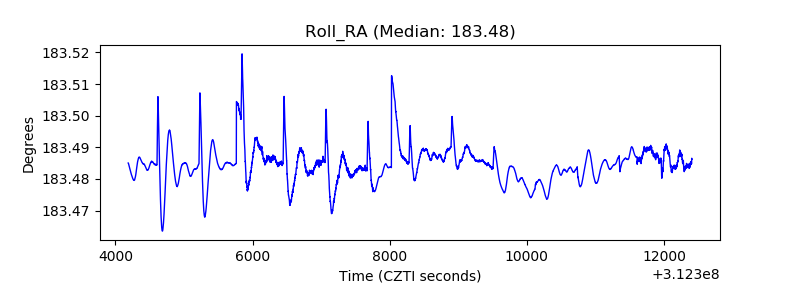 |
| Veto Counter | 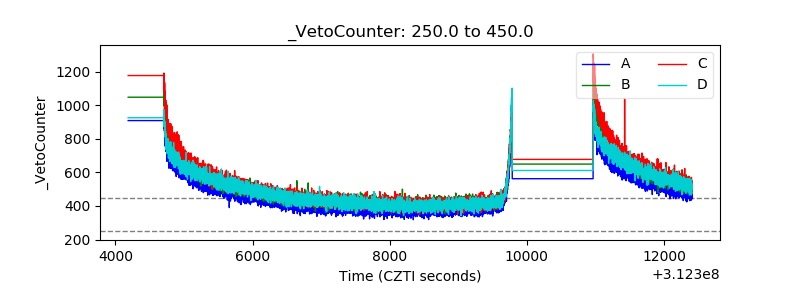 |