| Param | Original file | Final file |
|---|---|---|
| Filename | modeM0/AS1A07_144T02_9000003340_22478cztM0_level2.evt | modeM0/AS1A07_144T02_9000003340_22478cztM0_level2_quad_clean.evt |
| Size (bytes) | 467,421,120 | 68,575,680 |
| Size | 445.8 MB | 65.4 MB |
| Events in quadrant A | 3,391,433 | 411,863 |
| Events in quadrant B | 3,566,745 | 419,640 |
| Events in quadrant C | 2,893,431 | 408,138 |
| Events in quadrant D | 3,878,903 | 400,560 |
| Mode M9 | |||
|---|---|---|---|
| Quadrant | BADHDUFLAG | Total packets | Discarded packets |
| A | 0 | 16 | 0 |
| B | 0 | 17 | 0 |
| C | 0 | 17 | 0 |
| D | 0 | 17 | 0 |
| Mode SS | |||
|---|---|---|---|
| Quadrant | BADHDUFLAG | Total packets | Discarded packets |
| A | 0 | 128 | 0 |
| B | 0 | 128 | 0 |
| C | 0 | 128 | 0 |
| D | 0 | 128 | 0 |
| Mode M0 | |||
|---|---|---|---|
| Quadrant | BADHDUFLAG | Total packets | Discarded packets |
| A | 0 | 14161 | 2 |
| B | 0 | 14765 | 2 |
| C | 0 | 12478 | 2 |
| D | 0 | 15908 | 2 |
| Quadrant | Total seconds | Saturated seconds | Saturation percentage |
|---|---|---|---|
| A | 6244 | 79 | 1.265215% |
| B | 6244 | 94 | 1.505445% |
| C | 6244 | 1377 | 22.053171% |
| D | 6244 | 143 | 2.290199% |
Noise dominated data is calculated using 1-second bins in cleaned event files. If a bin has >2000 counts, and if more than 50% of those come from <1% of pixels, then it is considered to be noise-dominated and hence unusable.
| Quadrant | # 1 sec bins | Bins with >0 counts | Bins with >2000 counts | High rate bins dominated by noise | Noise dominated (total time) | Noise dominated (detector-on time) | Marked lightcurve |
|---|---|---|---|---|---|---|---|
| A | 7534 | 6244 | 0 | 0 | 0.00% | 0.00% | 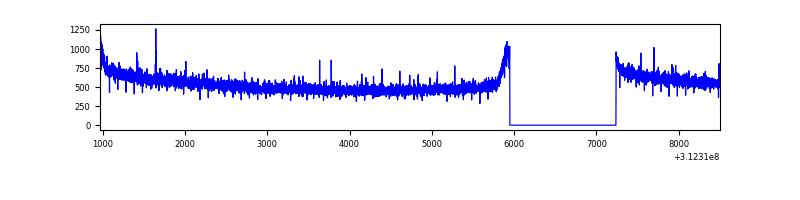 |
| B | 7534 | 6244 | 2 | 2 | 0.03% | 0.03% | 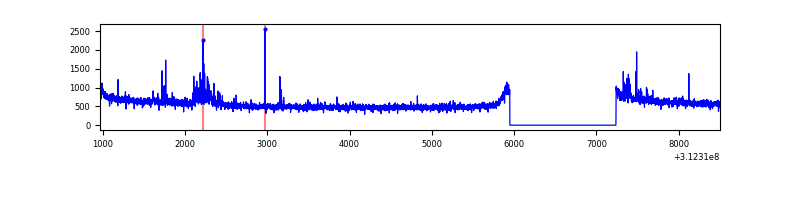 |
| C | 7533 | 6243 | 0 | 0 | 0.00% | 0.00% | 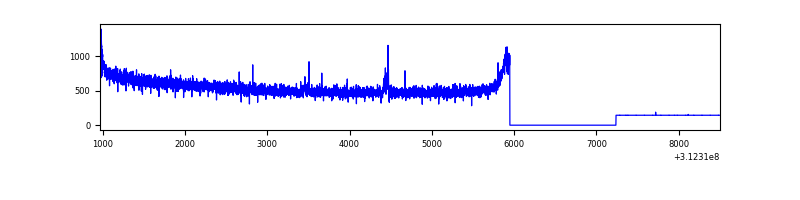 |
| D | 7534 | 6244 | 63 | 63 | 0.84% | 1.01% | 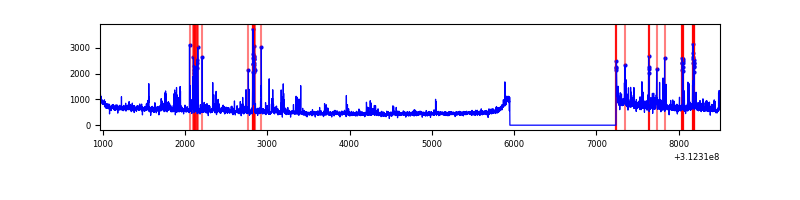 |
Top three noisy pixels from each quadrant. If the there are fewer than three noisy pixels in the level2.evt file, extra rows are filled as -1
| Pixel properties | Quadrant properties | ||||||
|---|---|---|---|---|---|---|---|
| Quadrant | DetID | PixID | Counts | Sigma | Mean | Median | Sigma |
| A | 13 | 254 | 9902 | 51.92 | 877 | 861 | 174.1 |
| A | 3 | 1 | 7800 | 39.85 | 877 | 861 | 174.1 |
| A | 0 | 226 | 7516 | 38.22 | 877 | 861 | 174.1 |
| B | 15 | 33 | 97968 | 595.83 | 877 | 858 | 163.0 |
| B | 0 | 228 | 21785 | 128.4 | 877 | 858 | 163.0 |
| B | 12 | 111 | 18769 | 109.89 | 877 | 858 | 163.0 |
| C | 7 | 119 | 179802 | 1156.87 | 663 | 671 | 154.8 |
| C | 14 | 238 | 105467 | 676.8 | 663 | 671 | 154.8 |
| C | 10 | 22 | 18526 | 115.31 | 663 | 671 | 154.8 |
| D | 1 | 52 | 456361 | 2186.82 | 866 | 844 | 208.3 |
| D | 12 | 235 | 78455 | 372.59 | 866 | 844 | 208.3 |
| D | 2 | 120 | 35355 | 165.68 | 866 | 844 | 208.3 |
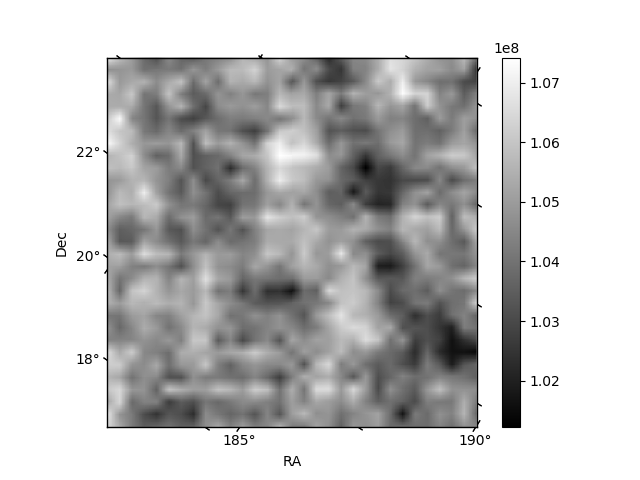
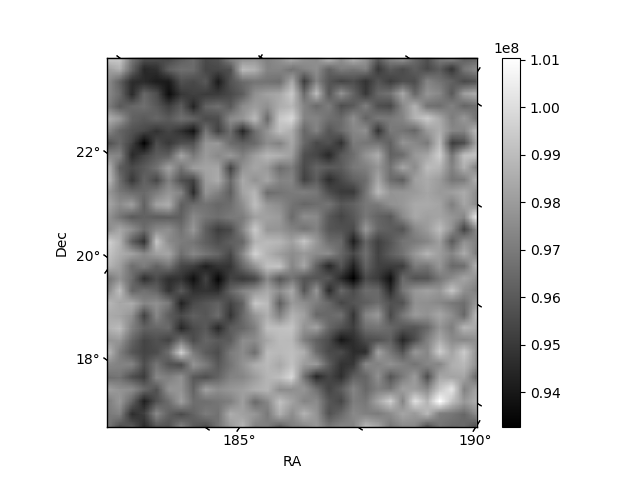
Histogram calculated using DETX and DETY for each event in the final _common_clean file
| Quadrant A | 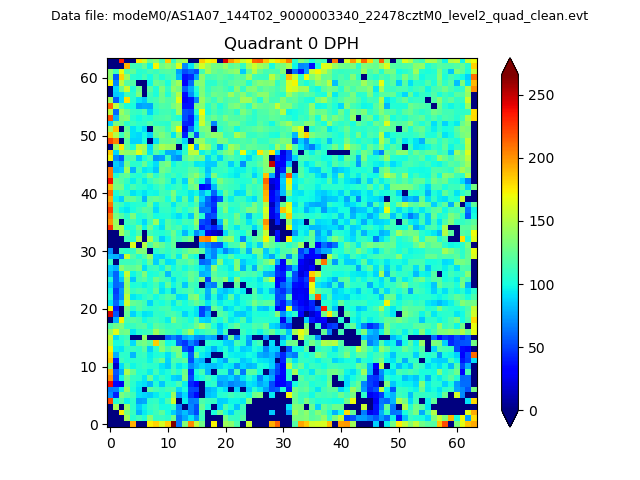 |
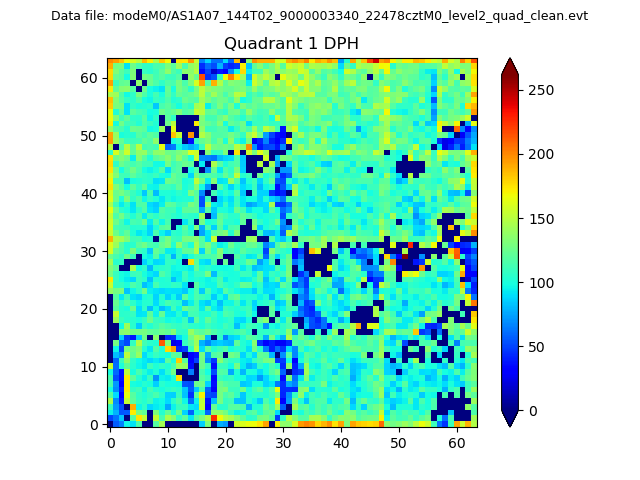 |
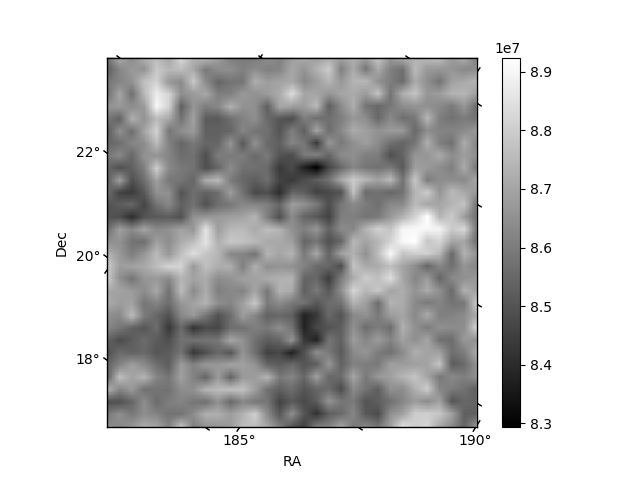
Quadrant B |
|---|---|---|---|
| Quadrant D | 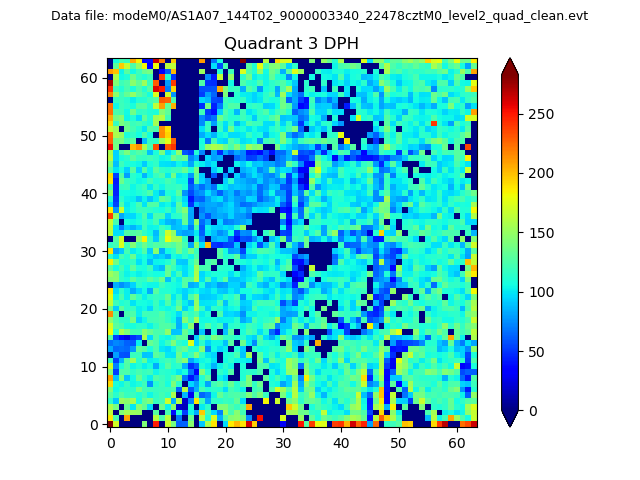 |
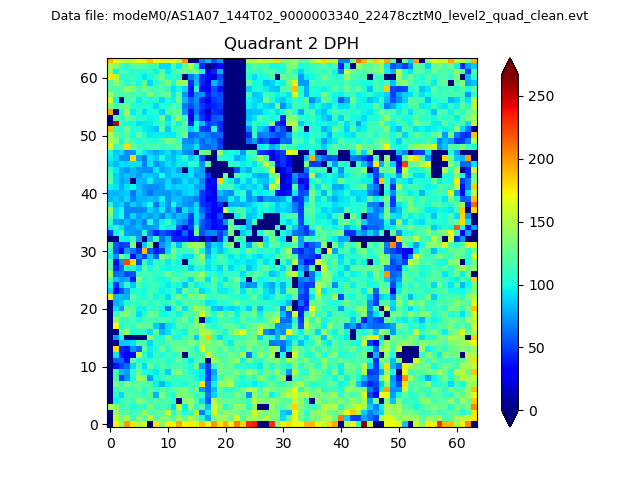 |
Quadrant C |
| Plot type | Count rate plots | Images |
|---|---|---|
| Comparison with Poisson distribution Blue bars denote a histogram of data divided into 1 sec bins. Red curve is a Poisson curve with rate = median count rate of data. |
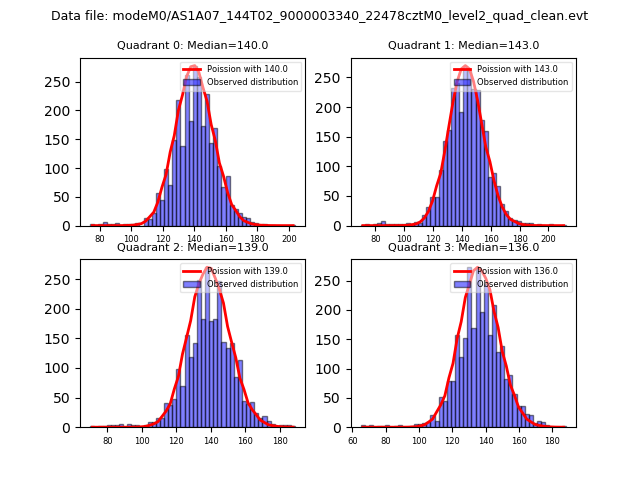 |
 |
| Quadrant-wise count rates Data is divided into 100 sec bins |
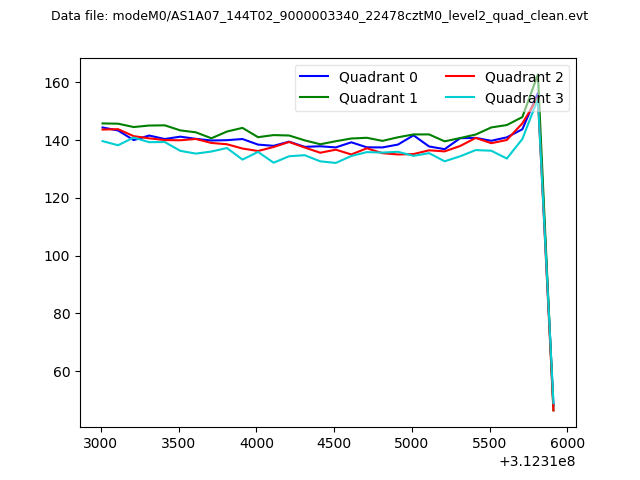 |
|
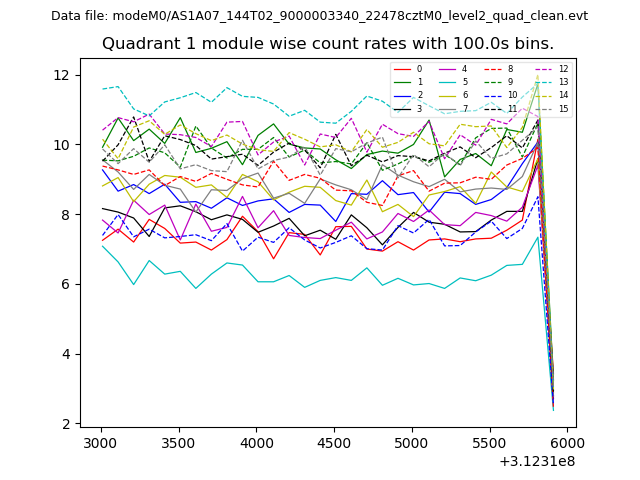
| Module-wise count rates for Quadrant A Data is divided into 100 sec bins |
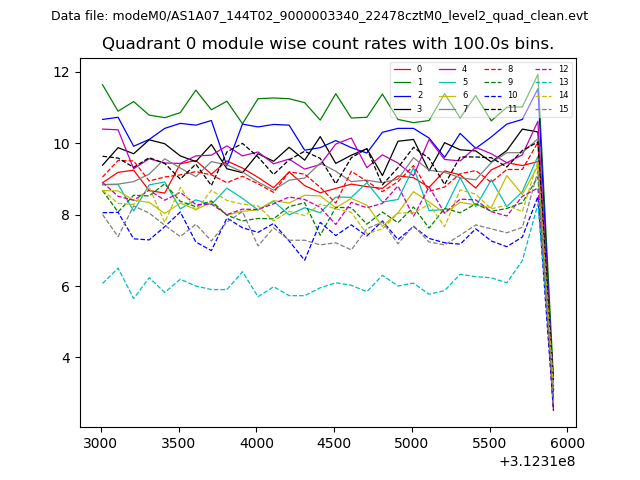 |
 |
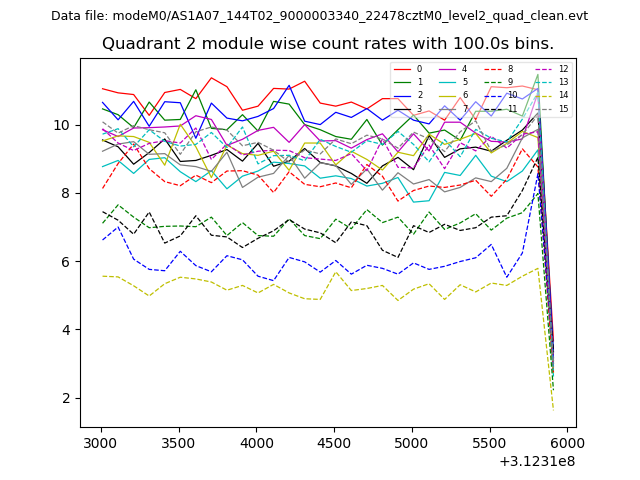
| Module-wise count rates for Quadrant B Data is divided into 100 sec bins |
 |
 |
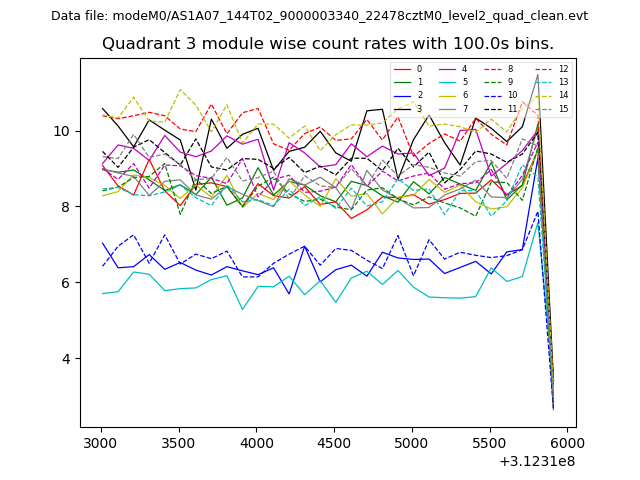
| Module-wise count rates for Quadrant C Data is divided into 100 sec bins |
 |
 |
| Module-wise count rates for Quadrant D Data is divided into 100 sec bins |
 |
 |
| Parameter | Plot |
|---|---|
| CZT HV Monitor | 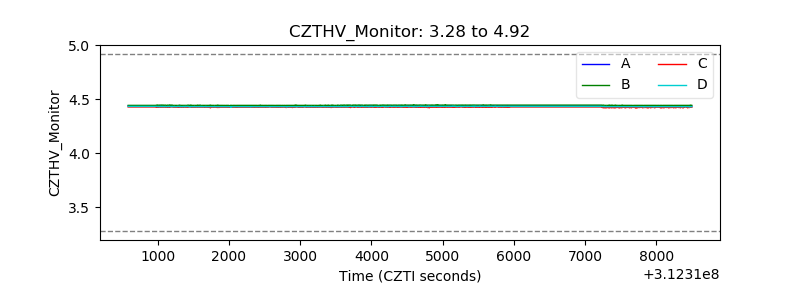 |
| D_VDD | 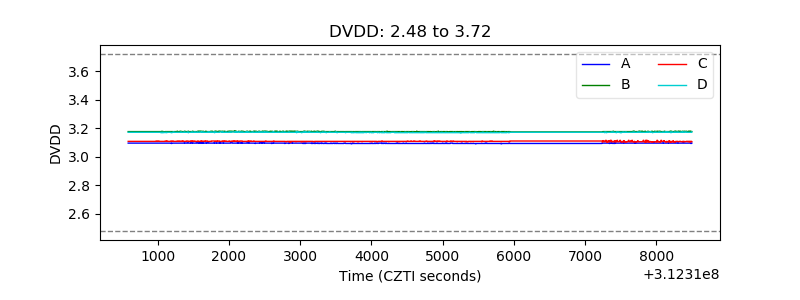 |
| Temperature 1 | 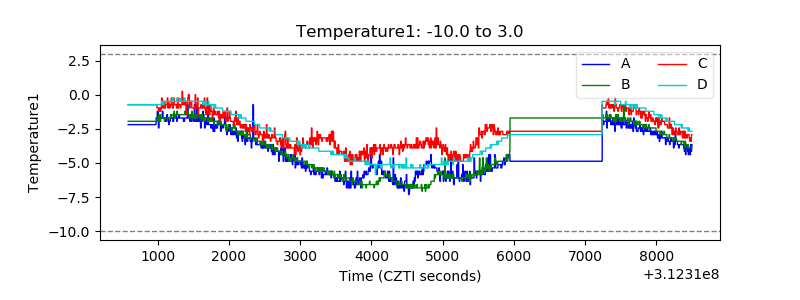 |
| Veto HV Monitor | 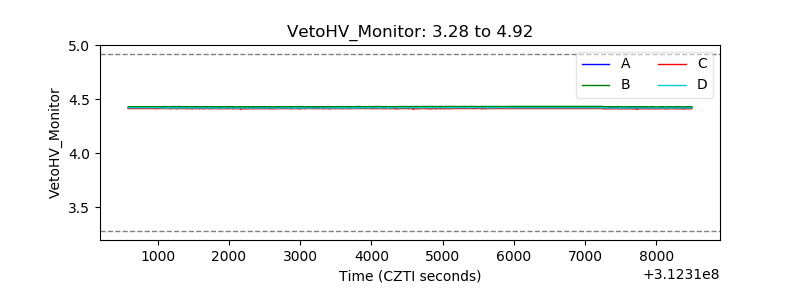 |
| Veto LLD | 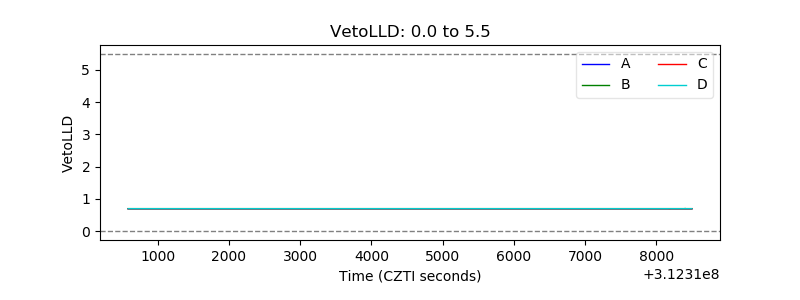 |
| Alpha Counter | 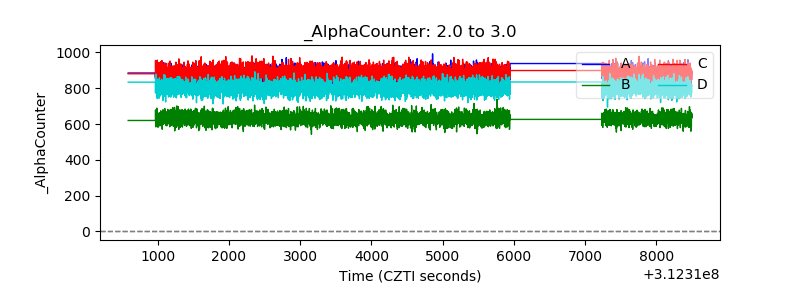 |
| _CPM_Rate | 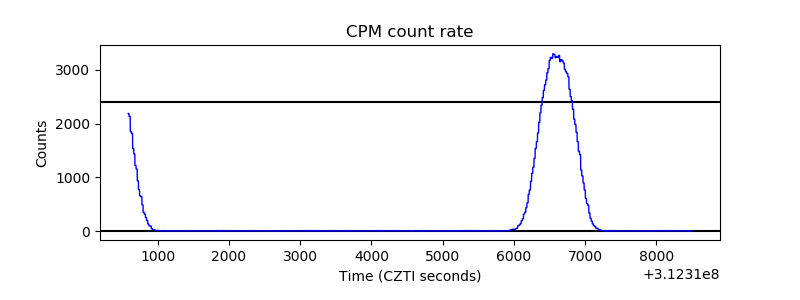 |
| CZT Counter | 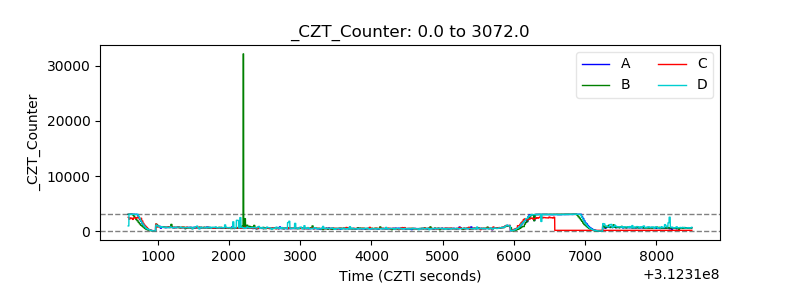 |
| +2.5 Volts monitor | 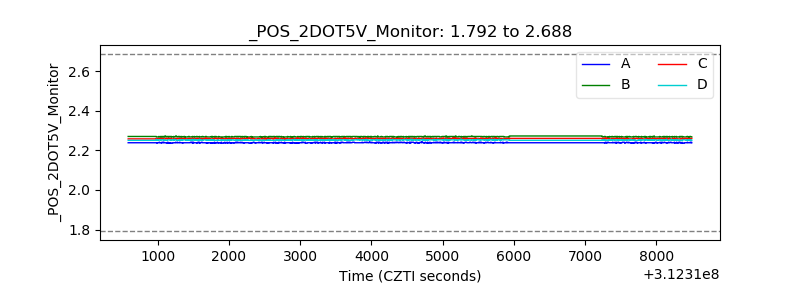 |
| +5 Volts monitor | 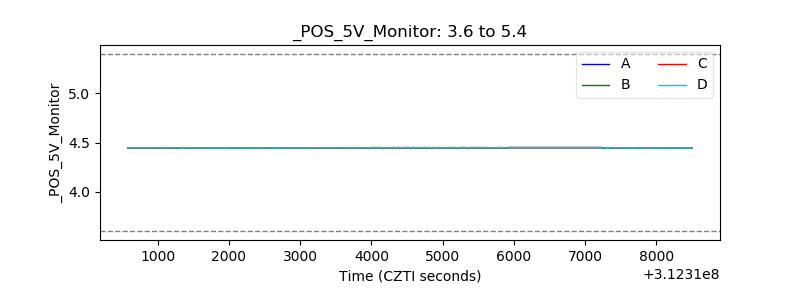 |
| _ROLL_ROT | 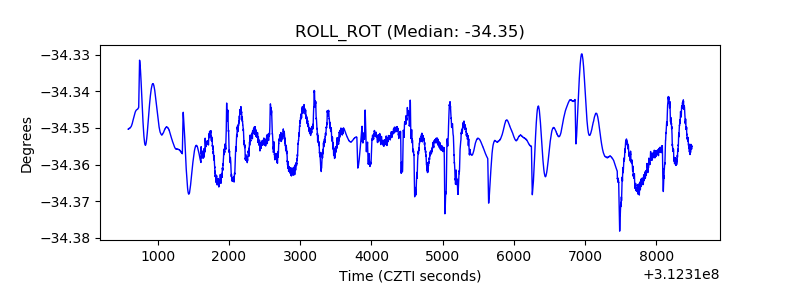 |
| _Roll_DEC | 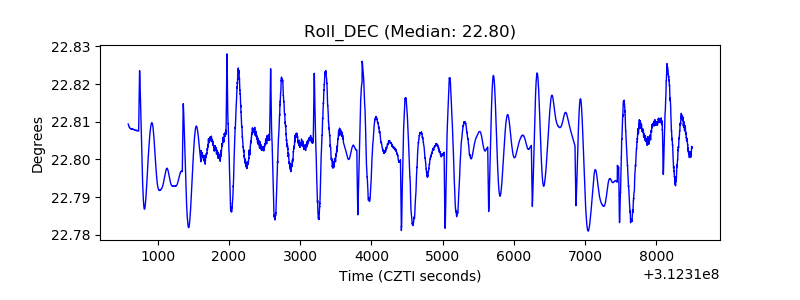 |
| _Roll_RA | 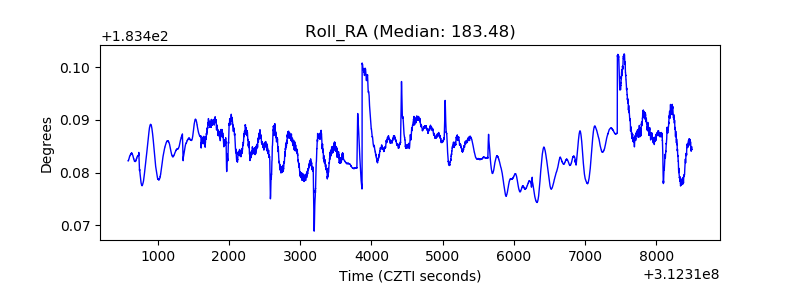 |
| Veto Counter | 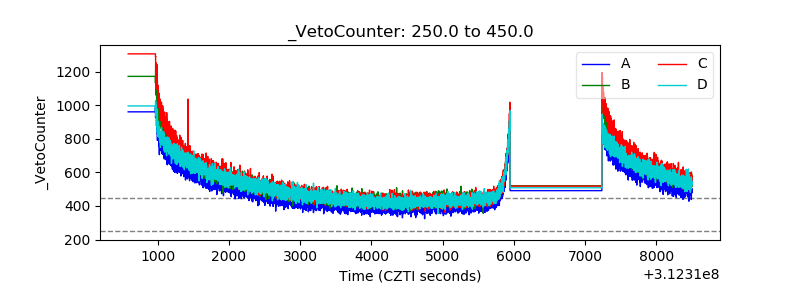 |