| Param | Original file | Final file |
|---|---|---|
| Filename | modeM0/AS1A07_144T02_9000003340_22479cztM0_level2.evt | modeM0/AS1A07_144T02_9000003340_22479cztM0_level2_quad_clean.evt |
| Size (bytes) | 400,524,480 | 62,153,280 |
| Size | 382.0 MB | 59.3 MB |
| Events in quadrant A | 3,385,753 | 483,211 |
| Events in quadrant B | 3,504,920 | 495,844 |
| Events in quadrant C | 895,077 | 64 |
| Events in quadrant D | 3,915,781 | 468,028 |
| Mode M9 | |||
|---|---|---|---|
| Quadrant | BADHDUFLAG | Total packets | Discarded packets |
| A | 0 | 14 | 0 |
| B | 0 | 14 | 0 |
| C | 0 | 14 | 0 |
| D | 0 | 14 | 0 |
| Mode SS | |||
|---|---|---|---|
| Quadrant | BADHDUFLAG | Total packets | Discarded packets |
| A | 0 | 124 | 0 |
| B | 0 | 124 | 0 |
| C | 0 | 124 | 0 |
| D | 0 | 124 | 0 |
| Mode M0 | |||
|---|---|---|---|
| Quadrant | BADHDUFLAG | Total packets | Discarded packets |
| A | 0 | 14142 | 2 |
| B | 0 | 14437 | 2 |
| C | 0 | 6214 | 2 |
| D | 0 | 15864 | 3 |
| Quadrant | Total seconds | Saturated seconds | Saturation percentage |
|---|---|---|---|
| A | 6211 | 94 | 1.513444% |
| B | 6212 | 121 | 1.947843% |
| C | 6212 | 6212 | 100.000000% |
| D | 6211 | 177 | 2.849783% |
Noise dominated data is calculated using 1-second bins in cleaned event files. If a bin has >2000 counts, and if more than 50% of those come from <1% of pixels, then it is considered to be noise-dominated and hence unusable.
| Quadrant | # 1 sec bins | Bins with >0 counts | Bins with >2000 counts | High rate bins dominated by noise | Noise dominated (total time) | Noise dominated (detector-on time) | Marked lightcurve |
|---|---|---|---|---|---|---|---|
| A | 7526 | 6211 | 0 | 0 | 0.00% | 0.00% | 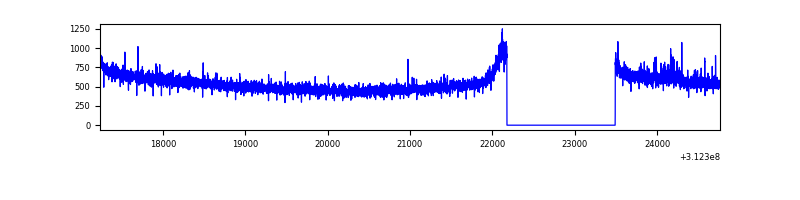 |
| B | 7527 | 6212 | 8 | 8 | 0.11% | 0.13% | 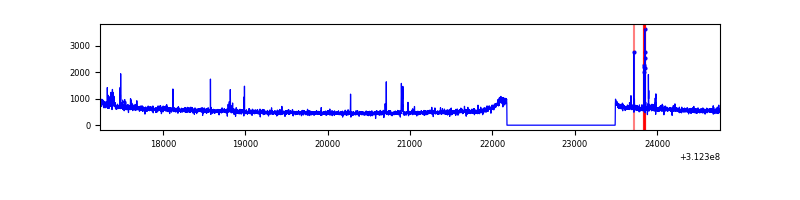 |
| C | 7526 | 6211 | 0 | 0 | 0.00% | 0.00% | 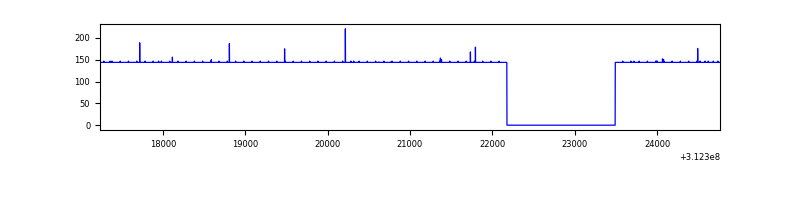 |
| D | 7526 | 6211 | 72 | 72 | 0.96% | 1.16% | 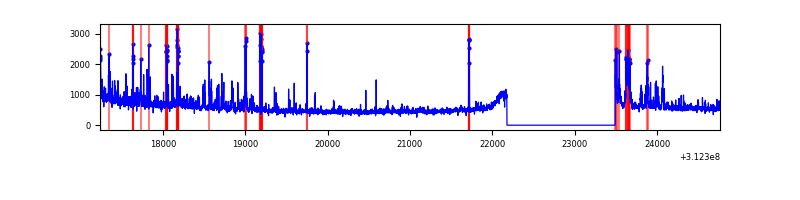 |
Top three noisy pixels from each quadrant. If the there are fewer than three noisy pixels in the level2.evt file, extra rows are filled as -1
| Pixel properties | Quadrant properties | ||||||
|---|---|---|---|---|---|---|---|
| Quadrant | DetID | PixID | Counts | Sigma | Mean | Median | Sigma |
| A | 3 | 1 | 35534 | 199.81 | 870 | 854 | 173.6 |
| A | 13 | 254 | 10040 | 52.93 | 870 | 854 | 173.6 |
| A | 0 | 226 | 7549 | 38.57 | 870 | 854 | 173.6 |
| B | 15 | 33 | 47545 | 286.12 | 870 | 852 | 163.2 |
| B | 0 | 229 | 18861 | 110.35 | 870 | 852 | 163.2 |
| B | 4 | 173 | 18728 | 109.54 | 870 | 852 | 163.2 |
| C | 7 | 119 | 882725 | 625068.18 | 2 | 2 | 1.4 |
| C | 7 | 226 | 1820 | 1287.35 | 2 | 2 | 1.4 |
| C | 14 | 238 | 1092 | 771.84 | 2 | 2 | 1.4 |
| D | 1 | 52 | 414620 | 2000.01 | 854 | 833 | 206.9 |
| D | 12 | 235 | 78127 | 373.59 | 854 | 833 | 206.9 |
| D | 12 | 227 | 66650 | 318.12 | 854 | 833 | 206.9 |
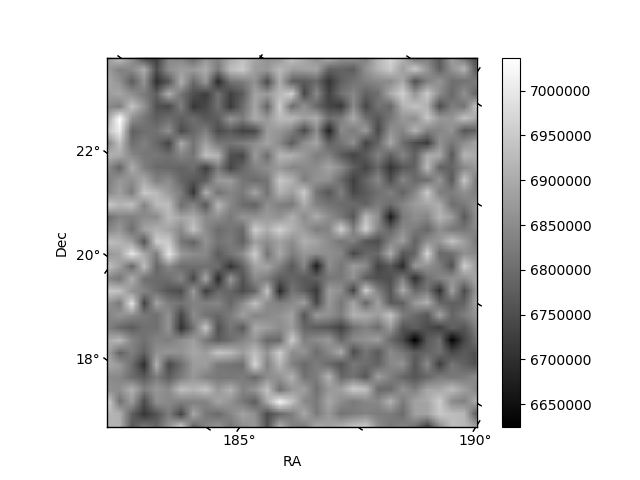
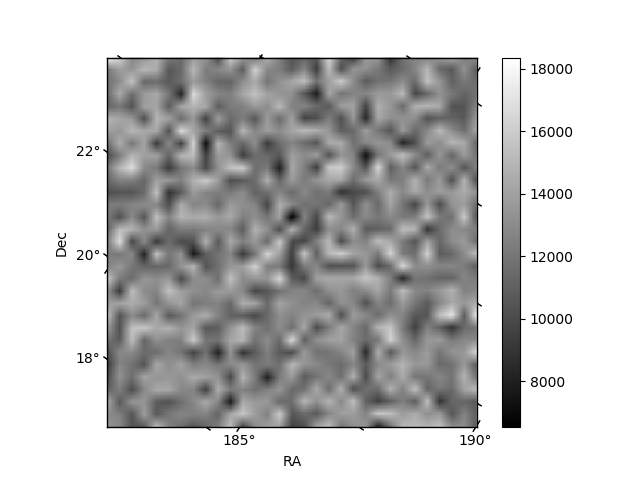
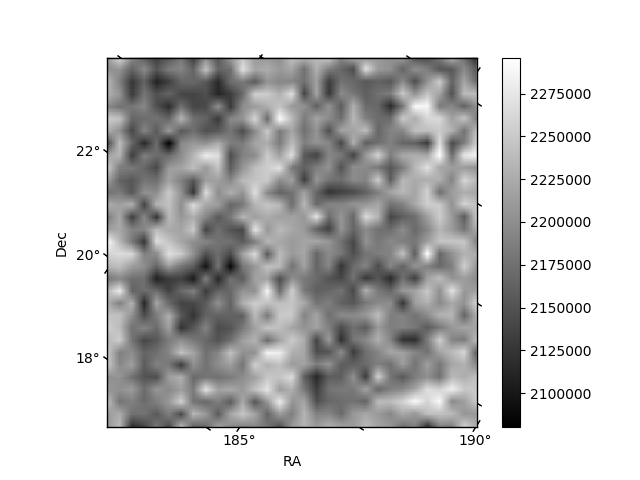
Histogram calculated using DETX and DETY for each event in the final _common_clean file
| Quadrant A | 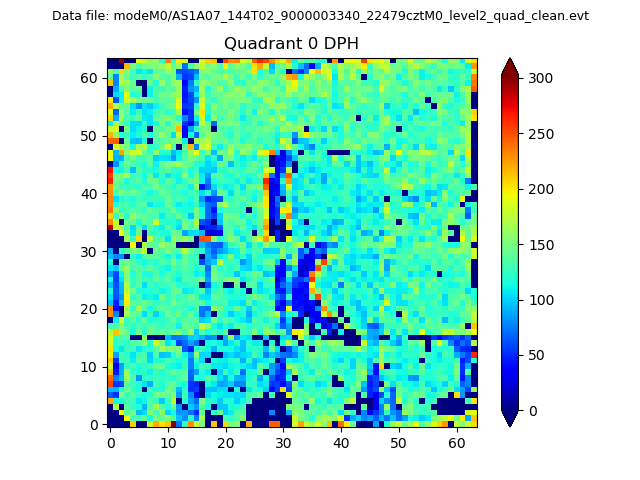 |
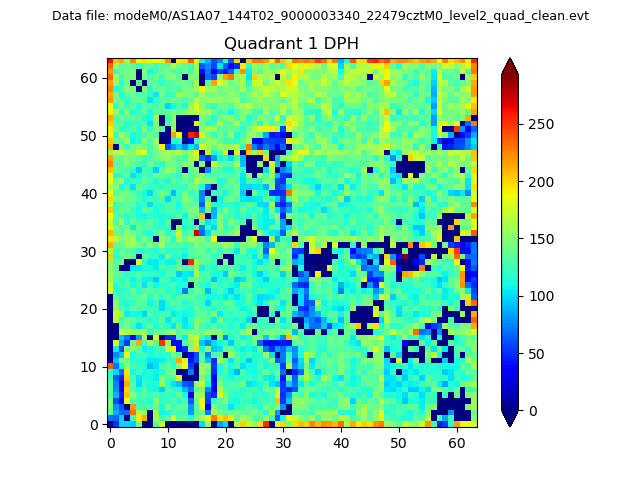 |
Quadrant B |
|---|---|---|---|
| Quadrant D | 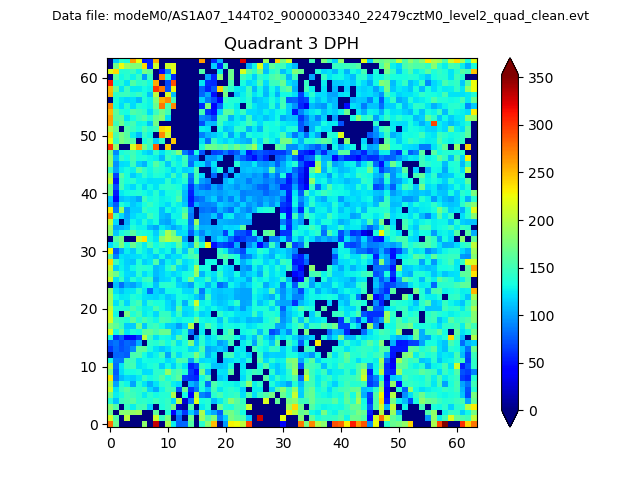 |
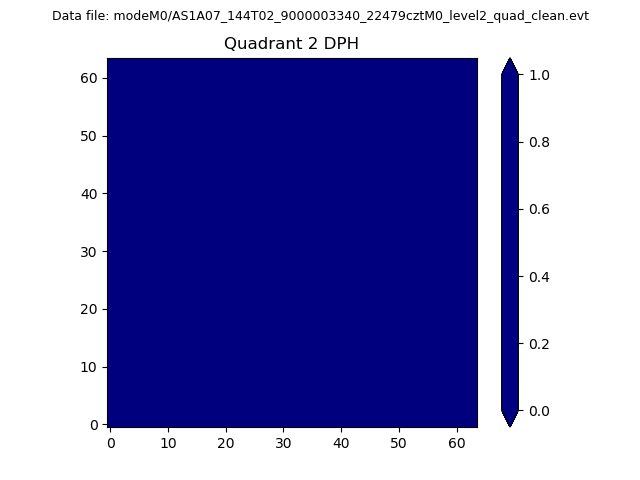 |
Quadrant C |
| Plot type | Count rate plots | Images |
|---|---|---|
| Comparison with Poisson distribution Blue bars denote a histogram of data divided into 1 sec bins. Red curve is a Poisson curve with rate = median count rate of data. |
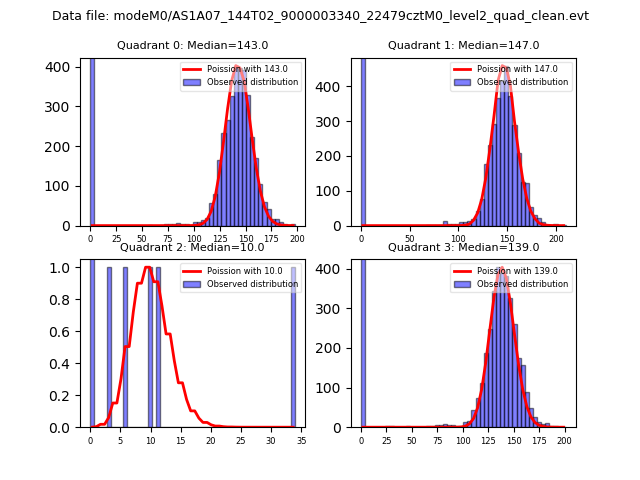 |
 |
| Quadrant-wise count rates Data is divided into 100 sec bins |
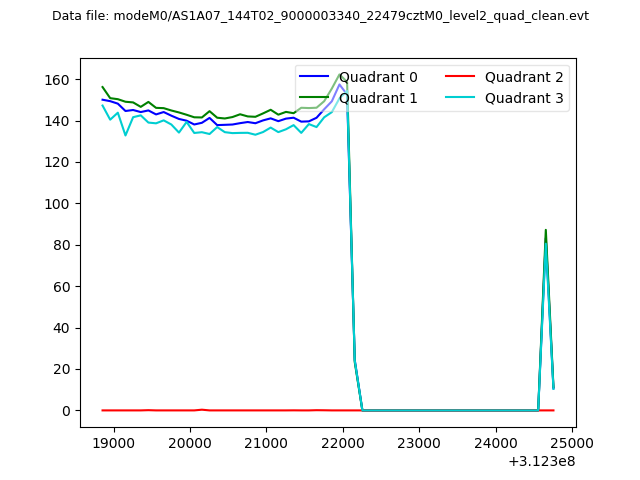 |
|
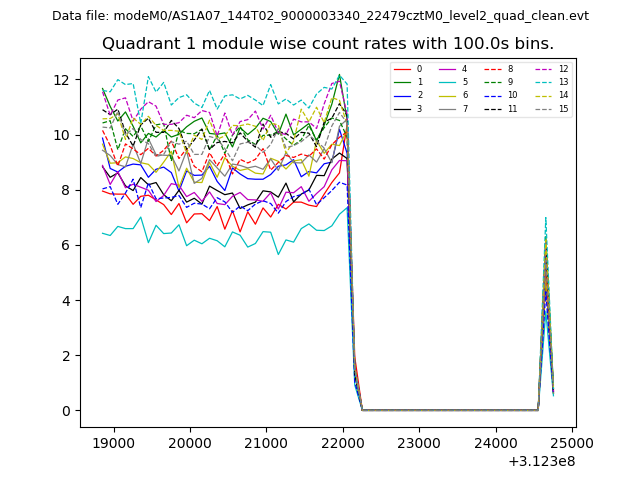
| Module-wise count rates for Quadrant A Data is divided into 100 sec bins |
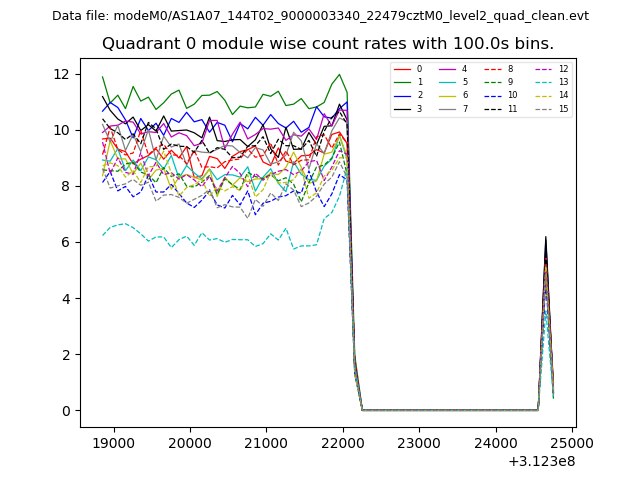 |
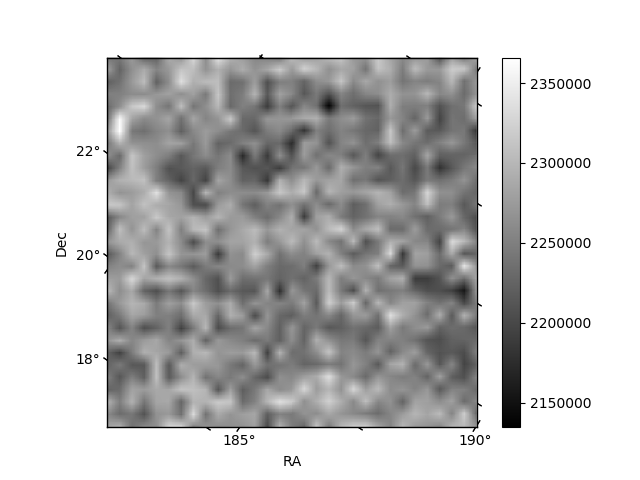 |
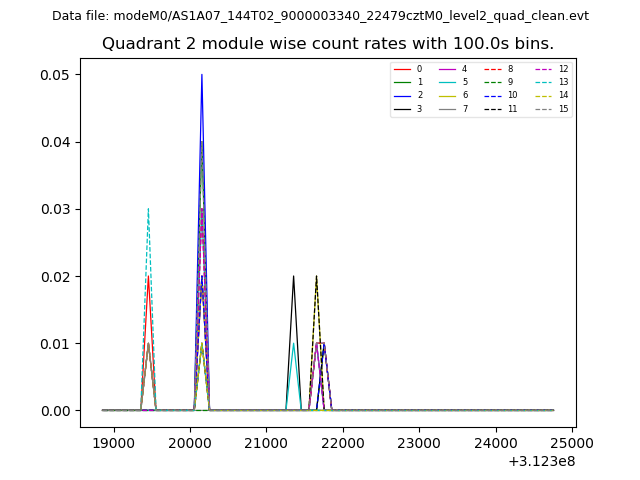
| Module-wise count rates for Quadrant B Data is divided into 100 sec bins |
 |
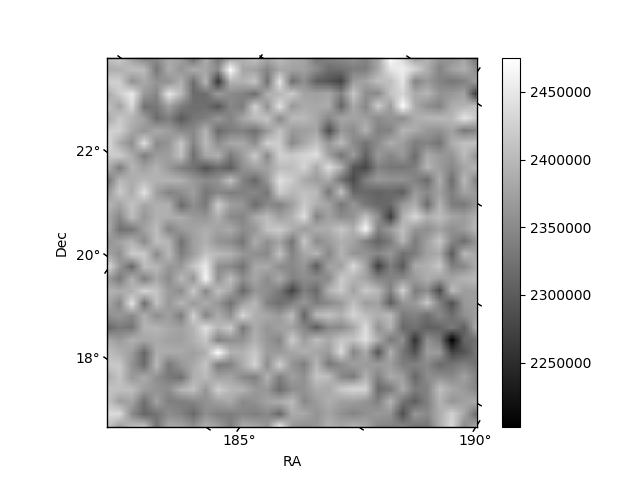 |
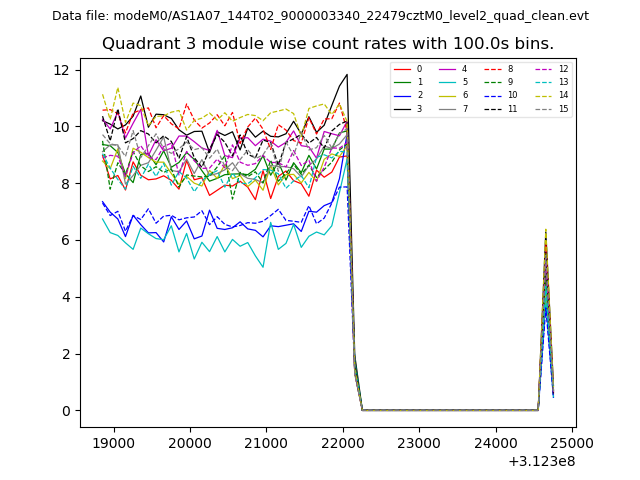
| Module-wise count rates for Quadrant C Data is divided into 100 sec bins |
 |
 |
| Module-wise count rates for Quadrant D Data is divided into 100 sec bins |
 |
 |
| Parameter | Plot |
|---|---|
| CZT HV Monitor | 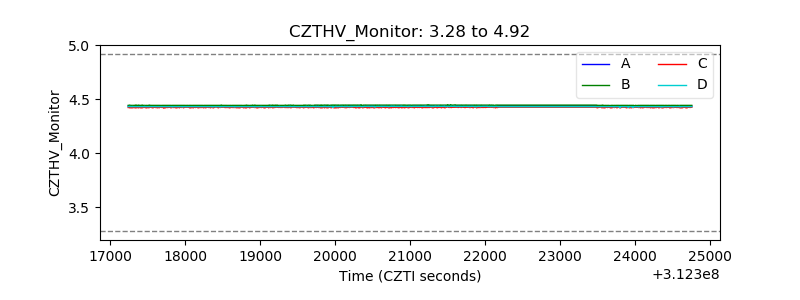 |
| D_VDD | 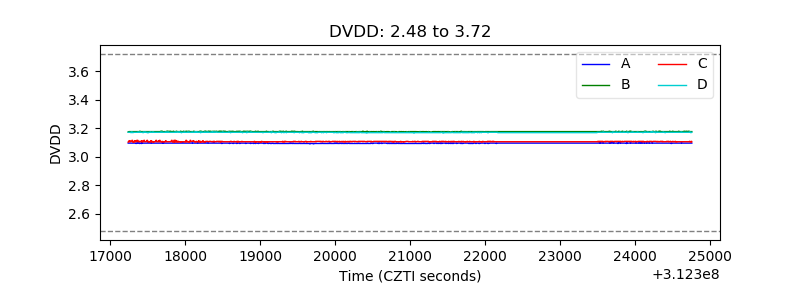 |
| Temperature 1 | 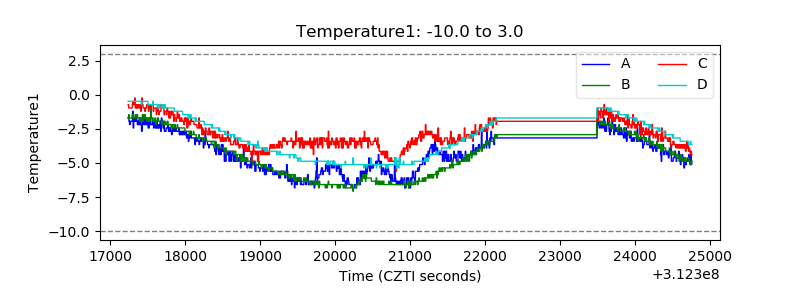 |
| Veto HV Monitor | 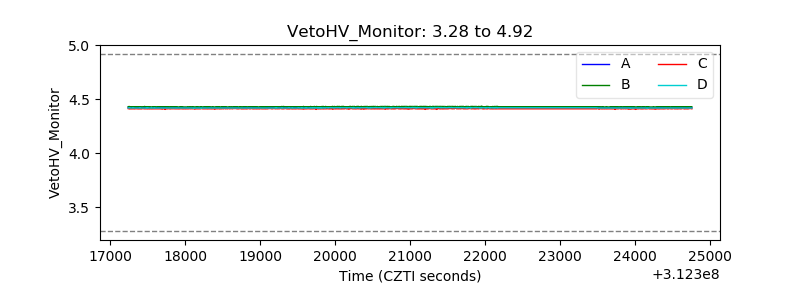 |
| Veto LLD | 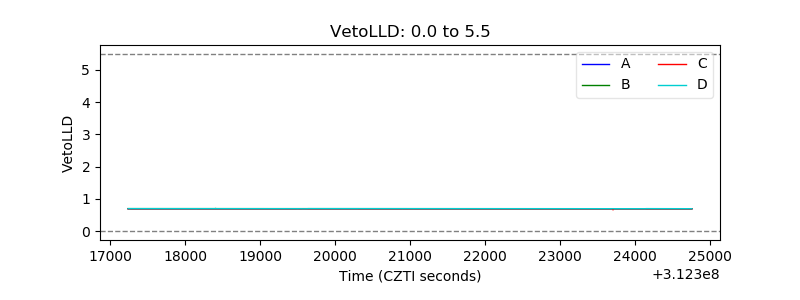 |
| Alpha Counter | 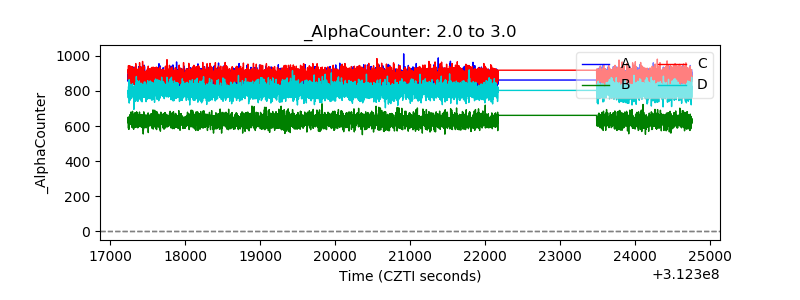 |
| _CPM_Rate | 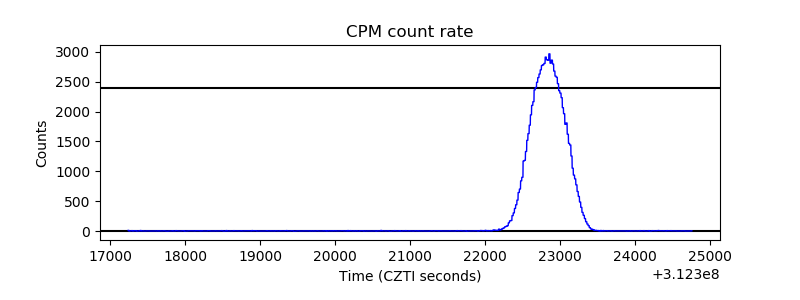 |
| CZT Counter | 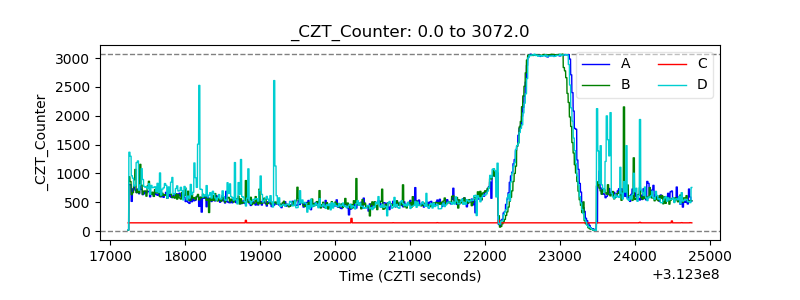 |
| +2.5 Volts monitor |  |
| +5 Volts monitor | 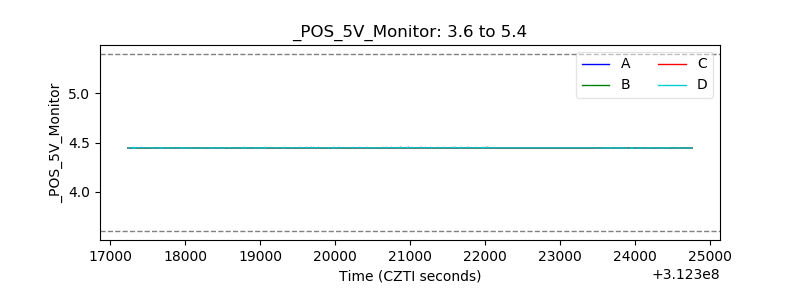 |
| _ROLL_ROT | 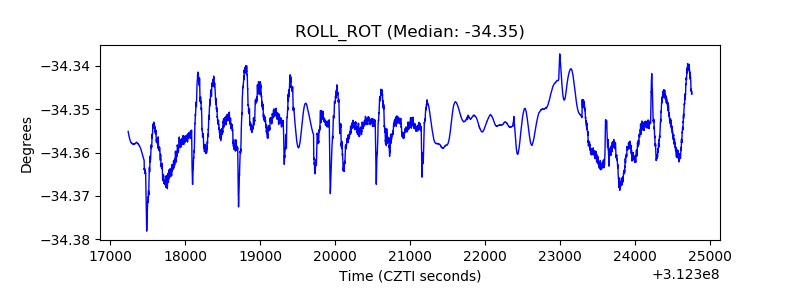 |
| _Roll_DEC | 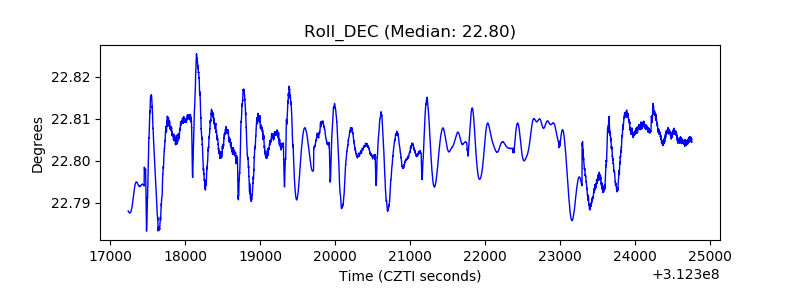 |
| _Roll_RA | 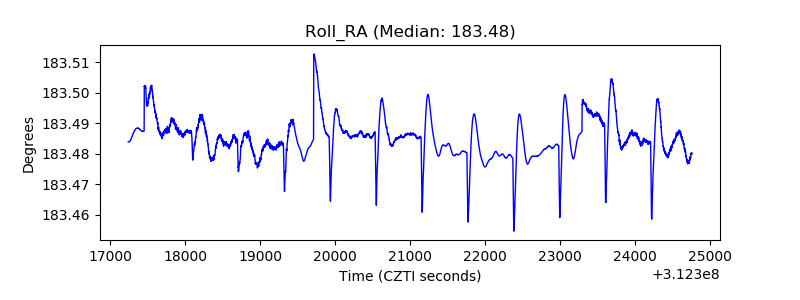 |
| Veto Counter | 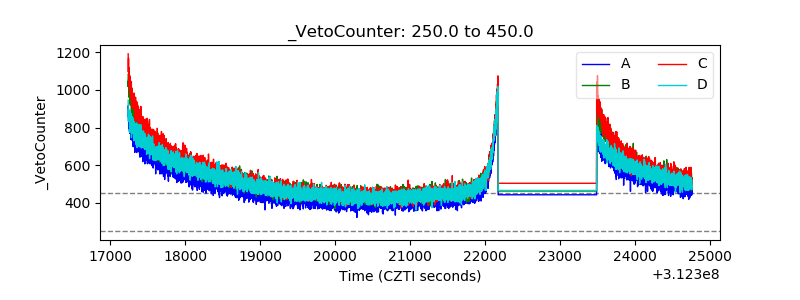 |