| Param | Original file | Final file |
|---|---|---|
| Filename | modeM0/AS1A07_144T02_9000003340_22481cztM0_level2.evt | modeM0/AS1A07_144T02_9000003340_22481cztM0_level2_quad_clean.evt |
| Size (bytes) | 387,290,880 | 74,793,600 |
| Size | 369.3 MB | 71.3 MB |
| Events in quadrant A | 3,194,766 | 608,118 |
| Events in quadrant B | 3,295,957 | 623,076 |
| Events in quadrant C | 931,883 | 43 |
| Events in quadrant D | 3,859,773 | 580,018 |
| Mode M9 | |||
|---|---|---|---|
| Quadrant | BADHDUFLAG | Total packets | Discarded packets |
| A | 0 | 15 | 0 |
| B | 0 | 16 | 0 |
| C | 0 | 16 | 0 |
| D | 0 | 16 | 0 |
| Mode SS | |||
|---|---|---|---|
| Quadrant | BADHDUFLAG | Total packets | Discarded packets |
| A | 0 | 132 | 0 |
| B | 0 | 132 | 0 |
| C | 0 | 132 | 0 |
| D | 0 | 132 | 0 |
| Mode M0 | |||
|---|---|---|---|
| Quadrant | BADHDUFLAG | Total packets | Discarded packets |
| A | 0 | 13614 | 2 |
| B | 0 | 13844 | 2 |
| C | 0 | 6469 | 2 |
| D | 0 | 15819 | 2 |
| Quadrant | Total seconds | Saturated seconds | Saturation percentage |
|---|---|---|---|
| A | 6467 | 54 | 0.835009% |
| B | 6467 | 72 | 1.113345% |
| C | 6467 | 6467 | 100.000000% |
| D | 6467 | 58 | 0.896861% |
Noise dominated data is calculated using 1-second bins in cleaned event files. If a bin has >2000 counts, and if more than 50% of those come from <1% of pixels, then it is considered to be noise-dominated and hence unusable.
| Quadrant | # 1 sec bins | Bins with >0 counts | Bins with >2000 counts | High rate bins dominated by noise | Noise dominated (total time) | Noise dominated (detector-on time) | Marked lightcurve |
|---|---|---|---|---|---|---|---|
| A | 7582 | 6467 | 0 | 0 | 0.00% | 0.00% | 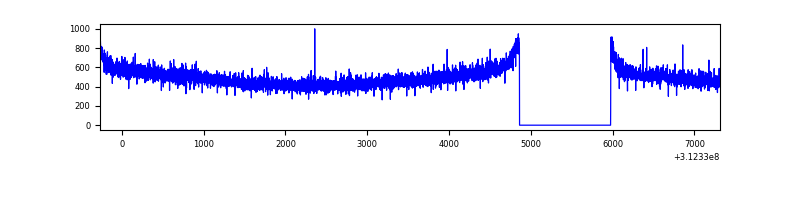 |
| B | 7582 | 6468 | 5 | 5 | 0.07% | 0.08% | 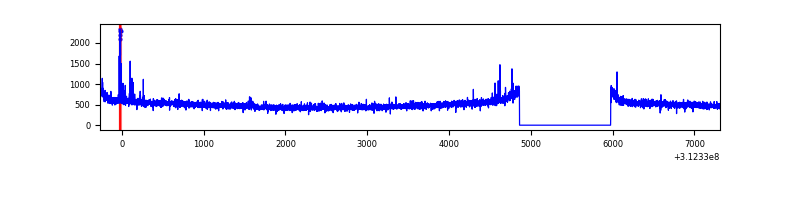 |
| C | 7581 | 6466 | 0 | 0 | 0.00% | 0.00% |  |
| D | 7582 | 6468 | 34 | 34 | 0.45% | 0.53% | 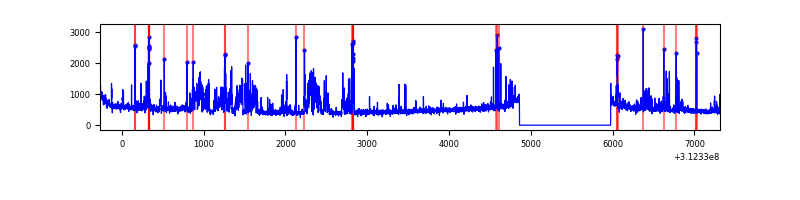 |
Top three noisy pixels from each quadrant. If the there are fewer than three noisy pixels in the level2.evt file, extra rows are filled as -1
| Pixel properties | Quadrant properties | ||||||
|---|---|---|---|---|---|---|---|
| Quadrant | DetID | PixID | Counts | Sigma | Mean | Median | Sigma |
| A | 13 | 254 | 10112 | 55.72 | 827 | 813 | 166.9 |
| A | 0 | 226 | 7116 | 37.77 | 827 | 813 | 166.9 |
| A | 3 | 137 | 7052 | 37.39 | 827 | 813 | 166.9 |
| B | 15 | 33 | 31082 | 192.5 | 829 | 809 | 157.3 |
| B | 12 | 111 | 18673 | 113.59 | 829 | 809 | 157.3 |
| B | 11 | 111 | 16896 | 102.29 | 829 | 809 | 157.3 |
| C | 7 | 119 | 919460 | 666302.05 | 2 | 2 | 1.4 |
| C | 7 | 226 | 1874 | 1356.58 | 2 | 2 | 1.4 |
| C | 14 | 238 | 1128 | 815.98 | 2 | 2 | 1.4 |
| D | 1 | 52 | 637193 | 3256.93 | 802 | 781 | 195.4 |
| D | 13 | 249 | 45604 | 229.39 | 802 | 781 | 195.4 |
| D | 13 | 172 | 31000 | 154.65 | 802 | 781 | 195.4 |
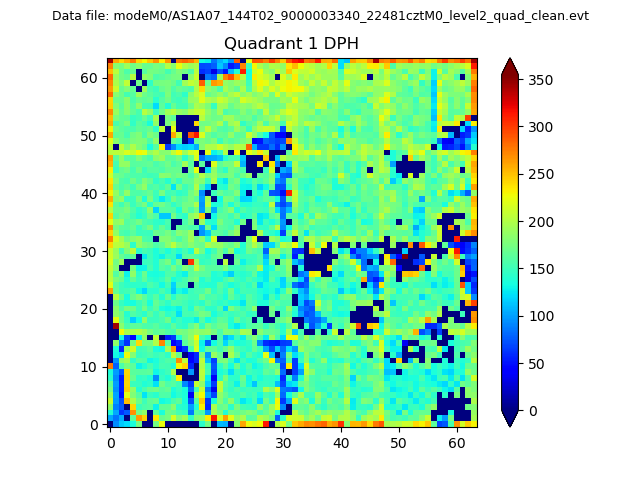
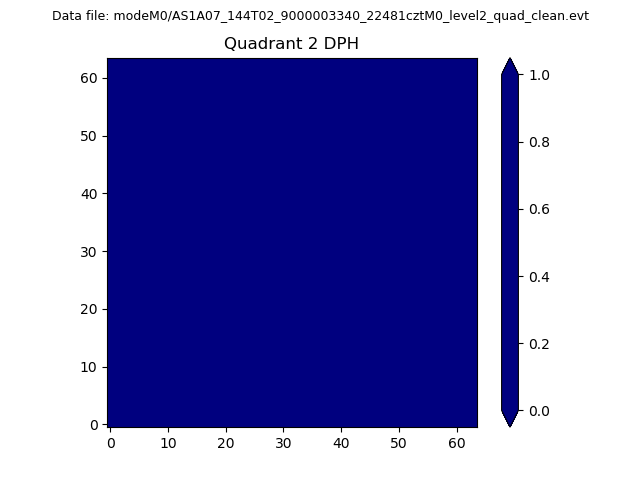
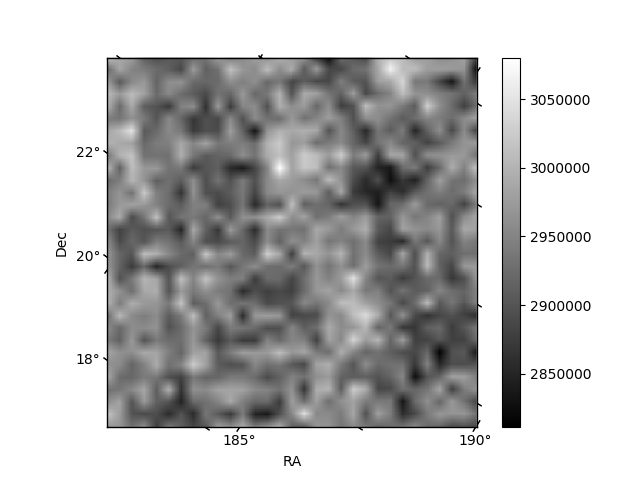
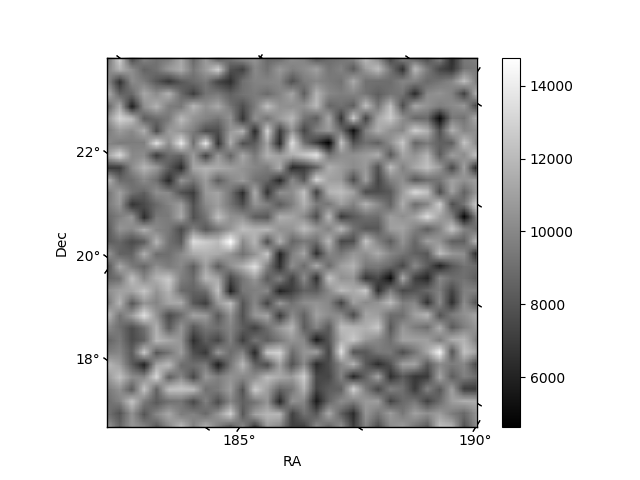
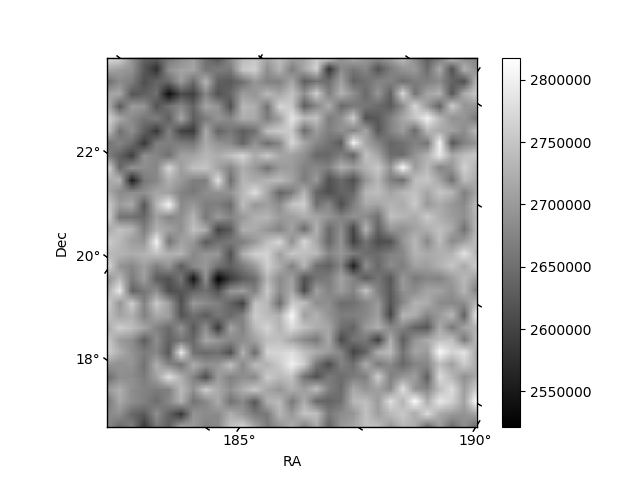
Histogram calculated using DETX and DETY for each event in the final _common_clean file
| Quadrant A | 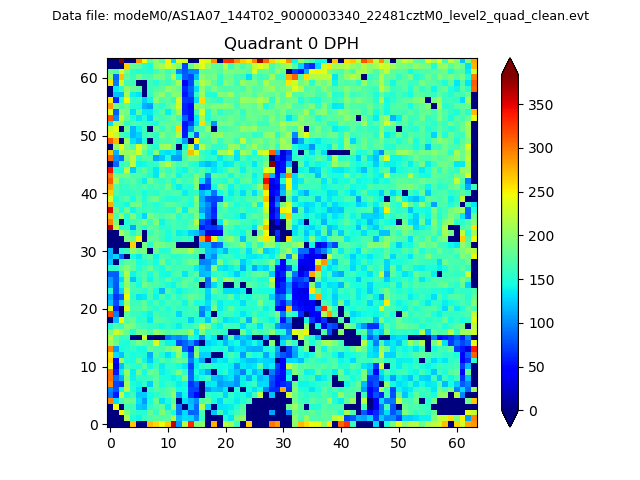 |
 |
Quadrant B |
|---|---|---|---|
| Quadrant D | 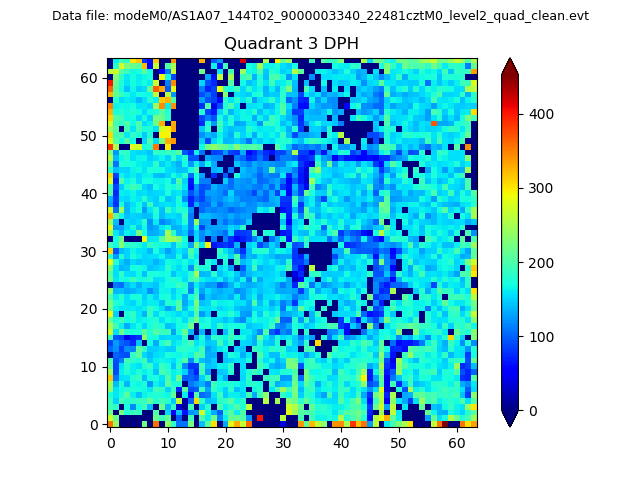 |
 |
Quadrant C |
| Plot type | Count rate plots | Images |
|---|---|---|
| Comparison with Poisson distribution Blue bars denote a histogram of data divided into 1 sec bins. Red curve is a Poisson curve with rate = median count rate of data. |
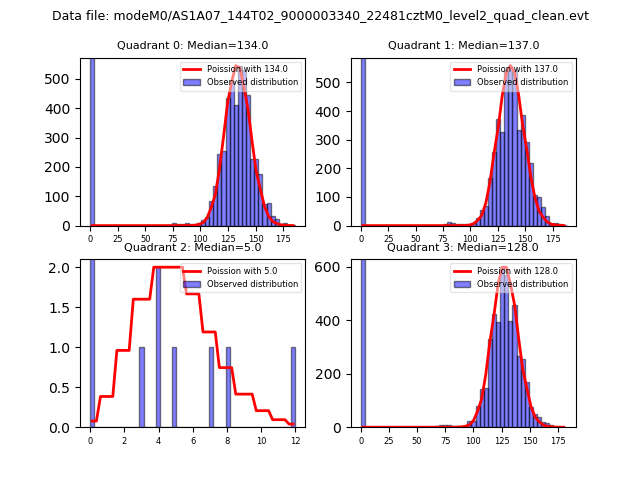 |
 |
| Quadrant-wise count rates Data is divided into 100 sec bins |
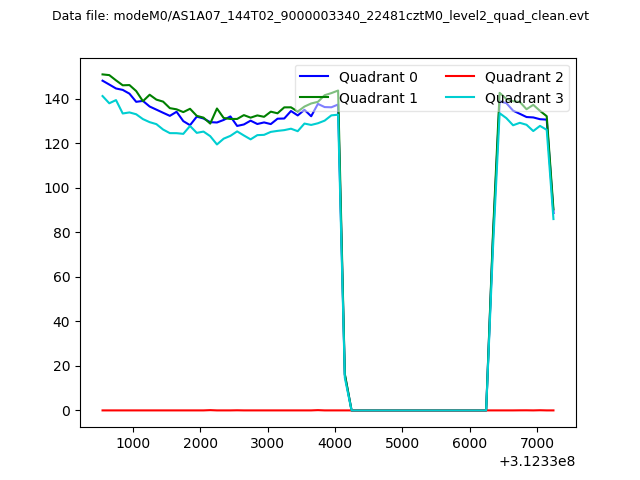 |
|
| Module-wise count rates for Quadrant A Data is divided into 100 sec bins |
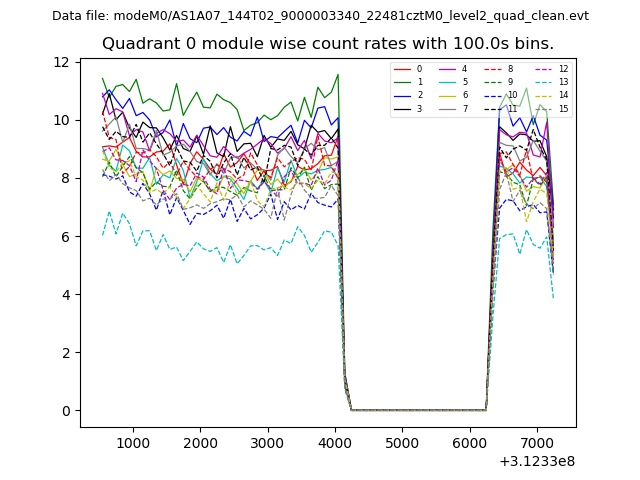 |
 |
| Module-wise count rates for Quadrant B Data is divided into 100 sec bins |
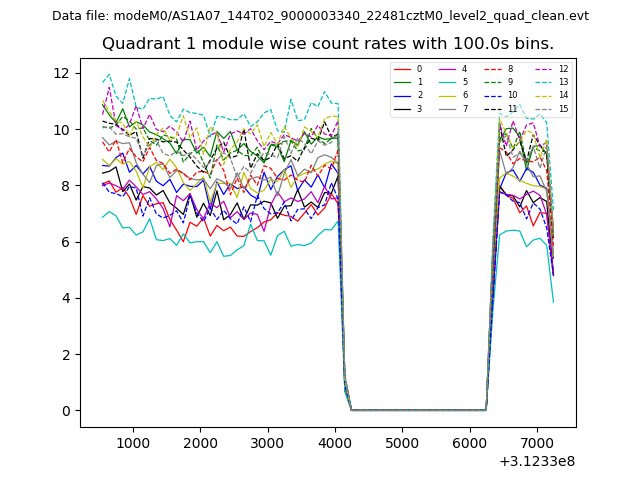 |
 |
| Module-wise count rates for Quadrant C Data is divided into 100 sec bins |
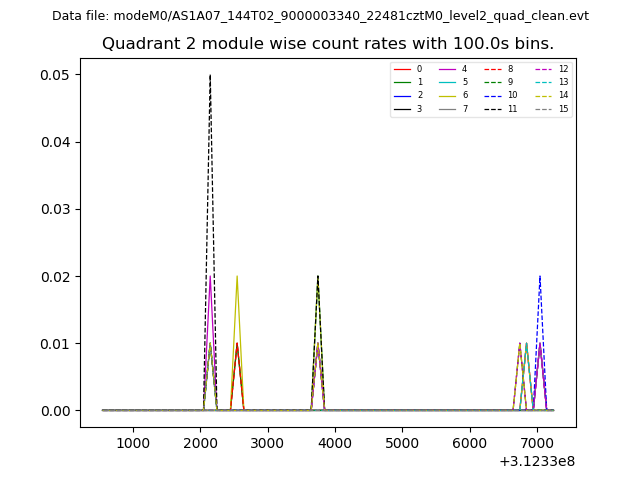 |
 |
| Module-wise count rates for Quadrant D Data is divided into 100 sec bins |
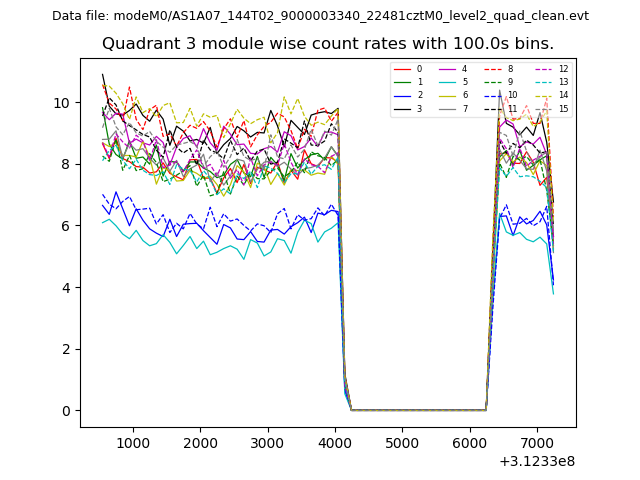 |
 |
| Parameter | Plot |
|---|---|
| CZT HV Monitor | 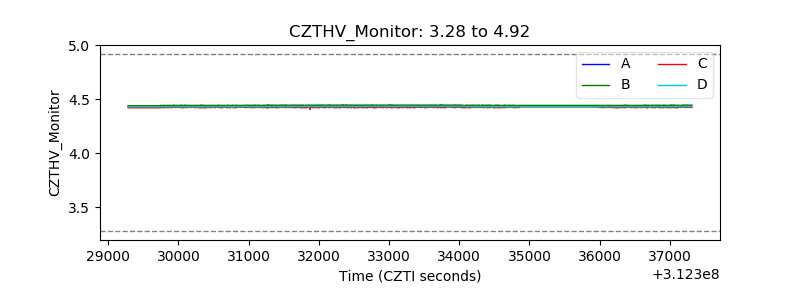 |
| D_VDD | 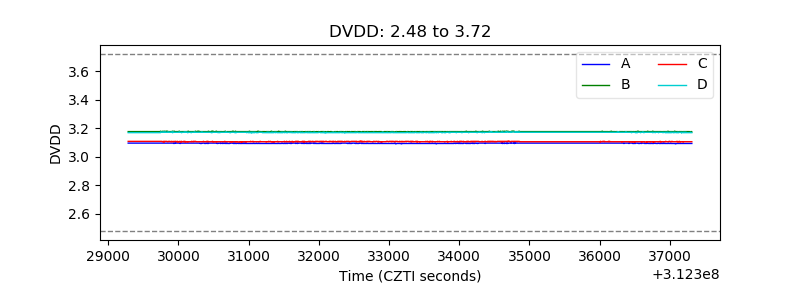 |
| Temperature 1 | 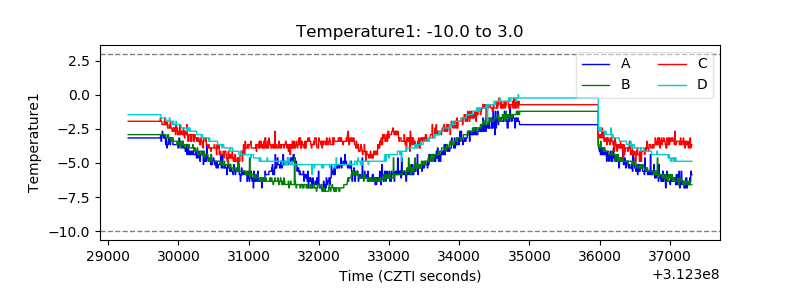 |
| Veto HV Monitor |  |
| Veto LLD | 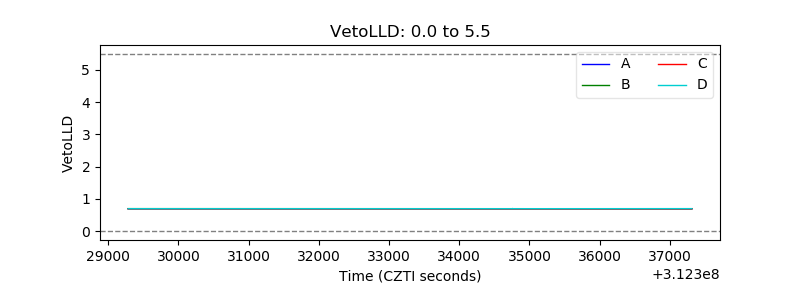 |
| Alpha Counter | 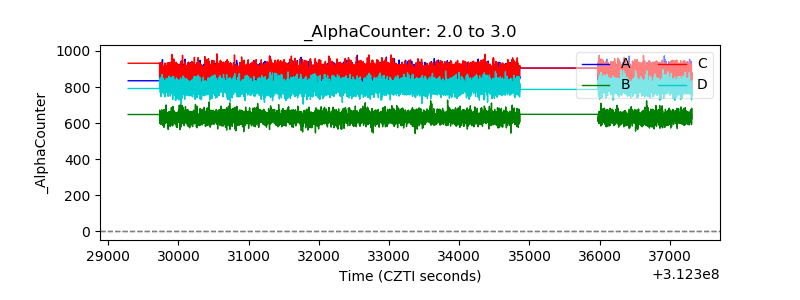 |
| _CPM_Rate | 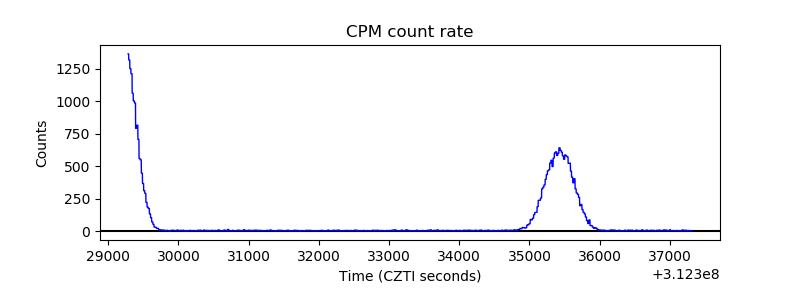 |
| CZT Counter | 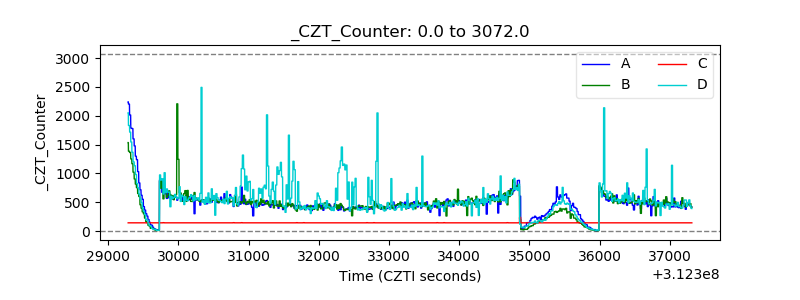 |
| +2.5 Volts monitor |  |
| +5 Volts monitor |  |
| _ROLL_ROT | 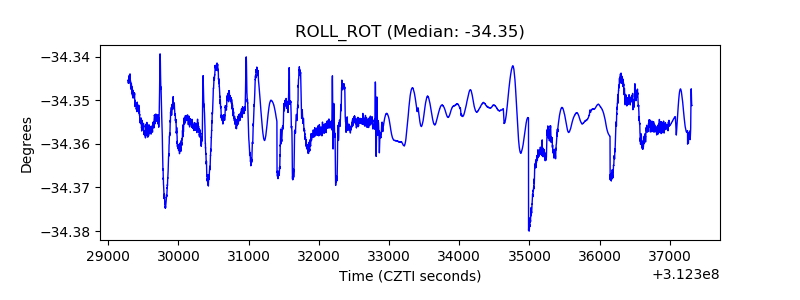 |
| _Roll_DEC | 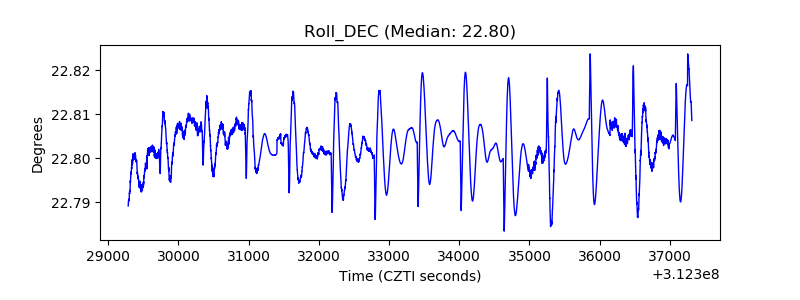 |
| _Roll_RA | 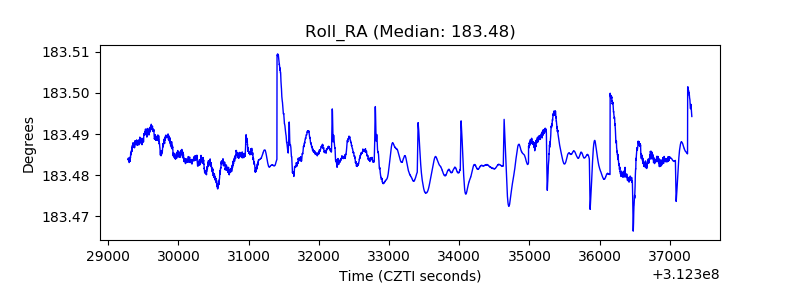 |
| Veto Counter | 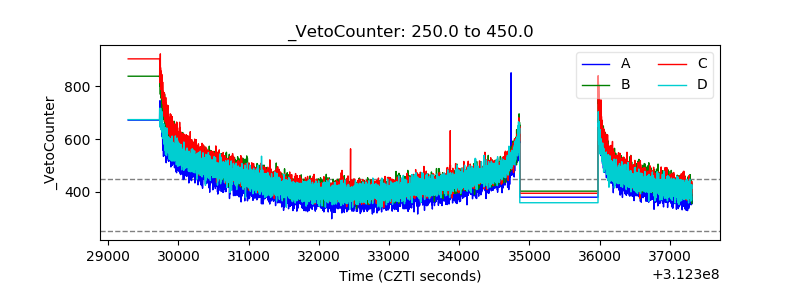 |