| Param | Original file | Final file |
|---|---|---|
| Filename | modeM0/AS1A07_144T02_9000003340_22483cztM0_level2.evt | modeM0/AS1A07_144T02_9000003340_22483cztM0_level2_quad_clean.evt |
| Size (bytes) | 812,629,440 | 140,817,600 |
| Size | 775.0 MB | 134.3 MB |
| Events in quadrant A | 6,175,282 | 1,129,650 |
| Events in quadrant B | 6,453,729 | 1,158,321 |
| Events in quadrant C | 1,876,099 | 281 |
| Events in quadrant D | 9,211,318 | 1,073,176 |
| Mode M9 | |||
|---|---|---|---|
| Quadrant | BADHDUFLAG | Total packets | Discarded packets |
| A | 0 | 12 | 0 |
| B | 0 | 12 | 0 |
| C | 0 | 12 | 0 |
| D | 0 | 12 | 0 |
| Mode SS | |||
|---|---|---|---|
| Quadrant | BADHDUFLAG | Total packets | Discarded packets |
| A | 0 | 262 | 0 |
| B | 0 | 262 | 0 |
| C | 0 | 262 | 0 |
| D | 0 | 262 | 0 |
| Mode M0 | |||
|---|---|---|---|
| Quadrant | BADHDUFLAG | Total packets | Discarded packets |
| A | 0 | 27010 | 2 |
| B | 0 | 27791 | 2 |
| C | 0 | 13020 | 2 |
| D | 0 | 36464 | 2 |
| Quadrant | Total seconds | Saturated seconds | Saturation percentage |
|---|---|---|---|
| A | 13015 | 77 | 0.591625% |
| B | 13016 | 166 | 1.275353% |
| C | 13016 | 13016 | 100.000000% |
| D | 13016 | 232 | 1.782422% |
Noise dominated data is calculated using 1-second bins in cleaned event files. If a bin has >2000 counts, and if more than 50% of those come from <1% of pixels, then it is considered to be noise-dominated and hence unusable.
| Quadrant | # 1 sec bins | Bins with >0 counts | Bins with >2000 counts | High rate bins dominated by noise | Noise dominated (total time) | Noise dominated (detector-on time) | Marked lightcurve |
|---|---|---|---|---|---|---|---|
| A | 14145 | 13016 | 2 | 2 | 0.01% | 0.02% | 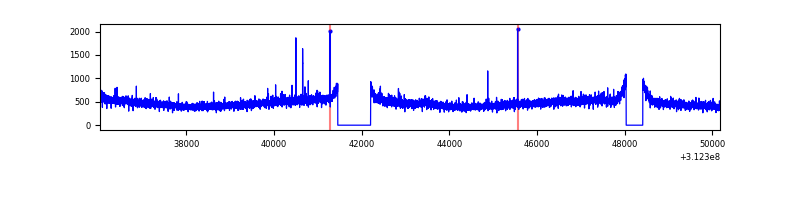 |
| B | 14146 | 13017 | 5 | 5 | 0.04% | 0.04% | 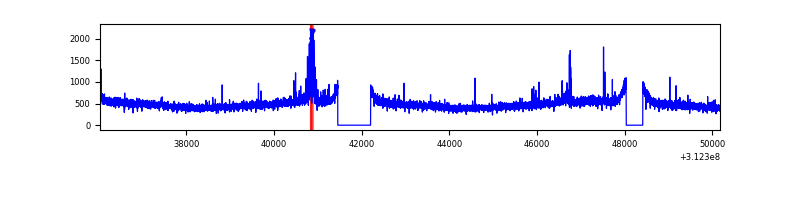 |
| C | 14145 | 13015 | 0 | 0 | 0.00% | 0.00% | 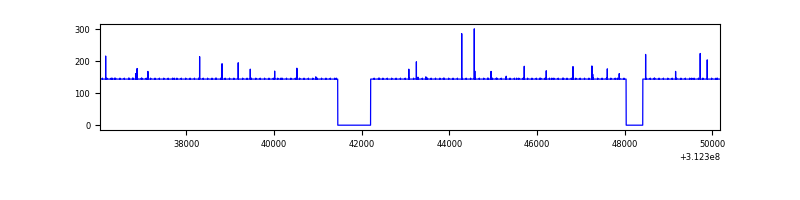 |
| D | 14146 | 13018 | 149 | 149 | 1.05% | 1.14% | 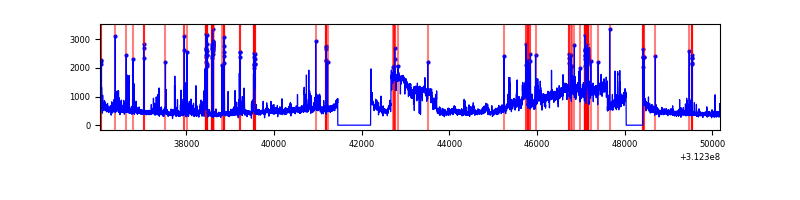 |
Top three noisy pixels from each quadrant. If the there are fewer than three noisy pixels in the level2.evt file, extra rows are filled as -1
| Pixel properties | Quadrant properties | ||||||
|---|---|---|---|---|---|---|---|
| Quadrant | DetID | PixID | Counts | Sigma | Mean | Median | Sigma |
| A | 6 | 240 | 30003 | 89.37 | 1585 | 1552 | 318.3 |
| A | 3 | 1 | 23266 | 68.21 | 1585 | 1552 | 318.3 |
| A | 13 | 254 | 19764 | 57.21 | 1585 | 1552 | 318.3 |
| B | 15 | 33 | 157918 | 516.66 | 1587 | 1548 | 302.7 |
| B | 0 | 229 | 40318 | 128.1 | 1587 | 1548 | 302.7 |
| B | 12 | 111 | 37004 | 117.15 | 1587 | 1548 | 302.7 |
| C | 7 | 119 | 1851651 | 758203.47 | 4 | 4 | 2.4 |
| C | 7 | 226 | 3846 | 1573.2 | 4 | 4 | 2.4 |
| C | 14 | 238 | 2031 | 830.01 | 4 | 4 | 2.4 |
| D | 1 | 20 | 2249792 | 6049.6 | 1531 | 1491 | 371.6 |
| D | 1 | 52 | 940255 | 2525.97 | 1531 | 1491 | 371.6 |
| D | 7 | 222 | 82866 | 218.96 | 1531 | 1491 | 371.6 |
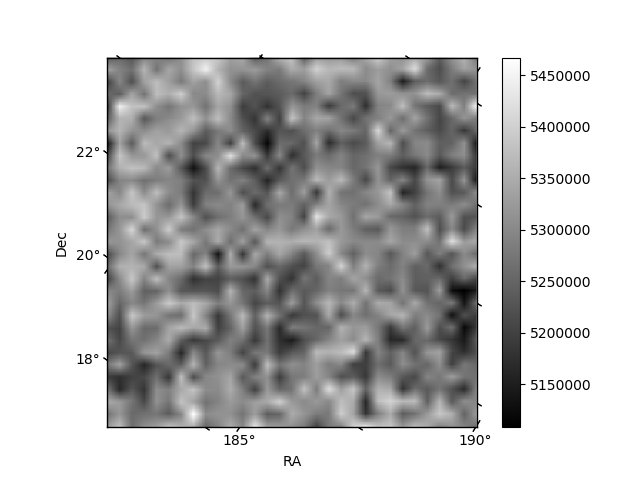
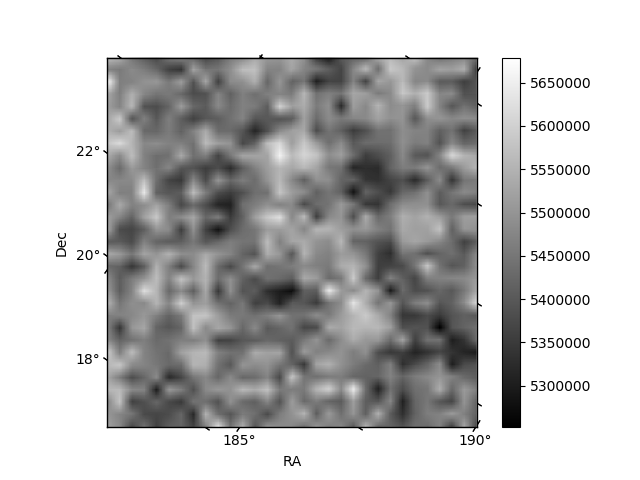
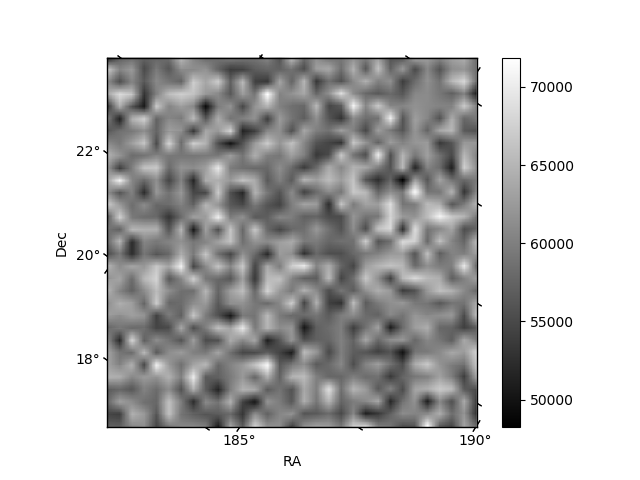
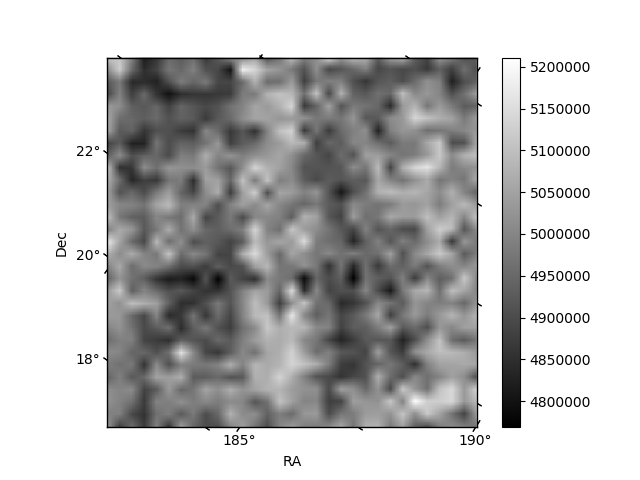
Histogram calculated using DETX and DETY for each event in the final _common_clean file
| Quadrant A | 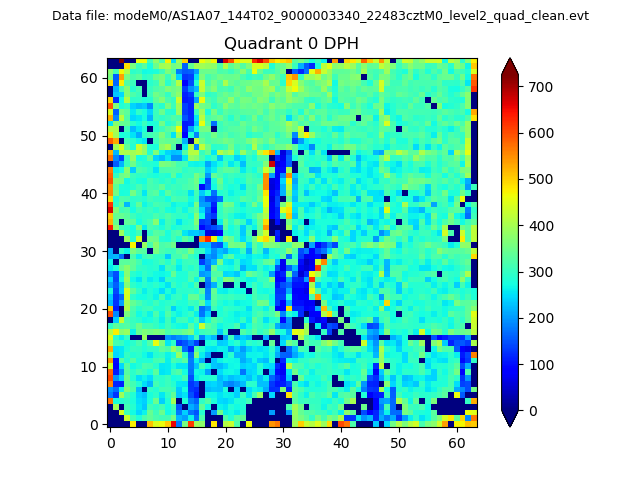 |
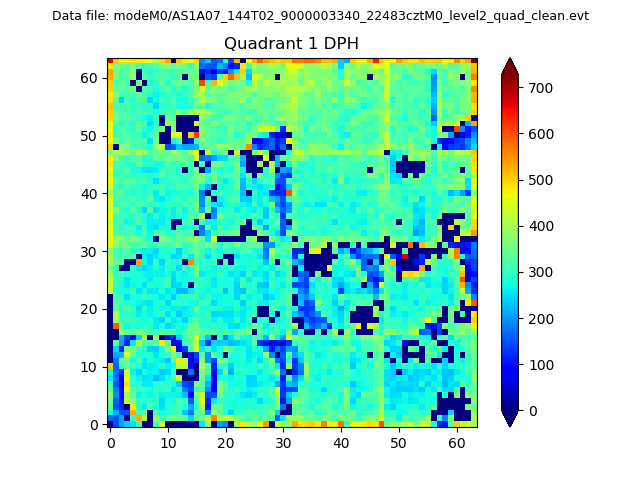 |
Quadrant B |
|---|---|---|---|
| Quadrant D | 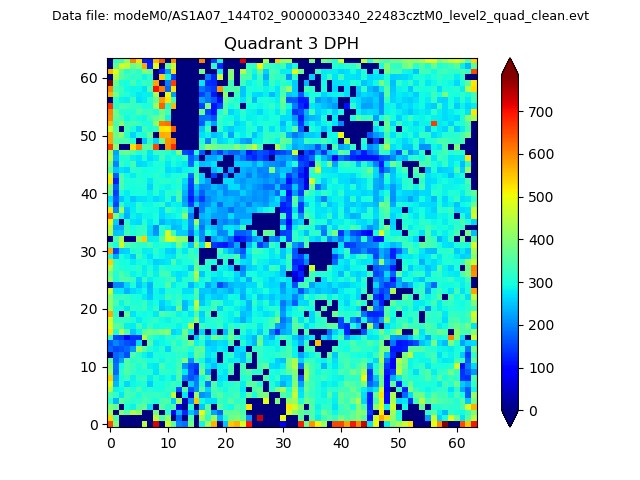 |
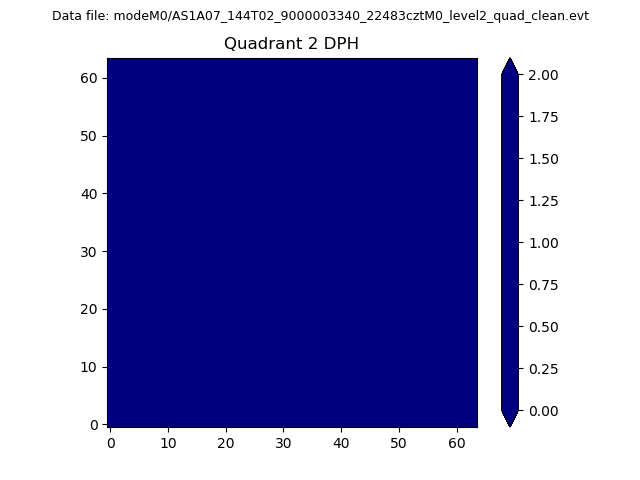 |
Quadrant C |
| Plot type | Count rate plots | Images |
|---|---|---|
| Comparison with Poisson distribution Blue bars denote a histogram of data divided into 1 sec bins. Red curve is a Poisson curve with rate = median count rate of data. |
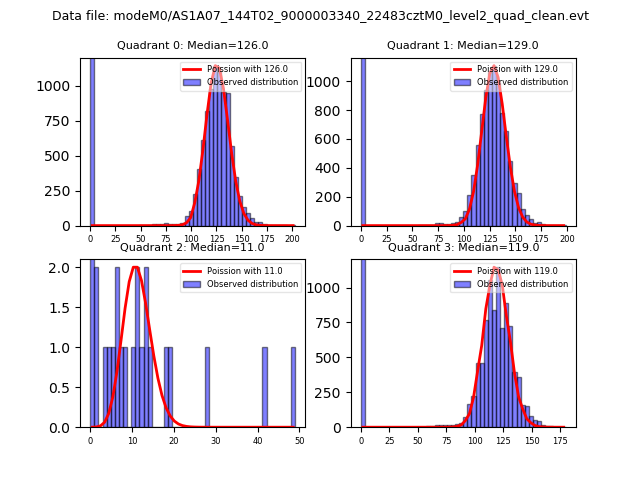 |
 |
| Quadrant-wise count rates Data is divided into 100 sec bins |
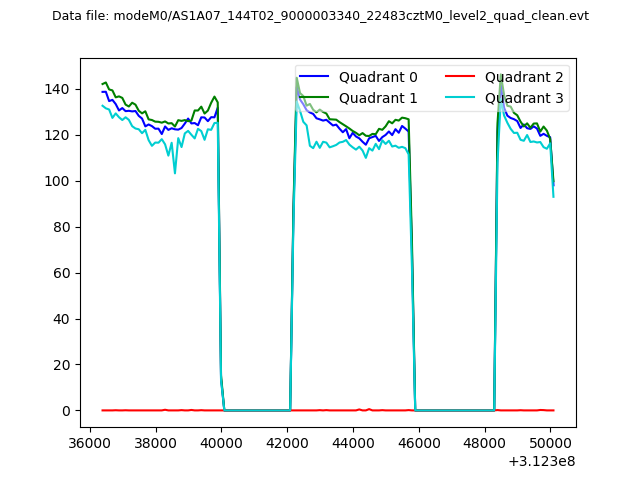 |
|
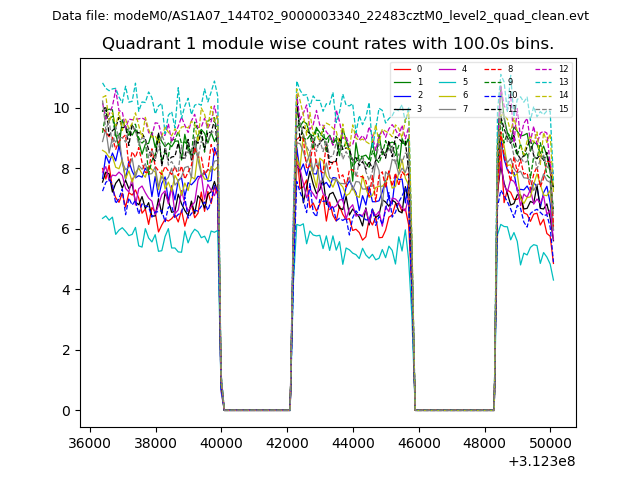
| Module-wise count rates for Quadrant A Data is divided into 100 sec bins |
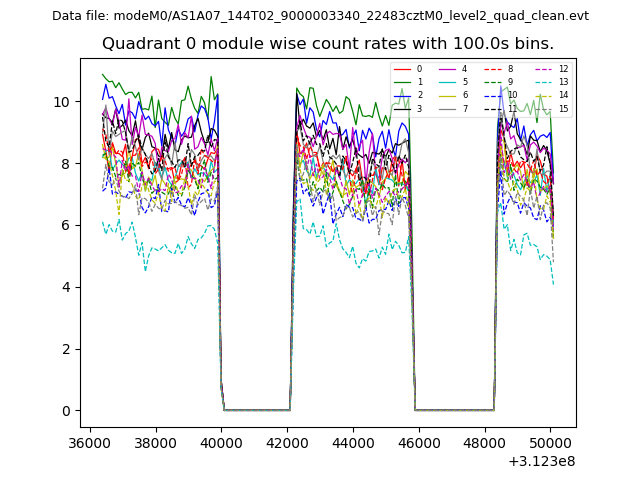 |
 |
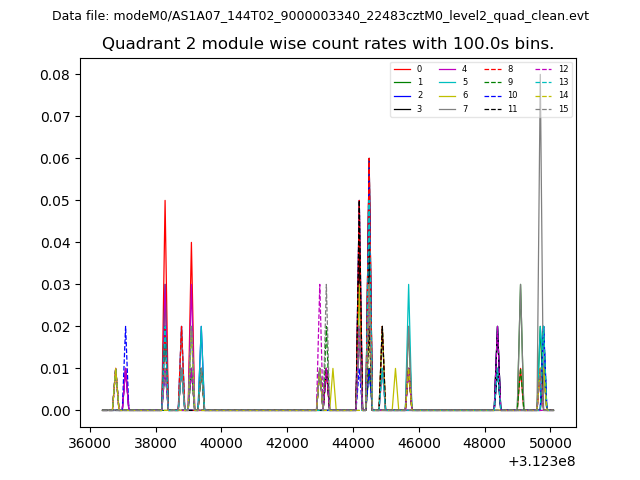
| Module-wise count rates for Quadrant B Data is divided into 100 sec bins |
 |
 |
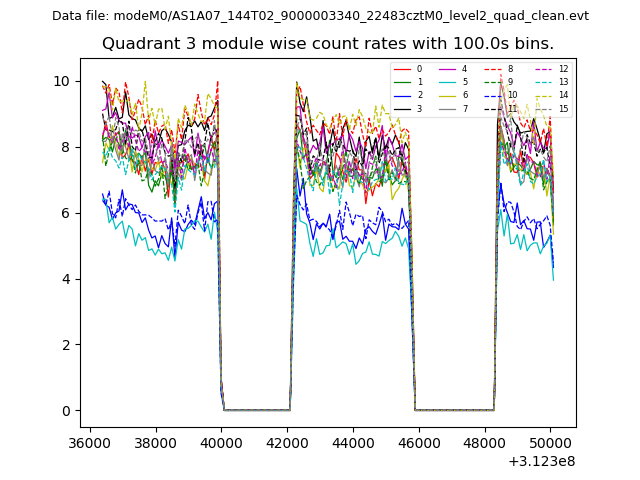
| Module-wise count rates for Quadrant C Data is divided into 100 sec bins |
 |
 |
| Module-wise count rates for Quadrant D Data is divided into 100 sec bins |
 |
 |
| Parameter | Plot |
|---|---|
| CZT HV Monitor | 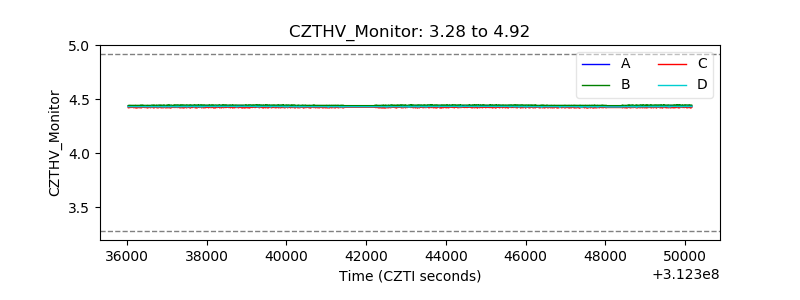 |
| D_VDD | 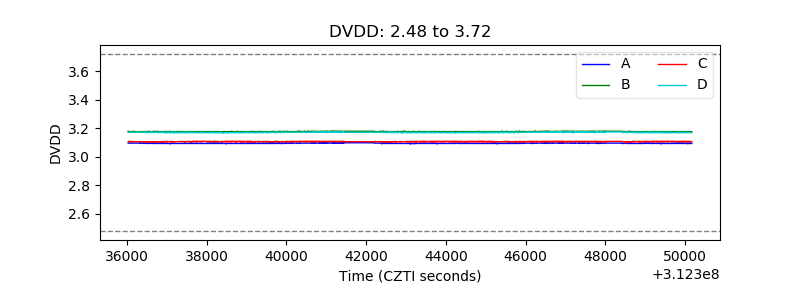 |
| Temperature 1 | 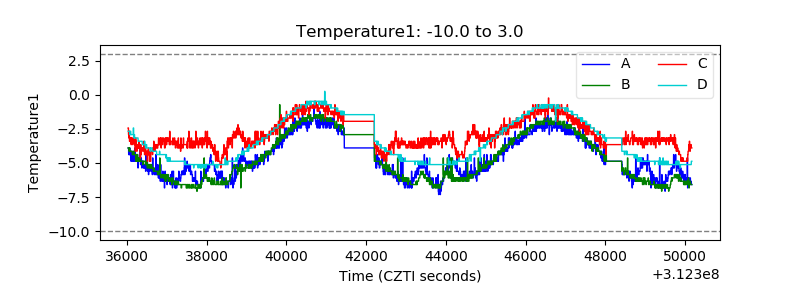 |
| Veto HV Monitor | 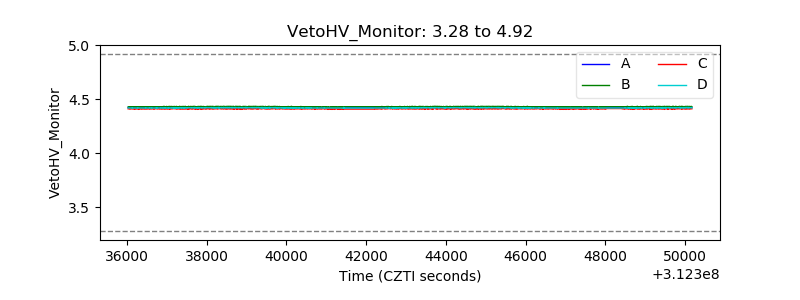 |
| Veto LLD | 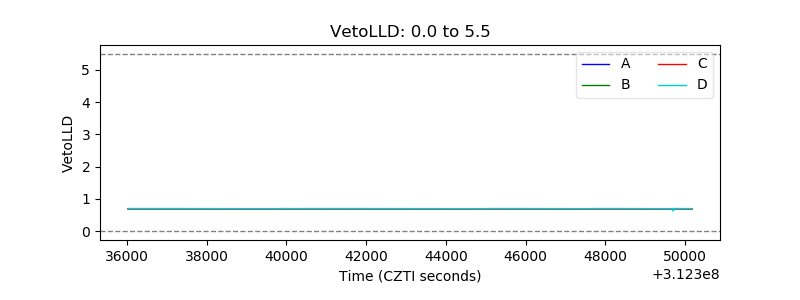 |
| Alpha Counter | 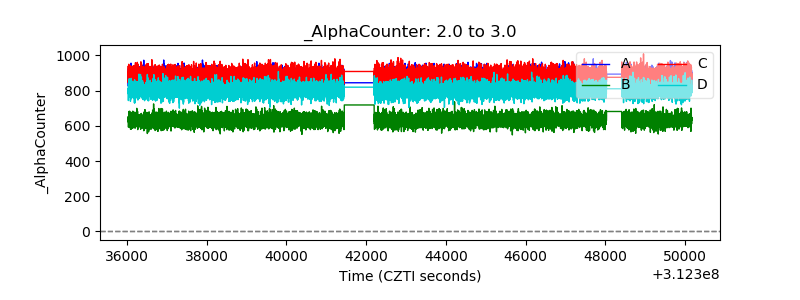 |
| _CPM_Rate | 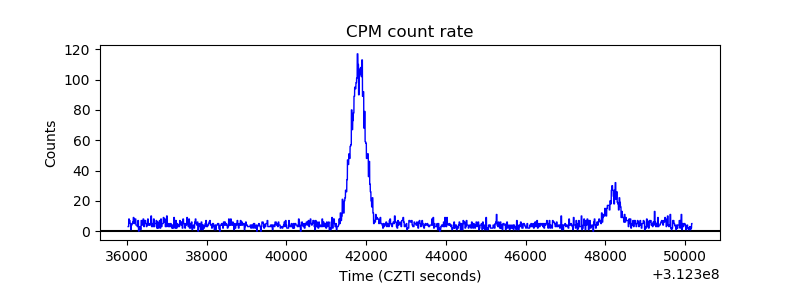 |
| CZT Counter |  |
| +2.5 Volts monitor |  |
| +5 Volts monitor |  |
| _ROLL_ROT | 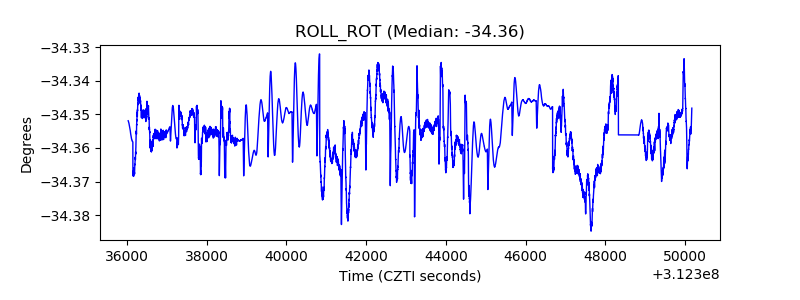 |
| _Roll_DEC | 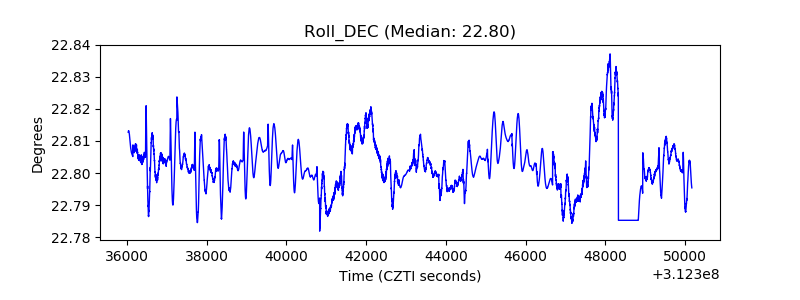 |
| _Roll_RA |  |
| Veto Counter | 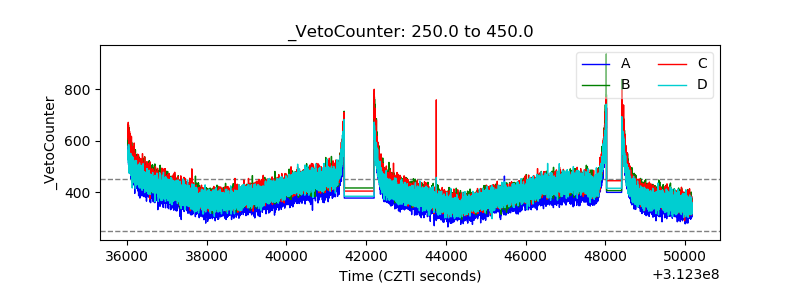 |