| Param | Original file | Final file |
|---|---|---|
| Filename | modeM0/AS1A07_144T02_9000003340_22487cztM0_level2.evt | modeM0/AS1A07_144T02_9000003340_22487cztM0_level2_quad_clean.evt |
| Size (bytes) | 1,179,429,120 | 178,064,640 |
| Size | 1.1 GB | 169.8 MB |
| Events in quadrant A | 8,379,136 | 1,402,267 |
| Events in quadrant B | 8,690,162 | 1,434,858 |
| Events in quadrant C | 2,598,192 | 258 |
| Events in quadrant D | 14,814,827 | 1,307,406 |
| Mode M9 | |||
|---|---|---|---|
| Quadrant | BADHDUFLAG | Total packets | Discarded packets |
| A | 0 | 17 | 0 |
| B | 0 | 17 | 0 |
| C | 0 | 17 | 0 |
| D | 0 | 17 | 0 |
| Mode SS | |||
|---|---|---|---|
| Quadrant | BADHDUFLAG | Total packets | Discarded packets |
| A | 0 | 364 | 0 |
| B | 0 | 364 | 0 |
| C | 0 | 364 | 0 |
| D | 0 | 364 | 0 |
| Mode M0 | |||
|---|---|---|---|
| Quadrant | BADHDUFLAG | Total packets | Discarded packets |
| A | 0 | 36765 | 3 |
| B | 0 | 37469 | 3 |
| C | 0 | 18032 | 3 |
| D | 0 | 56583 | 3 |
| Quadrant | Total seconds | Saturated seconds | Saturation percentage |
|---|---|---|---|
| A | 18028 | 169 | 0.937431% |
| B | 18027 | 229 | 1.270317% |
| C | 18028 | 18028 | 100.000000% |
| D | 18028 | 1310 | 7.266474% |
Noise dominated data is calculated using 1-second bins in cleaned event files. If a bin has >2000 counts, and if more than 50% of those come from <1% of pixels, then it is considered to be noise-dominated and hence unusable.
| Quadrant | # 1 sec bins | Bins with >0 counts | Bins with >2000 counts | High rate bins dominated by noise | Noise dominated (total time) | Noise dominated (detector-on time) | Marked lightcurve |
|---|---|---|---|---|---|---|---|
| A | 19658 | 18028 | 0 | 0 | 0.00% | 0.00% | 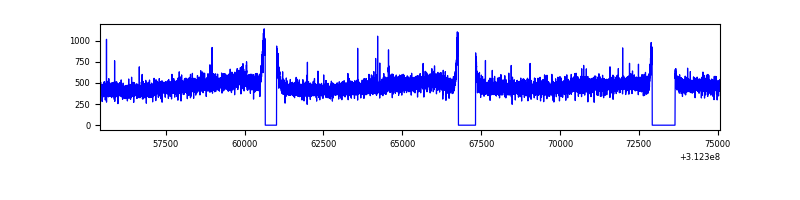 |
| B | 19657 | 18027 | 18 | 18 | 0.09% | 0.10% | 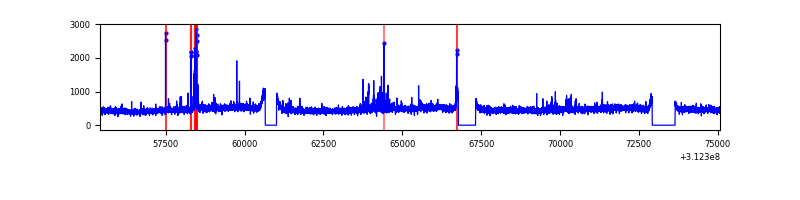 |
| C | 19657 | 18027 | 0 | 0 | 0.00% | 0.00% | 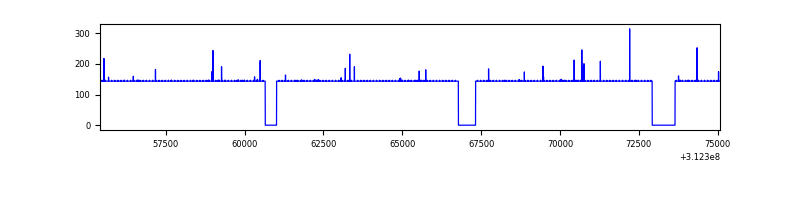 |
| D | 19658 | 18028 | 1133 | 1133 | 5.76% | 6.28% | 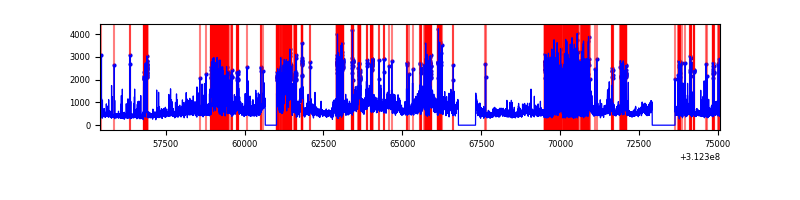 |
Top three noisy pixels from each quadrant. If the there are fewer than three noisy pixels in the level2.evt file, extra rows are filled as -1
| Pixel properties | Quadrant properties | ||||||
|---|---|---|---|---|---|---|---|
| Quadrant | DetID | PixID | Counts | Sigma | Mean | Median | Sigma |
| A | 13 | 254 | 25911 | 54.45 | 2168 | 2122 | 436.9 |
| A | 3 | 137 | 19212 | 39.11 | 2168 | 2122 | 436.9 |
| A | 6 | 240 | 18542 | 37.58 | 2168 | 2122 | 436.9 |
| B | 15 | 33 | 139677 | 331.33 | 2155 | 2096 | 415.2 |
| B | 0 | 190 | 55547 | 128.72 | 2155 | 2096 | 415.2 |
| B | 12 | 111 | 51606 | 119.23 | 2155 | 2096 | 415.2 |
| C | 7 | 119 | 2563334 | 822986.33 | 6 | 6 | 3.1 |
| C | 7 | 226 | 5366 | 1720.89 | 6 | 6 | 3.1 |
| C | 14 | 238 | 2750 | 880.99 | 6 | 6 | 3.1 |
| D | 1 | 52 | 4754932 | 9555.0 | 2050 | 1990 | 497.4 |
| D | 12 | 235 | 887985 | 1781.15 | 2050 | 1990 | 497.4 |
| D | 1 | 20 | 759379 | 1522.6 | 2050 | 1990 | 497.4 |
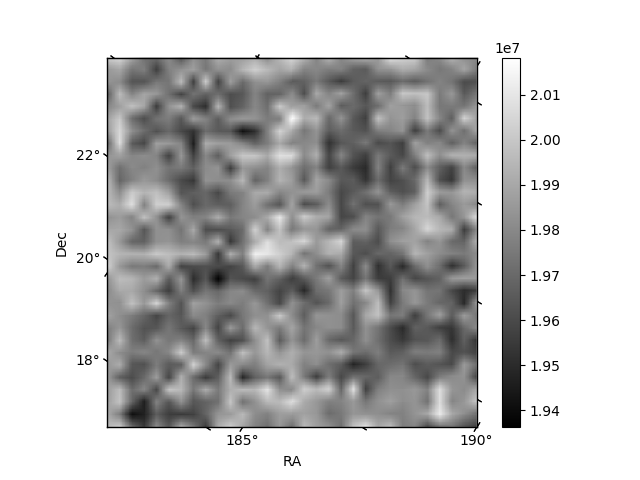
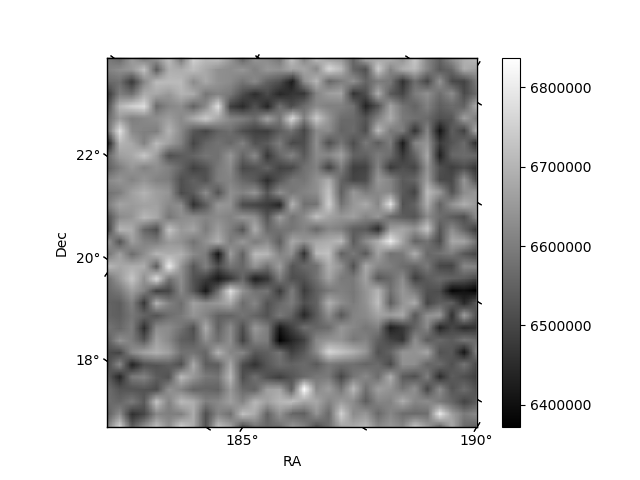
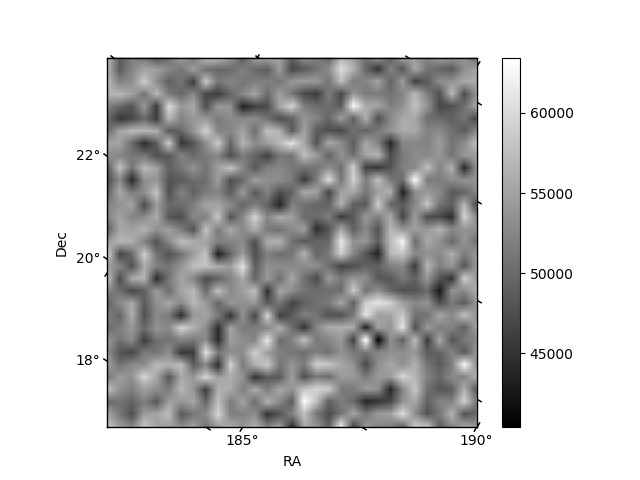
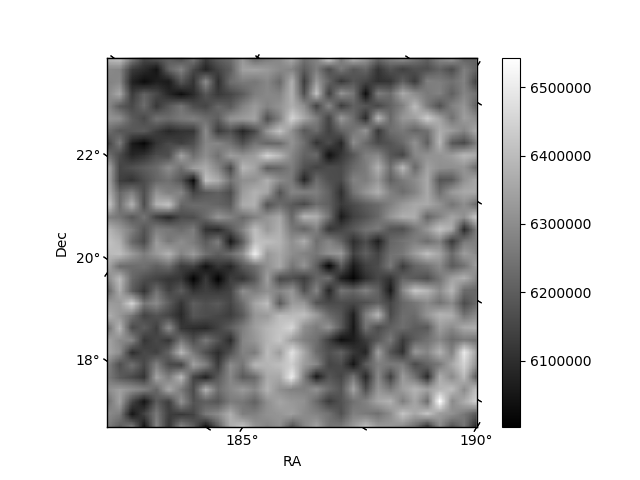
Histogram calculated using DETX and DETY for each event in the final _common_clean file
| Quadrant A | 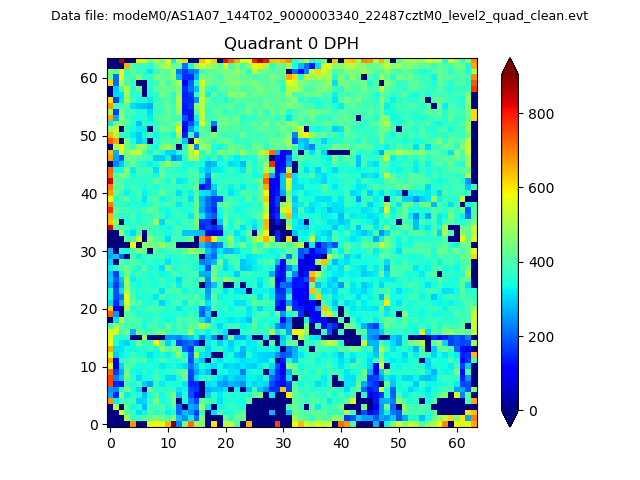 |
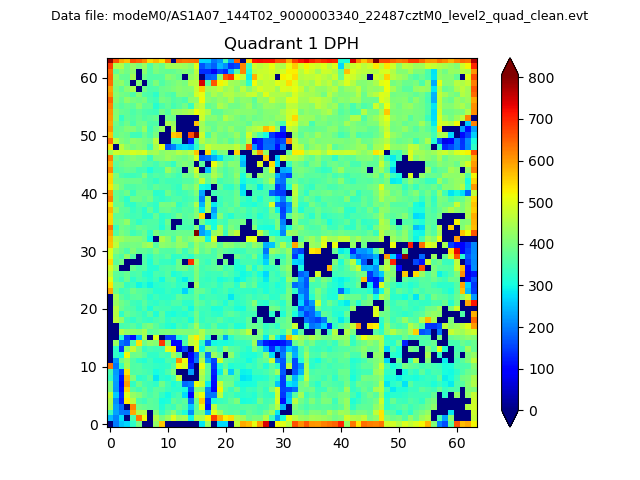 |
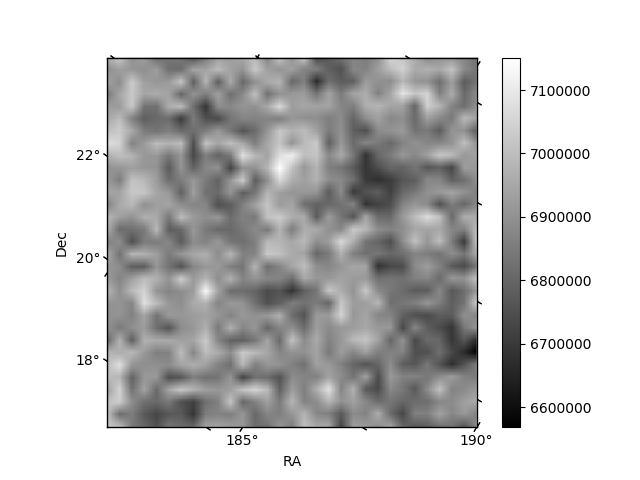
Quadrant B |
|---|---|---|---|
| Quadrant D | 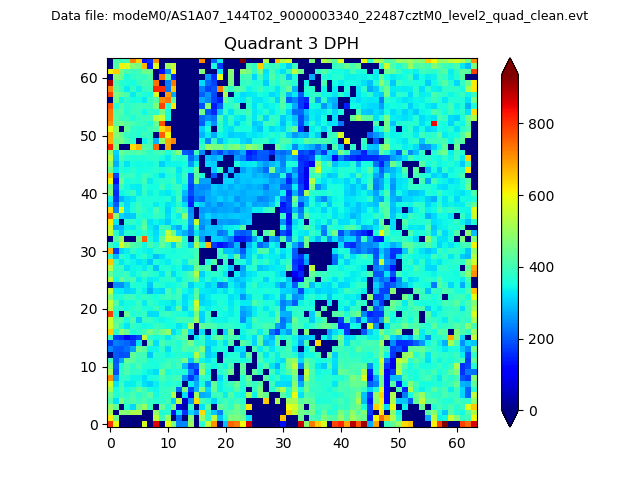 |
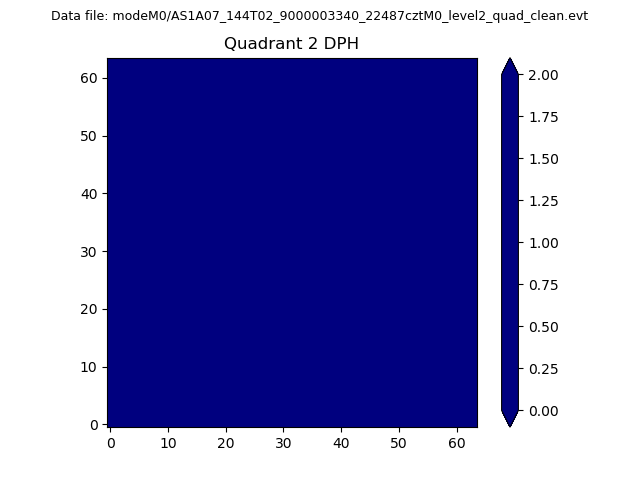 |
Quadrant C |
| Plot type | Count rate plots | Images |
|---|---|---|
| Comparison with Poisson distribution Blue bars denote a histogram of data divided into 1 sec bins. Red curve is a Poisson curve with rate = median count rate of data. |
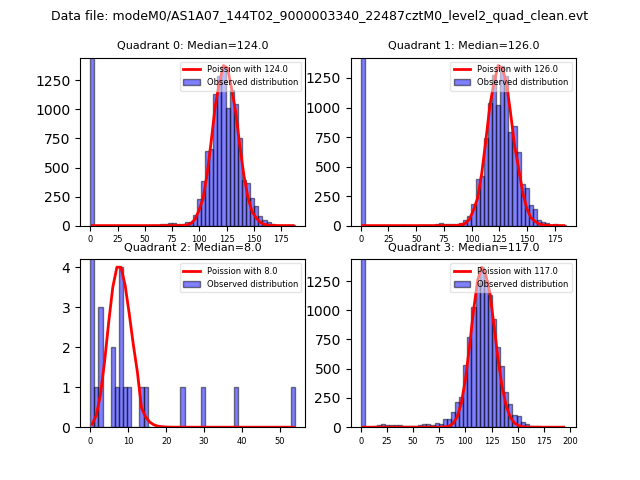 |
 |
| Quadrant-wise count rates Data is divided into 100 sec bins |
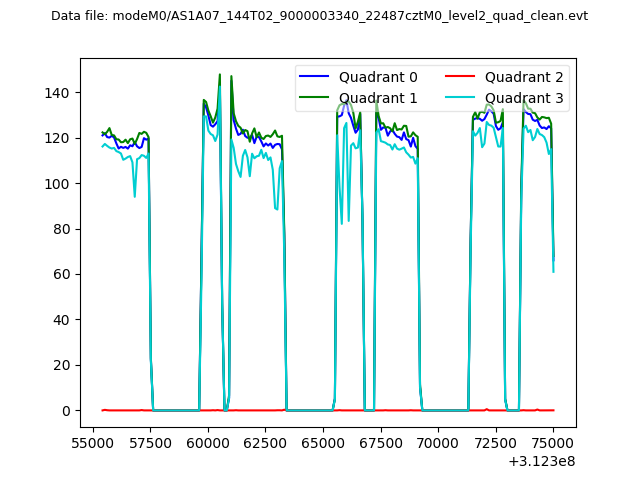 |
|
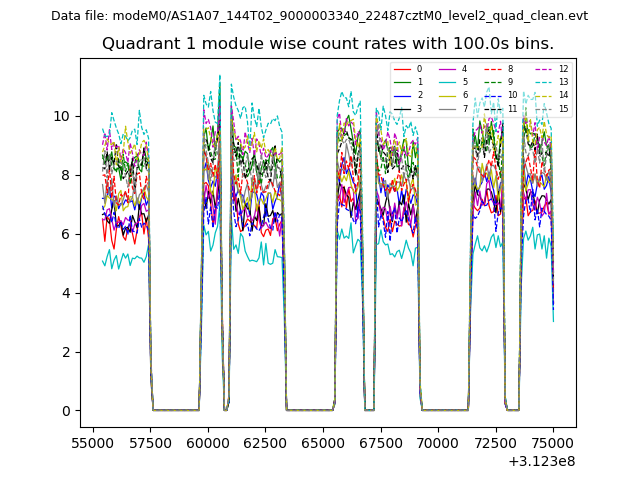
| Module-wise count rates for Quadrant A Data is divided into 100 sec bins |
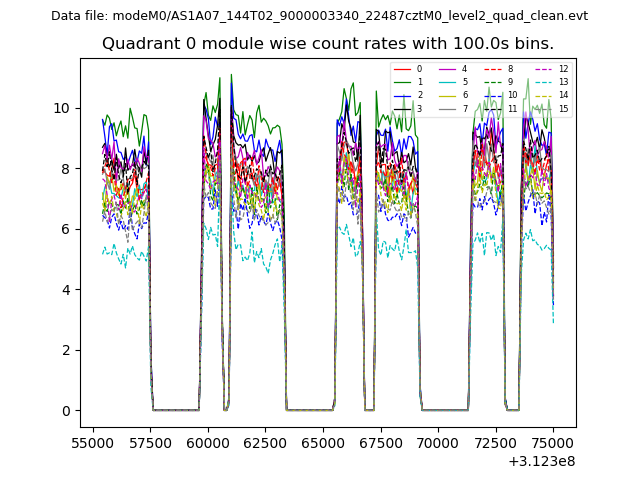 |
 |
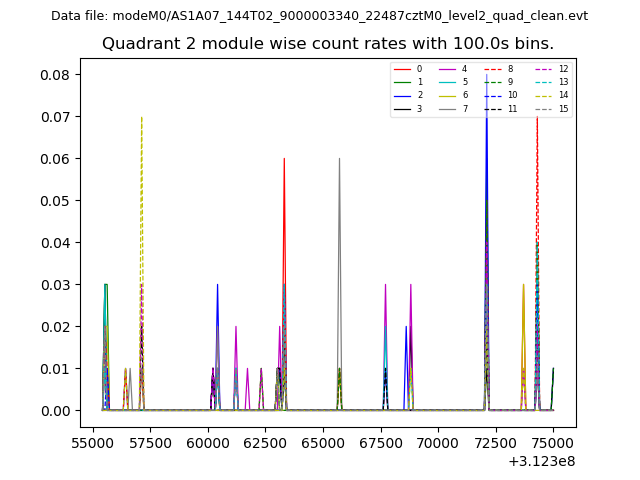
| Module-wise count rates for Quadrant B Data is divided into 100 sec bins |
 |
 |
| Module-wise count rates for Quadrant C Data is divided into 100 sec bins |
 |
 |
| Module-wise count rates for Quadrant D Data is divided into 100 sec bins |
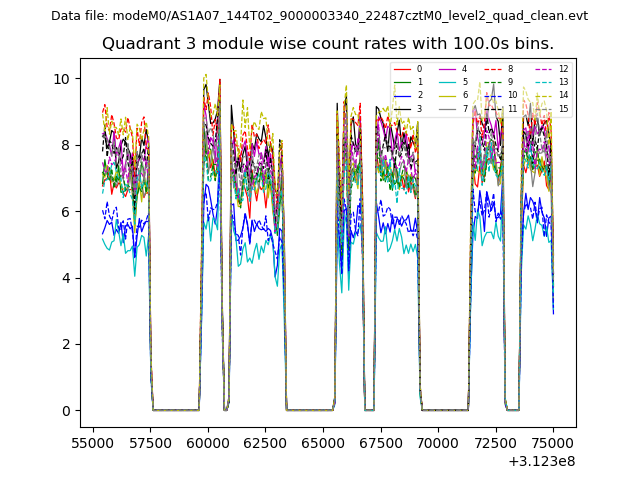 |
 |
| Parameter | Plot |
|---|---|
| CZT HV Monitor | 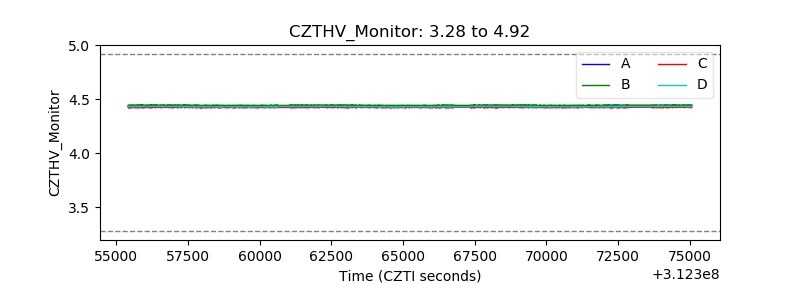 |
| D_VDD | 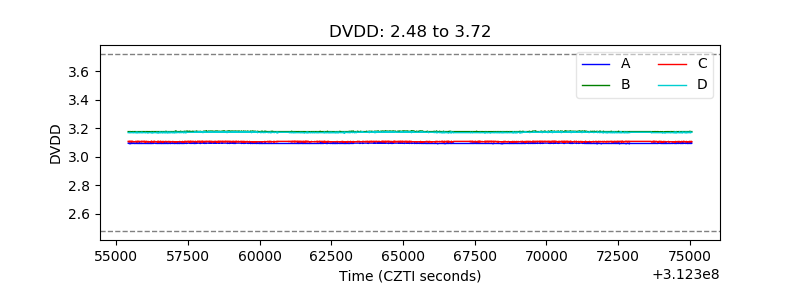 |
| Temperature 1 | 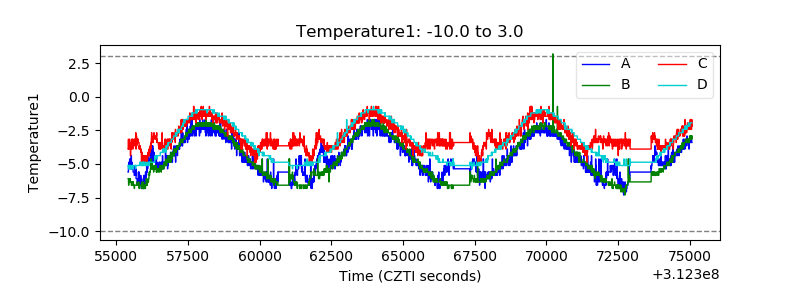 |
| Veto HV Monitor | 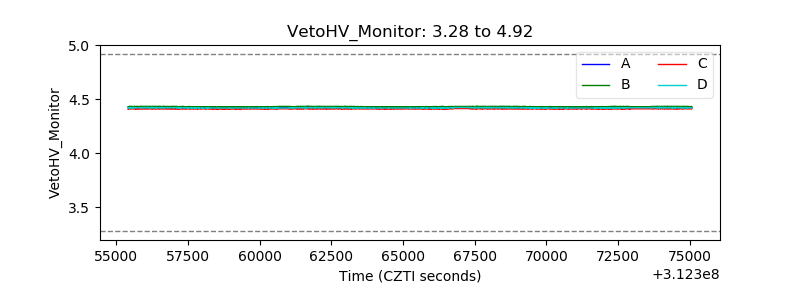 |
| Veto LLD | 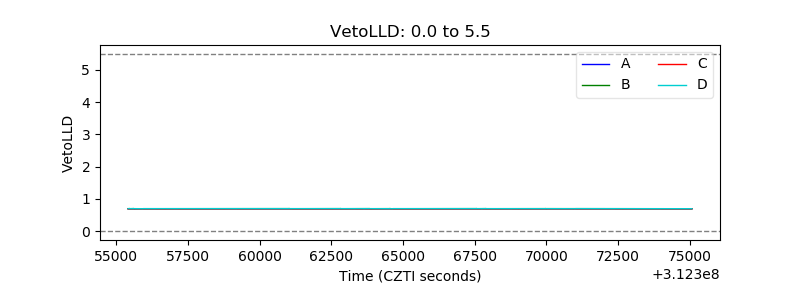 |
| Alpha Counter | 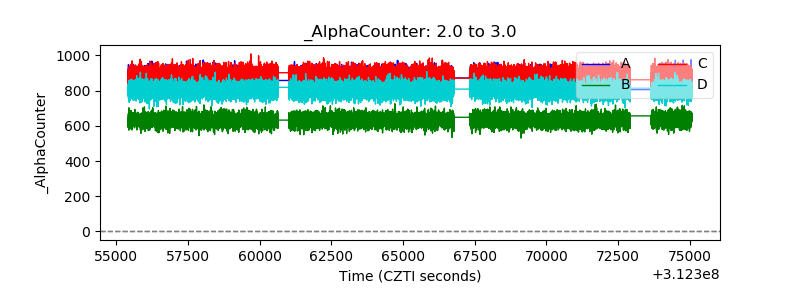 |
| _CPM_Rate | 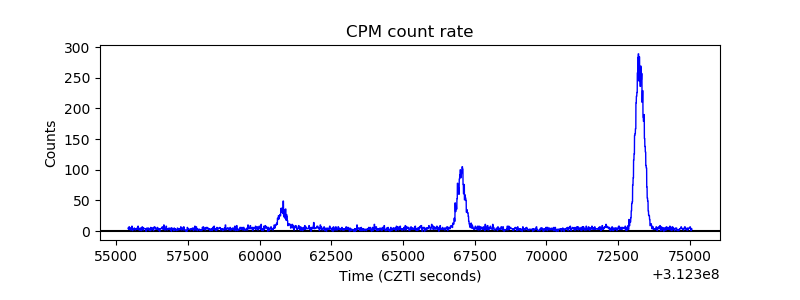 |
| CZT Counter | 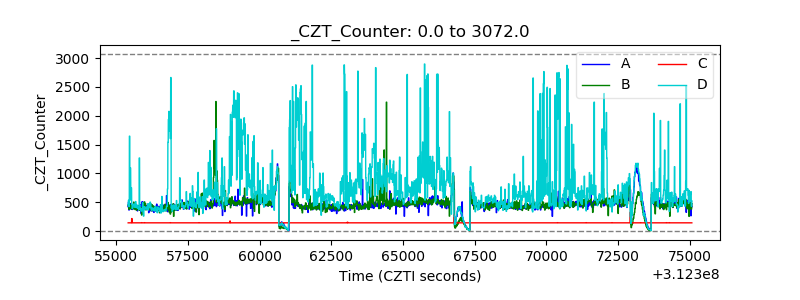 |
| +2.5 Volts monitor |  |
| +5 Volts monitor |  |
| _ROLL_ROT | 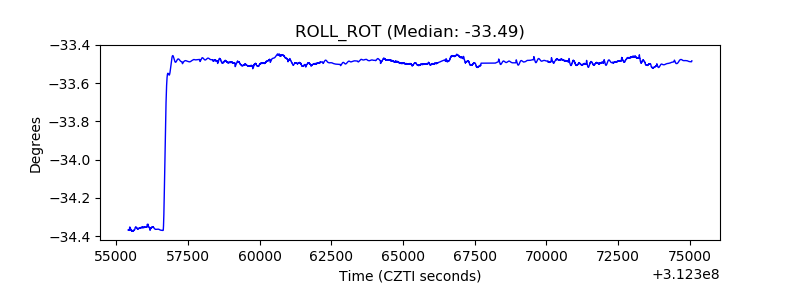 |
| _Roll_DEC | 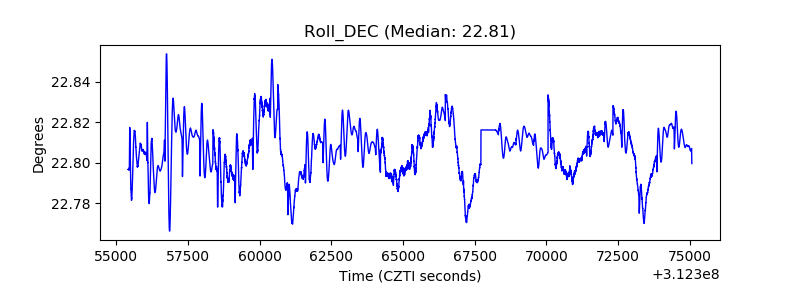 |
| _Roll_RA | 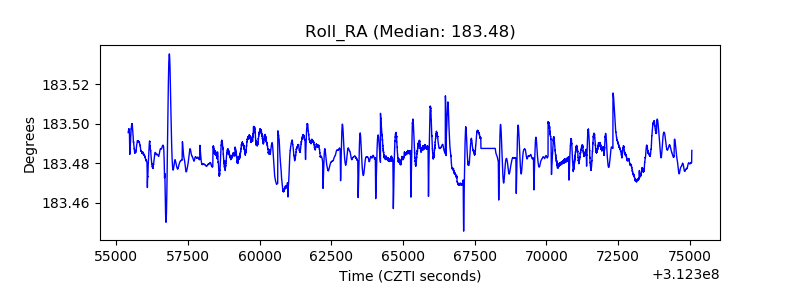 |
| Veto Counter | 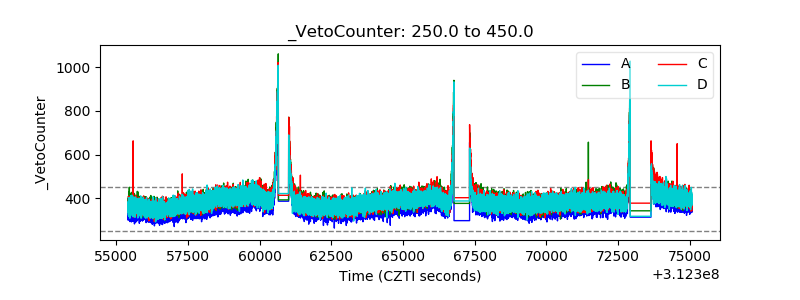 |