| Param | Original file | Final file |
|---|---|---|
| Filename | modeM0/AS1A07_144T02_9000003340_22489cztM0_level2.evt | modeM0/AS1A07_144T02_9000003340_22489cztM0_level2_quad_clean.evt |
| Size (bytes) | 326,773,440 | 49,328,640 |
| Size | 311.6 MB | 47.0 MB |
| Events in quadrant A | 2,780,981 | 366,257 |
| Events in quadrant B | 2,853,584 | 374,787 |
| Events in quadrant C | 819,784 | 42 |
| Events in quadrant D | 3,048,346 | 352,936 |
| Mode M9 | |||
|---|---|---|---|
| Quadrant | BADHDUFLAG | Total packets | Discarded packets |
| A | 0 | 13 | 0 |
| B | 0 | 14 | 0 |
| C | 0 | 14 | 0 |
| D | 0 | 14 | 0 |
| Mode SS | |||
|---|---|---|---|
| Quadrant | BADHDUFLAG | Total packets | Discarded packets |
| A | 0 | 116 | 0 |
| B | 0 | 119 | 3 |
| C | 0 | 117 | 1 |
| D | 0 | 117 | 1 |
| Mode M0 | |||
|---|---|---|---|
| Quadrant | BADHDUFLAG | Total packets | Discarded packets |
| A | 0 | 12043 | 182 |
| B | 0 | 12208 | 199 |
| C | 0 | 5752 | 62 |
| D | 0 | 13025 | 195 |
| Quadrant | Total seconds | Saturated seconds | Saturation percentage |
|---|---|---|---|
| A | 5687 | 61 | 1.072622% |
| B | 5689 | 60 | 1.054667% |
| C | 5690 | 5690 | 100.000000% |
| D | 5686 | 87 | 1.530074% |
Noise dominated data is calculated using 1-second bins in cleaned event files. If a bin has >2000 counts, and if more than 50% of those come from <1% of pixels, then it is considered to be noise-dominated and hence unusable.
| Quadrant | # 1 sec bins | Bins with >0 counts | Bins with >2000 counts | High rate bins dominated by noise | Noise dominated (total time) | Noise dominated (detector-on time) | Marked lightcurve |
|---|---|---|---|---|---|---|---|
| A | 7621 | 5688 | 0 | 0 | 0.00% | 0.00% | 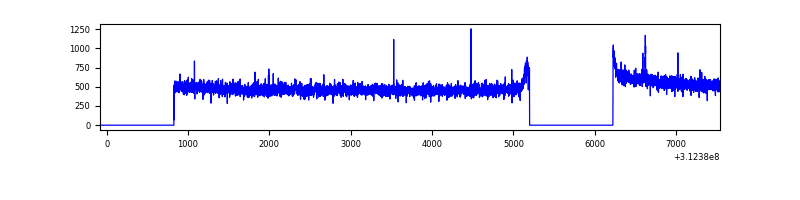 |
| B | 7621 | 5691 | 1 | 1 | 0.01% | 0.02% | 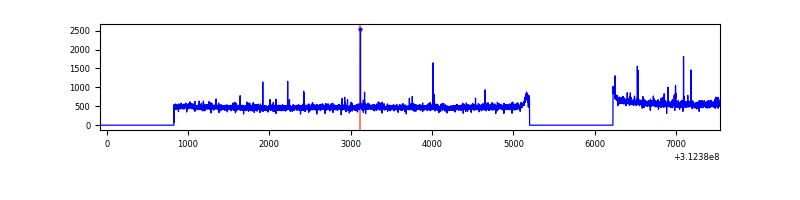 |
| C | 7620 | 5689 | 0 | 0 | 0.00% | 0.00% | 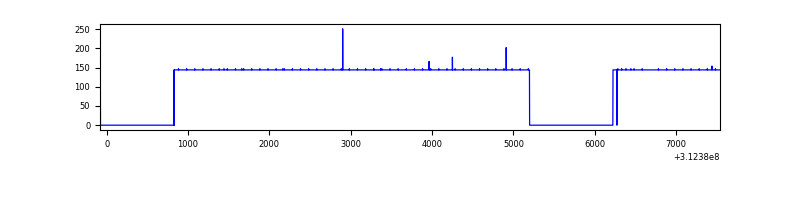 |
| D | 6713 | 5688 | 36 | 36 | 0.54% | 0.63% | 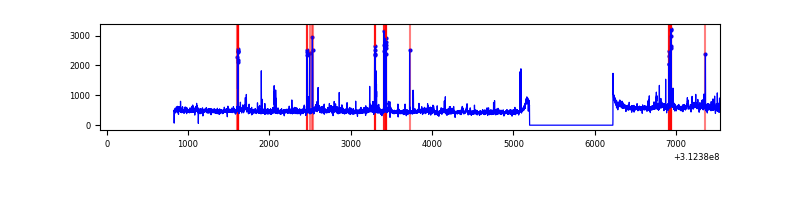 |
Top three noisy pixels from each quadrant. If the there are fewer than three noisy pixels in the level2.evt file, extra rows are filled as -1
| Pixel properties | Quadrant properties | ||||||
|---|---|---|---|---|---|---|---|
| Quadrant | DetID | PixID | Counts | Sigma | Mean | Median | Sigma |
| A | 3 | 1 | 14538 | 96.19 | 717 | 702 | 143.8 |
| A | 13 | 254 | 8779 | 56.15 | 717 | 702 | 143.8 |
| A | 0 | 226 | 6231 | 38.44 | 717 | 702 | 143.8 |
| B | 0 | 245 | 17032 | 119.26 | 713 | 695 | 137.0 |
| B | 12 | 111 | 16292 | 113.86 | 713 | 695 | 137.0 |
| B | 11 | 111 | 14867 | 103.46 | 713 | 695 | 137.0 |
| C | 7 | 119 | 808812 | 655374.88 | 2 | 2 | 1.2 |
| C | 7 | 226 | 1696 | 1372.64 | 2 | 2 | 1.2 |
| C | 14 | 238 | 961 | 777.07 | 2 | 2 | 1.2 |
| D | 1 | 52 | 222366 | 1286.79 | 700 | 680 | 172.3 |
| D | 9 | 85 | 71334 | 410.12 | 700 | 680 | 172.3 |
| D | 1 | 20 | 43093 | 246.19 | 700 | 680 | 172.3 |
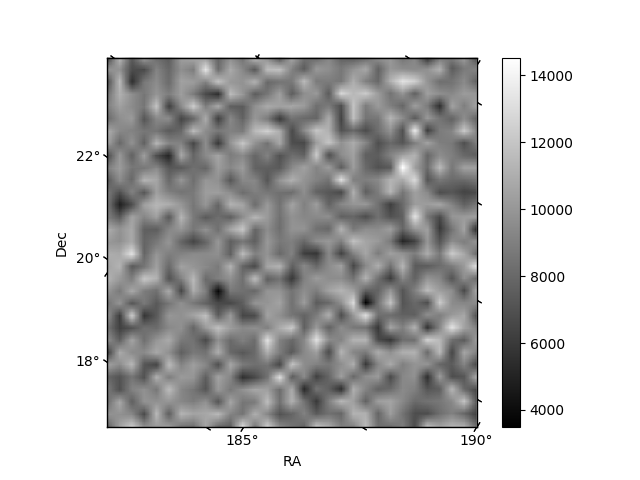
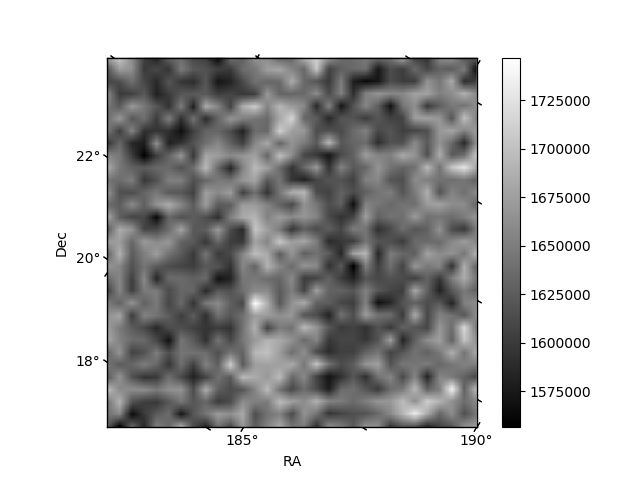
Histogram calculated using DETX and DETY for each event in the final _common_clean file
| Quadrant A | 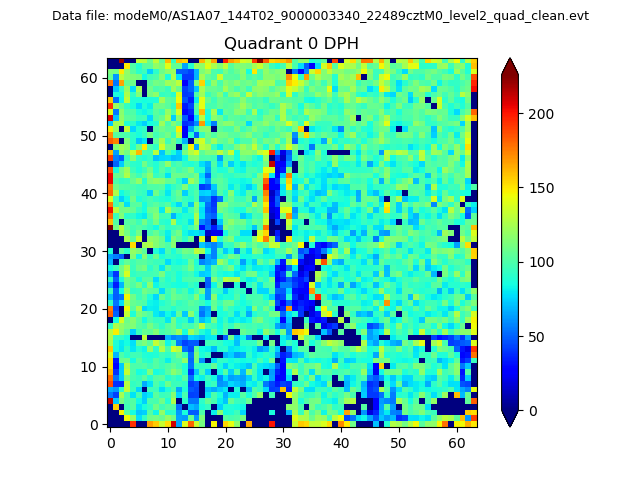 |
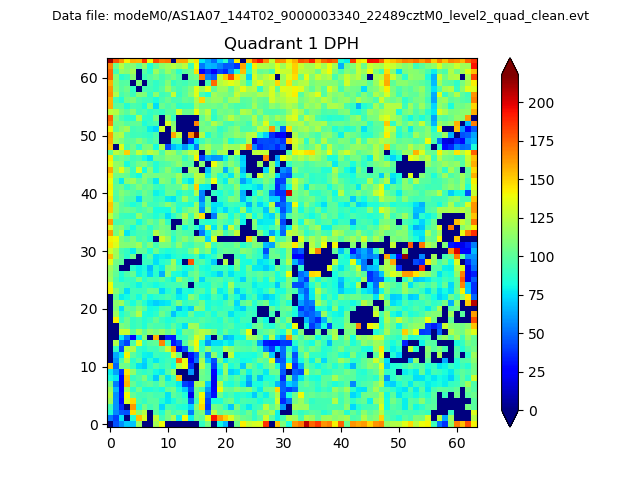 |
Quadrant B |
|---|---|---|---|
| Quadrant D | 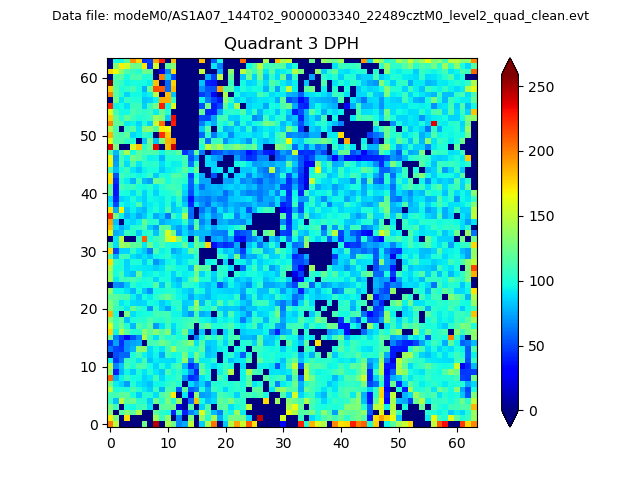 |
 |
Quadrant C |
| Plot type | Count rate plots | Images |
|---|---|---|
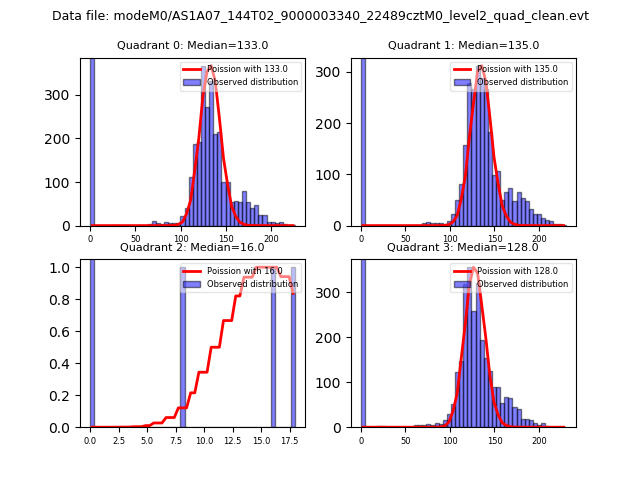
| Comparison with Poisson distribution Blue bars denote a histogram of data divided into 1 sec bins. Red curve is a Poisson curve with rate = median count rate of data. |
 |
 |
| Quadrant-wise count rates Data is divided into 100 sec bins |
 |
|
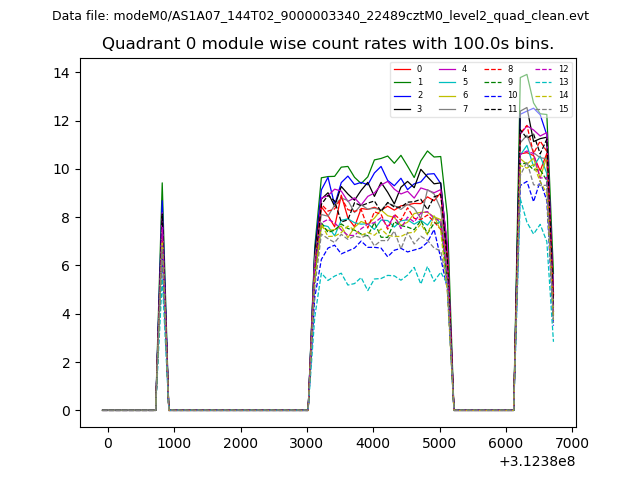
| Module-wise count rates for Quadrant A Data is divided into 100 sec bins |
 |
 |
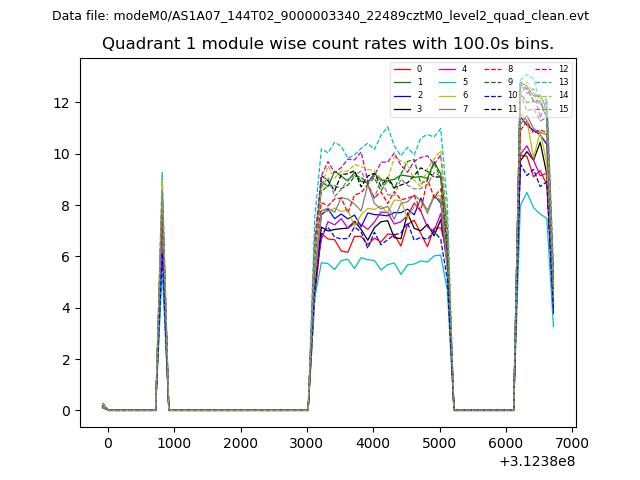
| Module-wise count rates for Quadrant B Data is divided into 100 sec bins |
 |
 |
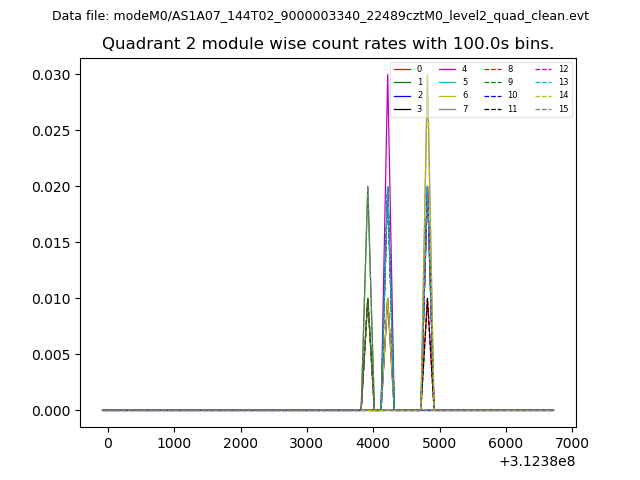
| Module-wise count rates for Quadrant C Data is divided into 100 sec bins |
 |
 |
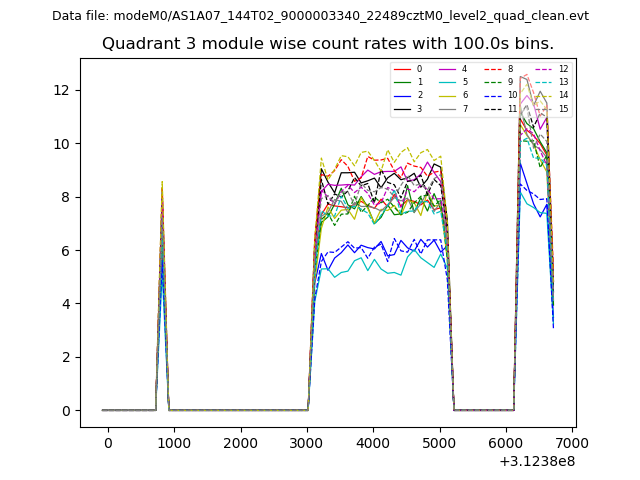
| Module-wise count rates for Quadrant D Data is divided into 100 sec bins |
 |
 |
| Parameter | Plot |
|---|---|
| CZT HV Monitor | 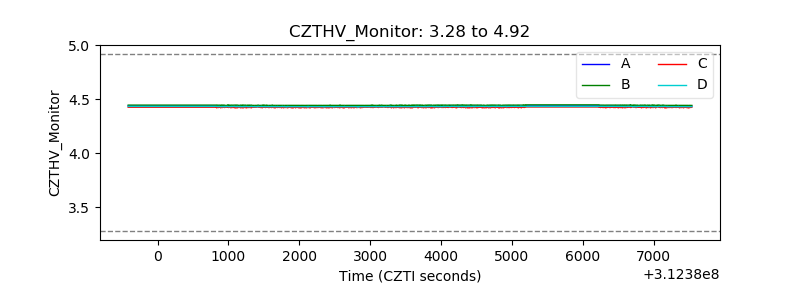 |
| D_VDD | 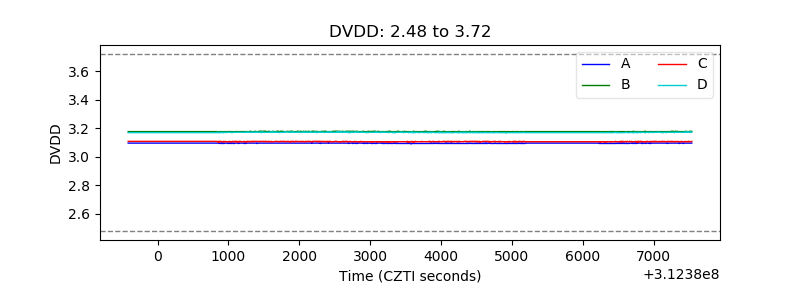 |
| Temperature 1 | 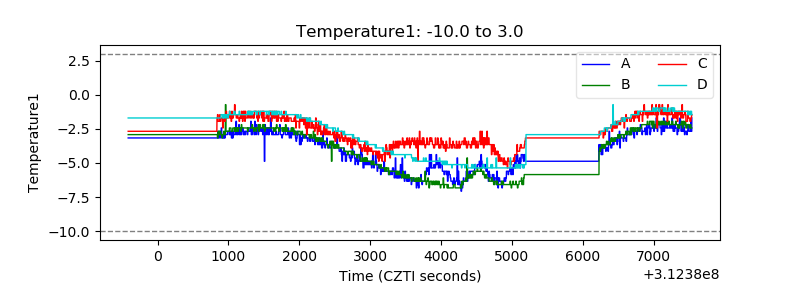 |
| Veto HV Monitor | 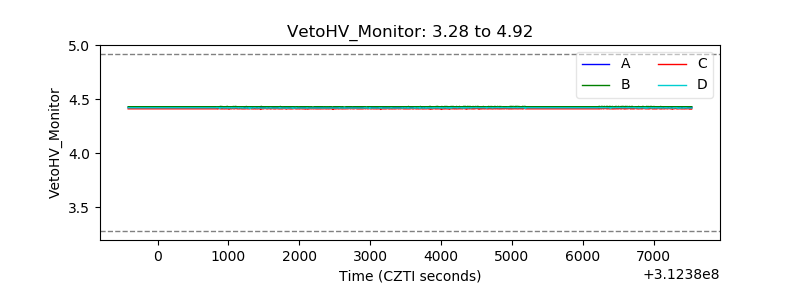 |
| Veto LLD | 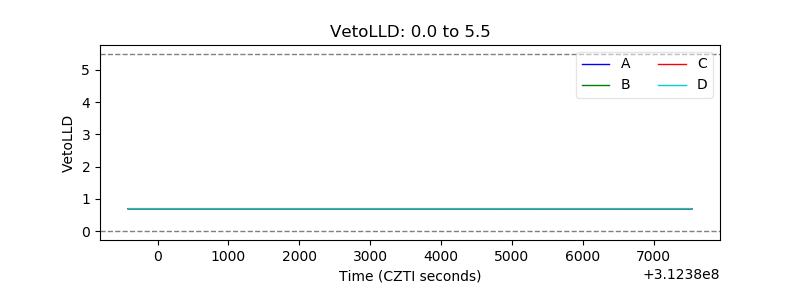 |
| Alpha Counter | 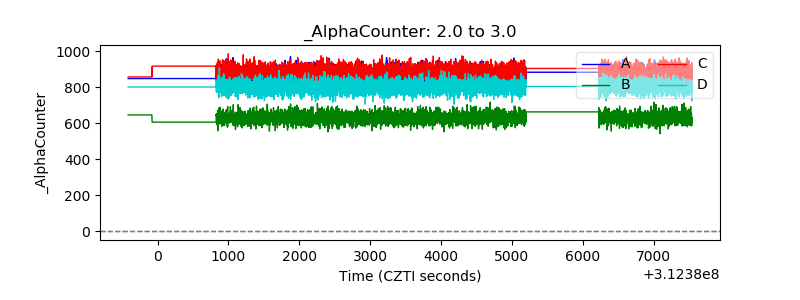 |
| _CPM_Rate | 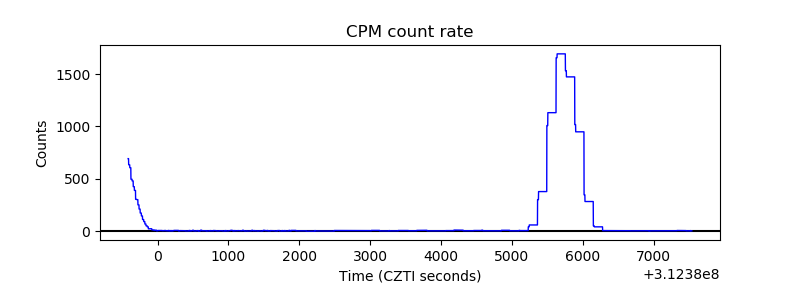 |
| CZT Counter |  |
| +2.5 Volts monitor |  |
| +5 Volts monitor |  |
| _ROLL_ROT | 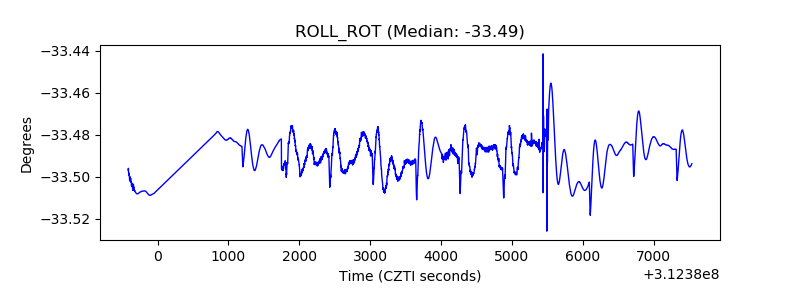 |
| _Roll_DEC | 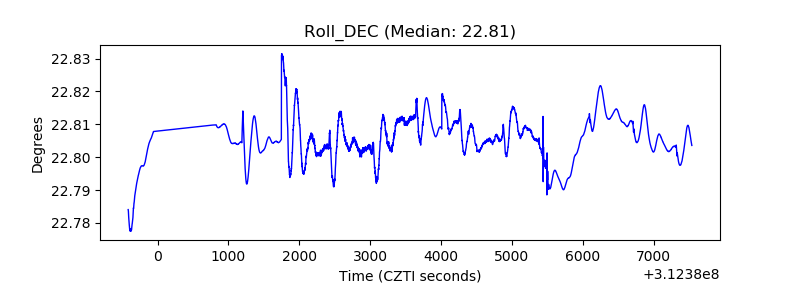 |
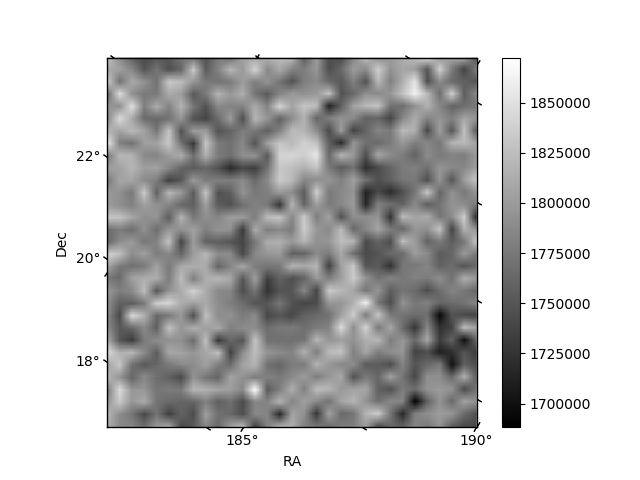
| _Roll_RA | 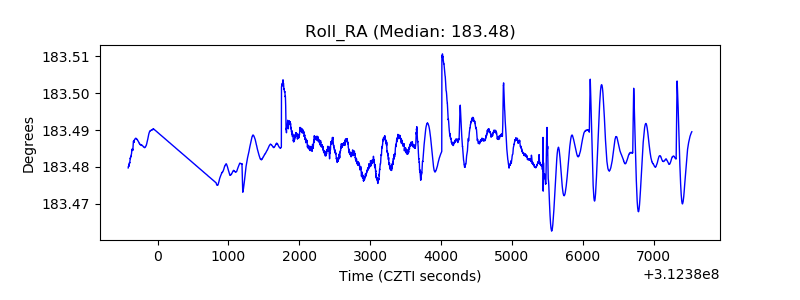 |
| Veto Counter | 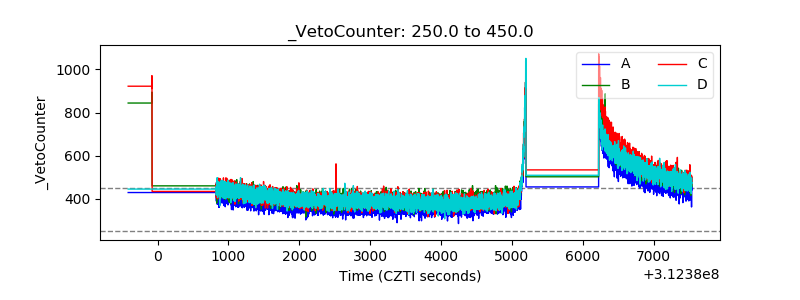 |