| Param | Original file | Final file |
|---|---|---|
| Filename | modeM0/AS1A07_144T02_9000003340_22491cztM0_level2.evt | modeM0/AS1A07_144T02_9000003340_22491cztM0_level2_quad_clean.evt |
| Size (bytes) | 672,655,680 | 99,815,040 |
| Size | 641.5 MB | 95.2 MB |
| Events in quadrant A | 5,616,687 | 751,467 |
| Events in quadrant B | 5,869,156 | 767,096 |
| Events in quadrant C | 1,625,725 | 81 |
| Events in quadrant D | 6,483,332 | 720,403 |
| Mode M9 | |||
|---|---|---|---|
| Quadrant | BADHDUFLAG | Total packets | Discarded packets |
| A | 0 | 22 | 0 |
| B | 0 | 22 | 0 |
| C | 0 | 22 | 0 |
| D | 0 | 22 | 0 |
| Mode SS | |||
|---|---|---|---|
| Quadrant | BADHDUFLAG | Total packets | Discarded packets |
| A | 0 | 230 | 0 |
| B | 0 | 230 | 0 |
| C | 0 | 230 | 0 |
| D | 0 | 230 | 0 |
| Mode M0 | |||
|---|---|---|---|
| Quadrant | BADHDUFLAG | Total packets | Discarded packets |
| A | 0 | 23827 | 5 |
| B | 0 | 24564 | 7 |
| C | 0 | 11285 | 3 |
| D | 0 | 26586 | 21 |
| Quadrant | Total seconds | Saturated seconds | Saturation percentage |
|---|---|---|---|
| A | 11283 | 126 | 1.116724% |
| B | 11282 | 137 | 1.214324% |
| C | 11281 | 11281 | 100.000000% |
| D | 11275 | 206 | 1.827051% |
Noise dominated data is calculated using 1-second bins in cleaned event files. If a bin has >2000 counts, and if more than 50% of those come from <1% of pixels, then it is considered to be noise-dominated and hence unusable.
| Quadrant | # 1 sec bins | Bins with >0 counts | Bins with >2000 counts | High rate bins dominated by noise | Noise dominated (total time) | Noise dominated (detector-on time) | Marked lightcurve |
|---|---|---|---|---|---|---|---|
| A | 13455 | 11285 | 0 | 0 | 0.00% | 0.00% | 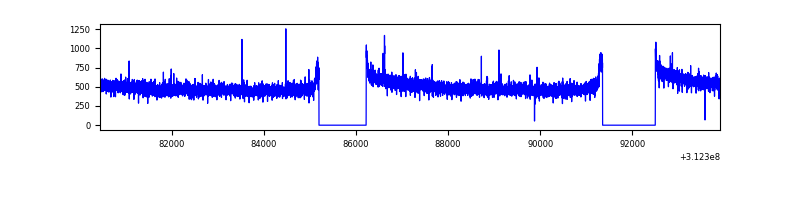 |
| B | 13455 | 11284 | 1 | 1 | 0.01% | 0.01% | 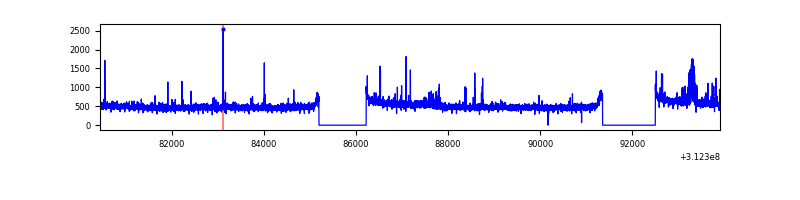 |
| C | 13453 | 11280 | 0 | 0 | 0.00% | 0.00% | 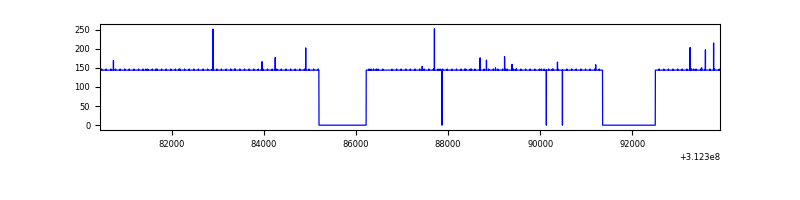 |
| D | 13454 | 11282 | 89 | 89 | 0.66% | 0.79% | 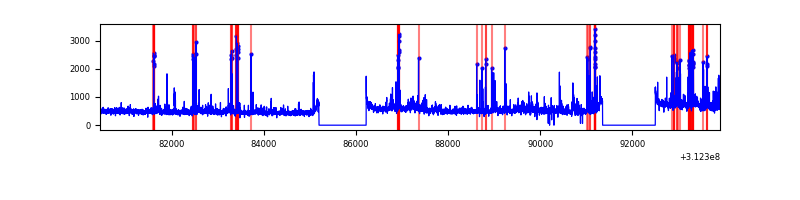 |
Top three noisy pixels from each quadrant. If the there are fewer than three noisy pixels in the level2.evt file, extra rows are filled as -1
| Pixel properties | Quadrant properties | ||||||
|---|---|---|---|---|---|---|---|
| Quadrant | DetID | PixID | Counts | Sigma | Mean | Median | Sigma |
| A | 3 | 1 | 17762 | 56.34 | 1453 | 1422 | 290.0 |
| A | 13 | 254 | 16965 | 53.59 | 1453 | 1422 | 290.0 |
| A | 0 | 226 | 12638 | 38.67 | 1453 | 1422 | 290.0 |
| B | 15 | 33 | 90173 | 327.38 | 1441 | 1404 | 271.1 |
| B | 0 | 190 | 65226 | 235.38 | 1441 | 1404 | 271.1 |
| B | 12 | 111 | 32530 | 114.79 | 1441 | 1404 | 271.1 |
| C | 7 | 119 | 1603373 | 726916.11 | 4 | 4 | 2.2 |
| C | 7 | 226 | 3404 | 1541.45 | 4 | 4 | 2.2 |
| C | 14 | 238 | 1955 | 884.52 | 4 | 4 | 2.2 |
| D | 1 | 52 | 612652 | 1771.08 | 1419 | 1380 | 345.1 |
| D | 1 | 20 | 188748 | 542.87 | 1419 | 1380 | 345.1 |
| D | 7 | 223 | 171184 | 491.98 | 1419 | 1380 | 345.1 |
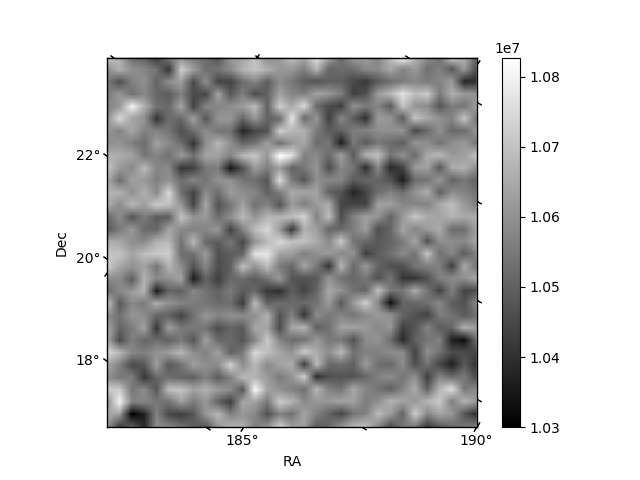
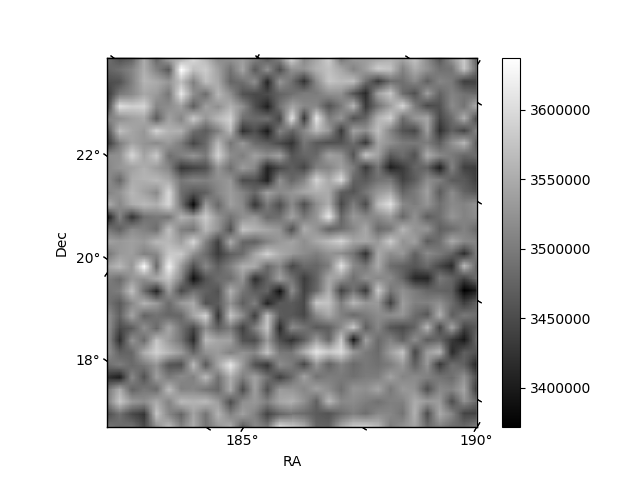
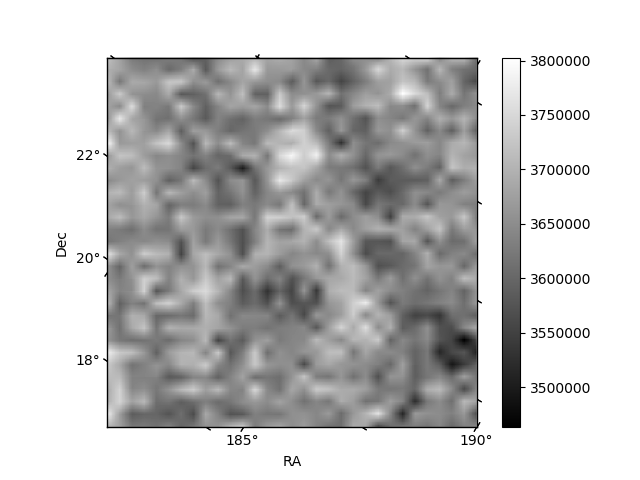
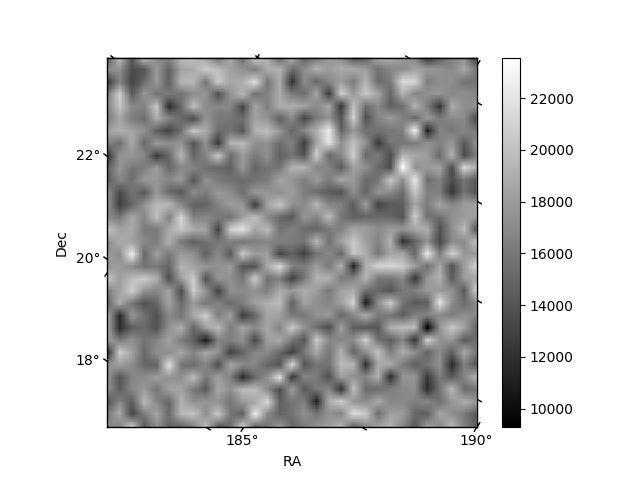
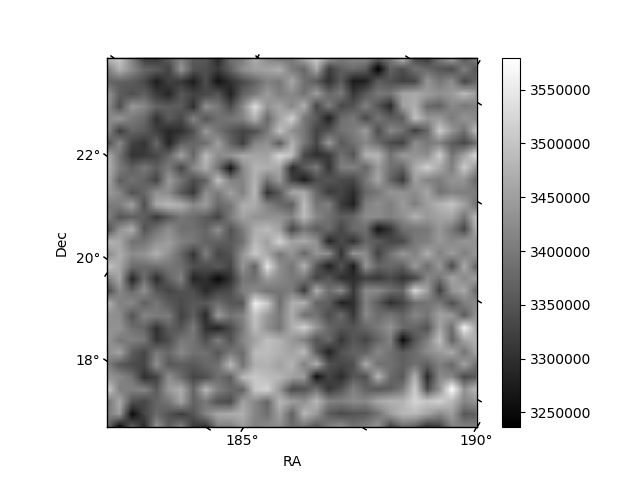
Histogram calculated using DETX and DETY for each event in the final _common_clean file
| Quadrant A | 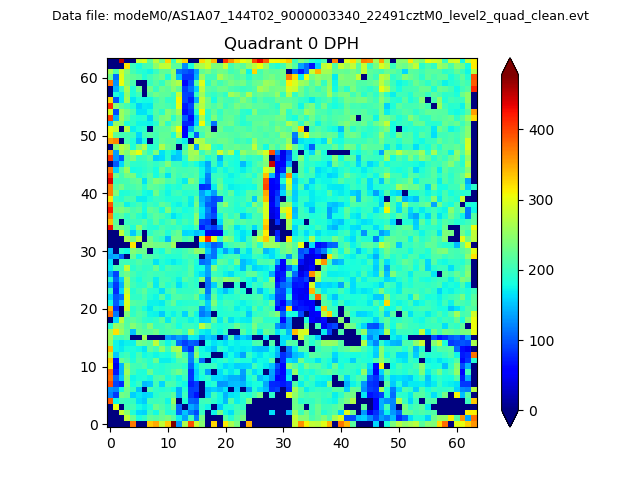 |
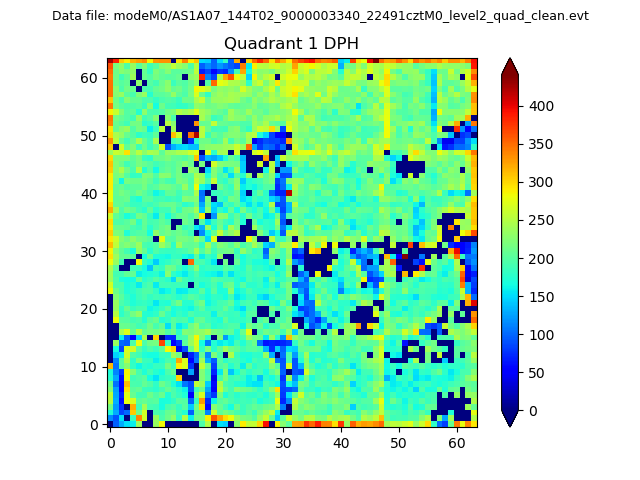 |
Quadrant B |
|---|---|---|---|
| Quadrant D | 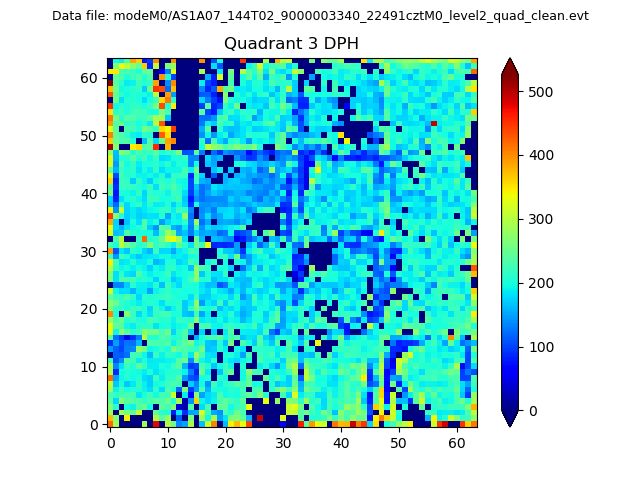 |
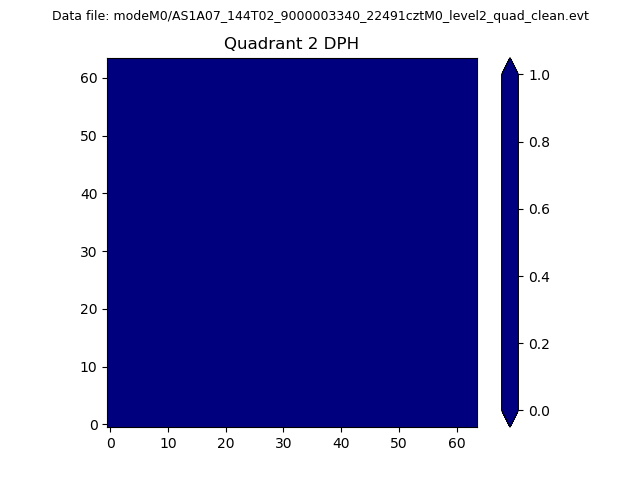 |
Quadrant C |
| Plot type | Count rate plots | Images |
|---|---|---|
| Comparison with Poisson distribution Blue bars denote a histogram of data divided into 1 sec bins. Red curve is a Poisson curve with rate = median count rate of data. |
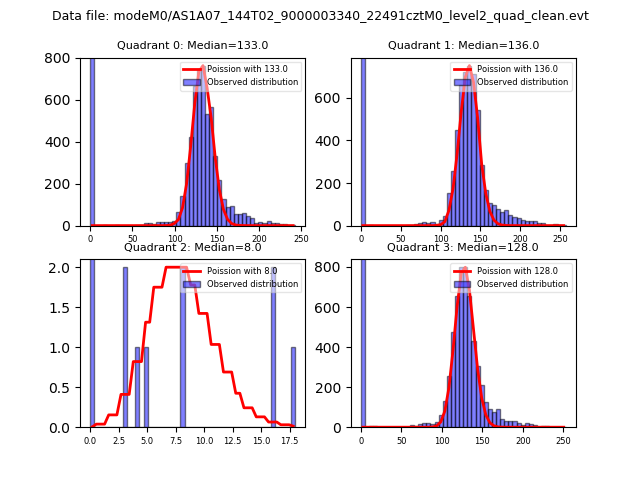 |
 |
| Quadrant-wise count rates Data is divided into 100 sec bins |
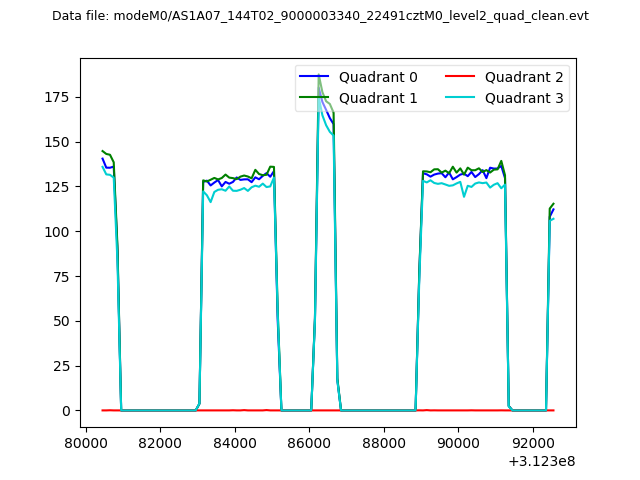 |
|
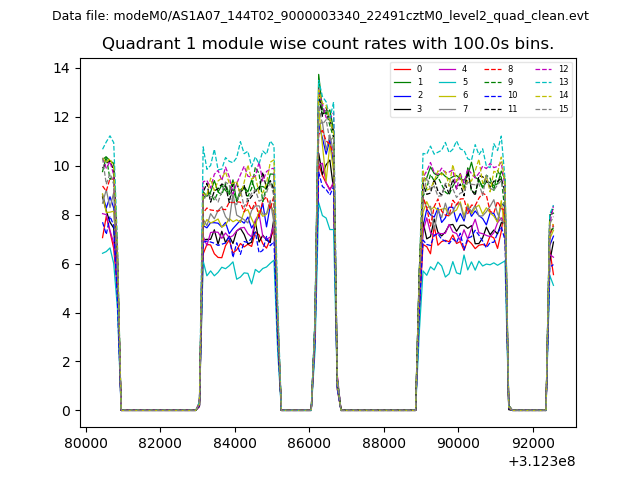
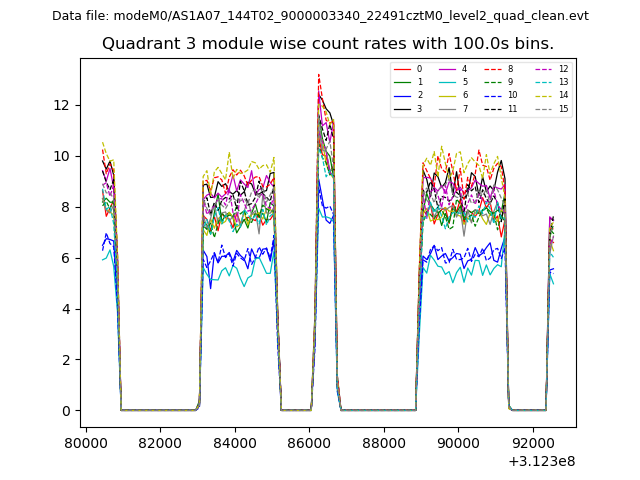
| Module-wise count rates for Quadrant A Data is divided into 100 sec bins |
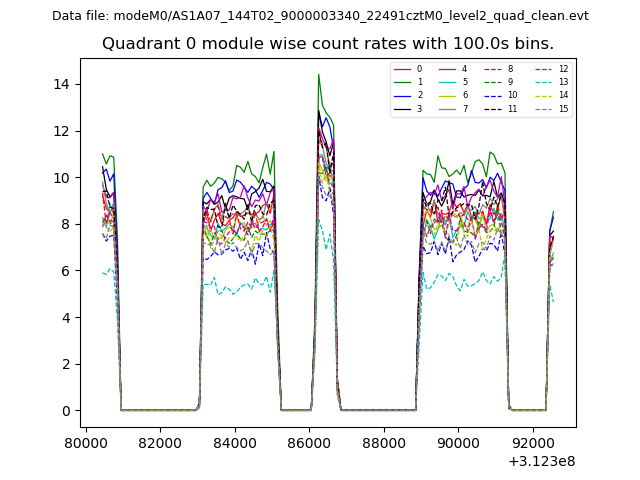 |
 |
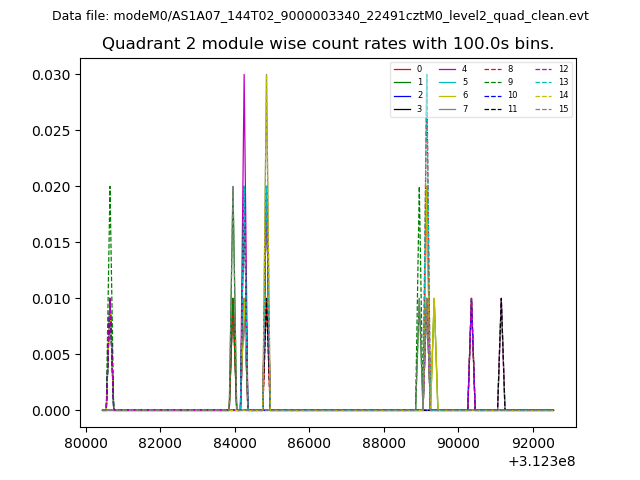
| Module-wise count rates for Quadrant B Data is divided into 100 sec bins |
 |
 |
| Module-wise count rates for Quadrant C Data is divided into 100 sec bins |
 |
 |
| Module-wise count rates for Quadrant D Data is divided into 100 sec bins |
 |
 |
| Parameter | Plot |
|---|---|
| CZT HV Monitor | 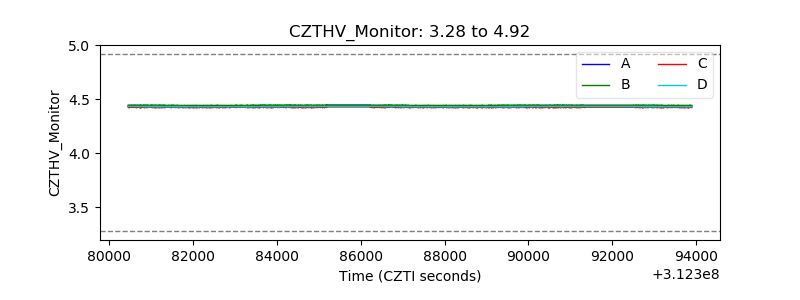 |
| D_VDD | 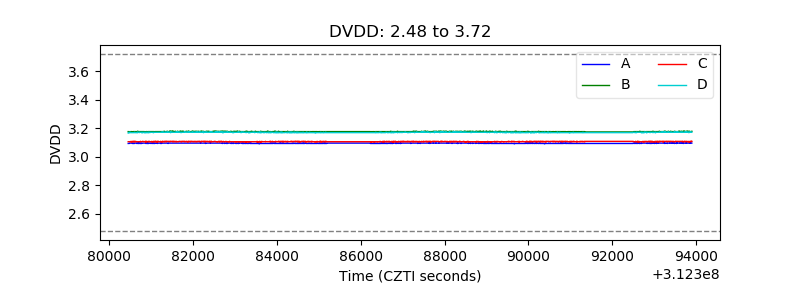 |
| Temperature 1 |  |
| Veto HV Monitor | 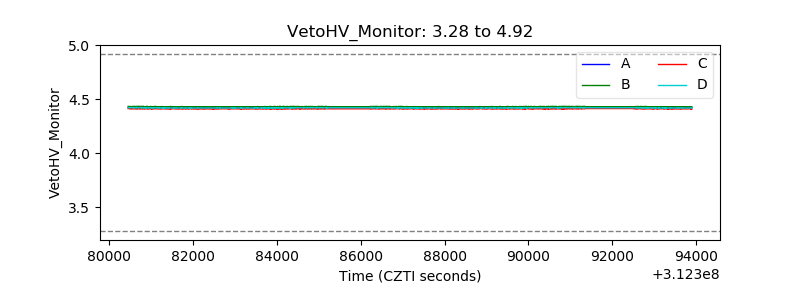 |
| Veto LLD | 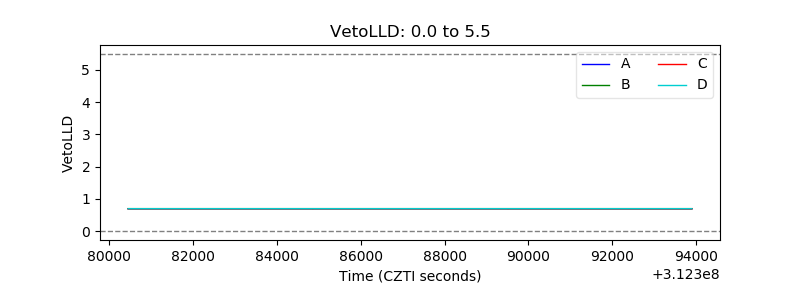 |
| Alpha Counter | 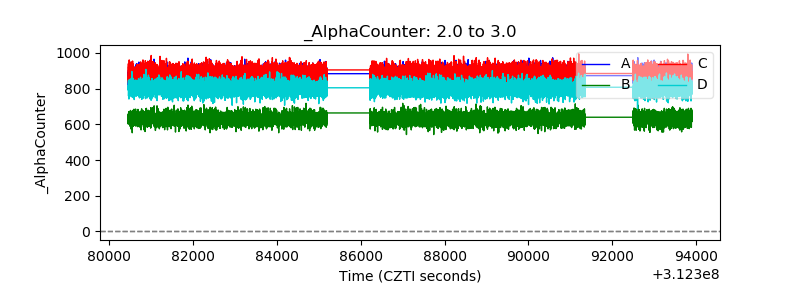 |
| _CPM_Rate | 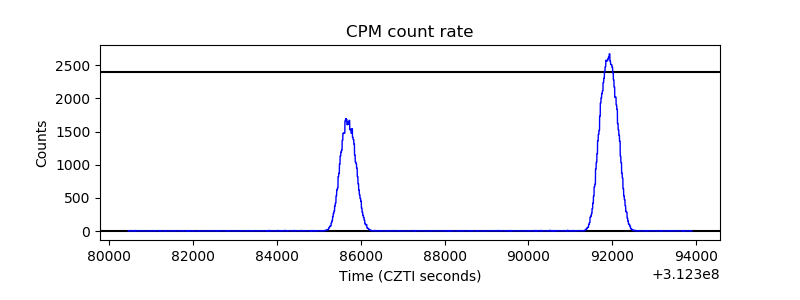 |
| CZT Counter | 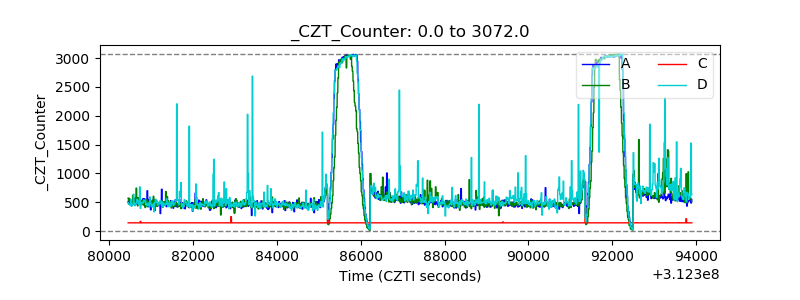 |
| +2.5 Volts monitor |  |
| +5 Volts monitor |  |
| _ROLL_ROT | 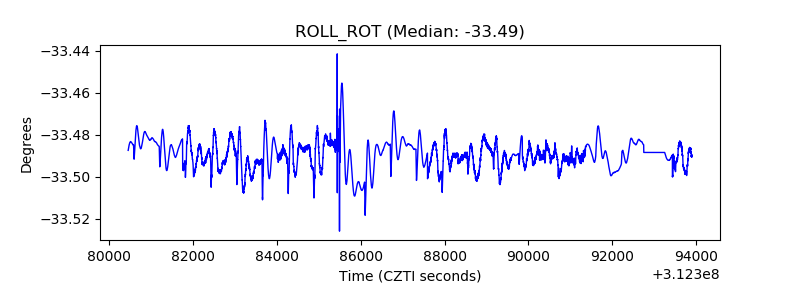 |
| _Roll_DEC | 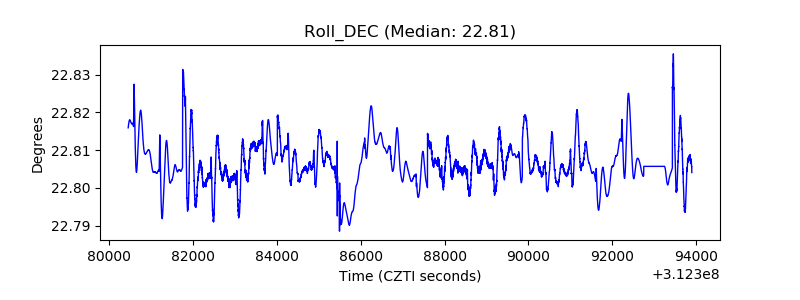 |
| _Roll_RA | 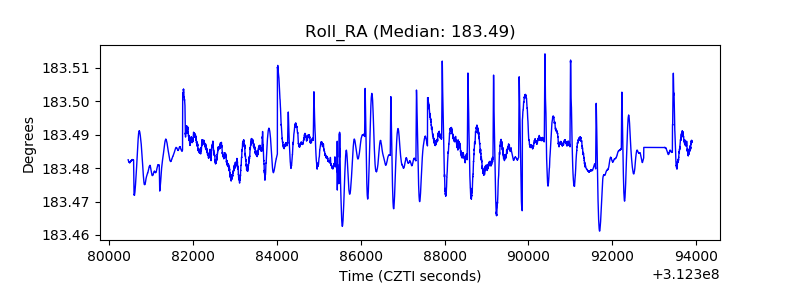 |
| Veto Counter | 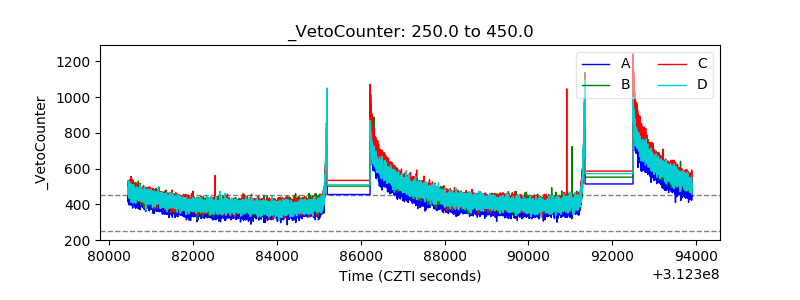 |