| Param | Original file | Final file |
|---|---|---|
| Filename | modeM0/AS1A07_144T02_9000003340_22498cztM0_level2.evt | modeM0/AS1A07_144T02_9000003340_22498cztM0_level2_quad_clean.evt |
| Size (bytes) | 503,170,560 | 87,001,920 |
| Size | 479.9 MB | 83.0 MB |
| Events in quadrant A | 3,831,988 | 700,195 |
| Events in quadrant B | 4,000,910 | 712,469 |
| Events in quadrant C | 1,151,367 | 167 |
| Events in quadrant D | 5,703,141 | 663,059 |
| Mode M9 | |||
|---|---|---|---|
| Quadrant | BADHDUFLAG | Total packets | Discarded packets |
| A | 0 | 6 | 0 |
| B | 0 | 6 | 0 |
| C | 0 | 6 | 0 |
| D | 0 | 6 | 0 |
| Mode SS | |||
|---|---|---|---|
| Quadrant | BADHDUFLAG | Total packets | Discarded packets |
| A | 0 | 166 | 0 |
| B | 0 | 166 | 0 |
| C | 0 | 166 | 0 |
| D | 0 | 166 | 0 |
| Mode M0 | |||
|---|---|---|---|
| Quadrant | BADHDUFLAG | Total packets | Discarded packets |
| A | 0 | 16830 | 2 |
| B | 0 | 17247 | 2 |
| C | 0 | 7990 | 2 |
| D | 0 | 22507 | 2 |
| Quadrant | Total seconds | Saturated seconds | Saturation percentage |
|---|---|---|---|
| A | 7989 | 125 | 1.564651% |
| B | 7988 | 199 | 2.491237% |
| C | 7988 | 7988 | 100.000000% |
| D | 7989 | 458 | 5.732883% |
Noise dominated data is calculated using 1-second bins in cleaned event files. If a bin has >2000 counts, and if more than 50% of those come from <1% of pixels, then it is considered to be noise-dominated and hence unusable.
| Quadrant | # 1 sec bins | Bins with >0 counts | Bins with >2000 counts | High rate bins dominated by noise | Noise dominated (total time) | Noise dominated (detector-on time) | Marked lightcurve |
|---|---|---|---|---|---|---|---|
| A | 8734 | 7991 | 0 | 0 | 0.00% | 0.00% | 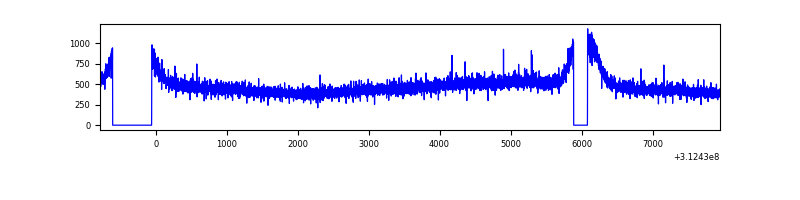 |
| B | 8733 | 7989 | 1 | 1 | 0.01% | 0.01% | 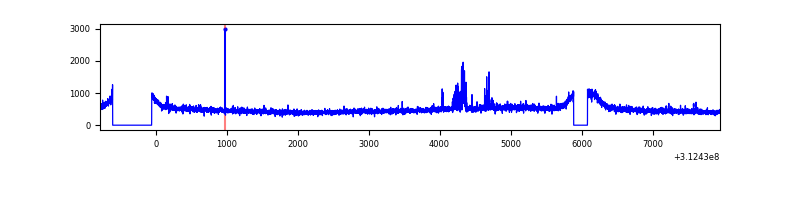 |
| C | 8732 | 7987 | 0 | 0 | 0.00% | 0.00% |  |
| D | 8734 | 7991 | 237 | 237 | 2.71% | 2.97% | 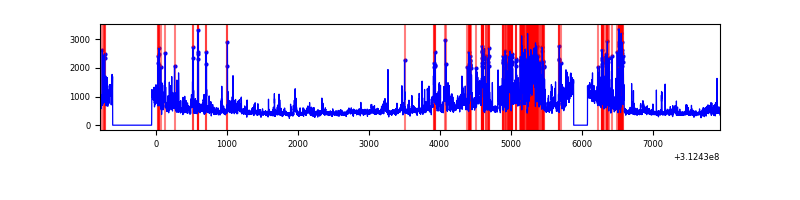 |
Top three noisy pixels from each quadrant. If the there are fewer than three noisy pixels in the level2.evt file, extra rows are filled as -1
| Pixel properties | Quadrant properties | ||||||
|---|---|---|---|---|---|---|---|
| Quadrant | DetID | PixID | Counts | Sigma | Mean | Median | Sigma |
| A | 13 | 254 | 11817 | 53.69 | 994 | 970 | 202.0 |
| A | 3 | 137 | 8900 | 39.25 | 994 | 970 | 202.0 |
| A | 0 | 226 | 8583 | 37.68 | 994 | 970 | 202.0 |
| B | 15 | 33 | 75338 | 384.56 | 995 | 970 | 193.4 |
| B | 12 | 111 | 24113 | 119.67 | 995 | 970 | 193.4 |
| B | 11 | 111 | 20974 | 103.44 | 995 | 970 | 193.4 |
| C | 7 | 119 | 1135507 | 671017.03 | 3 | 3 | 1.7 |
| C | 7 | 226 | 2335 | 1378.08 | 3 | 3 | 1.7 |
| C | 14 | 238 | 1246 | 734.54 | 3 | 3 | 1.7 |
| D | 1 | 52 | 2044811 | 8659.16 | 952 | 922 | 236.0 |
| D | 2 | 234 | 34109 | 140.6 | 952 | 922 | 236.0 |
| D | 13 | 172 | 21378 | 86.66 | 952 | 922 | 236.0 |
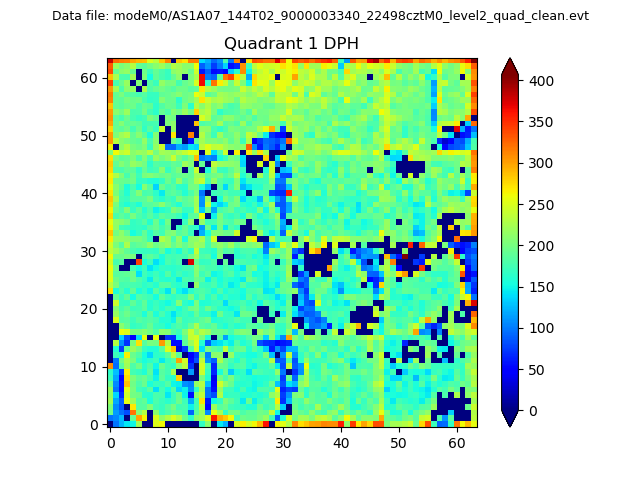
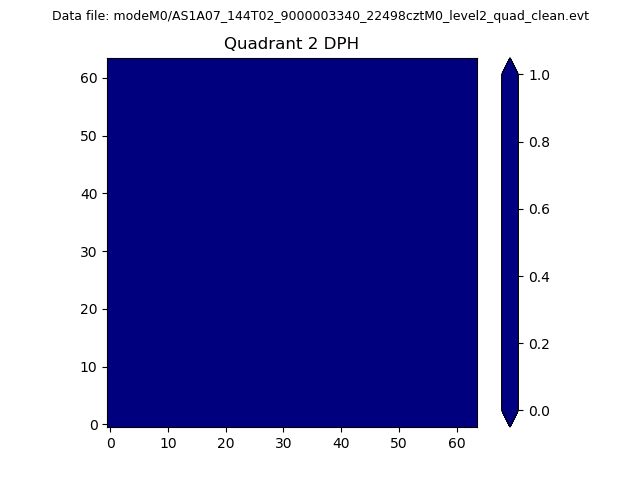
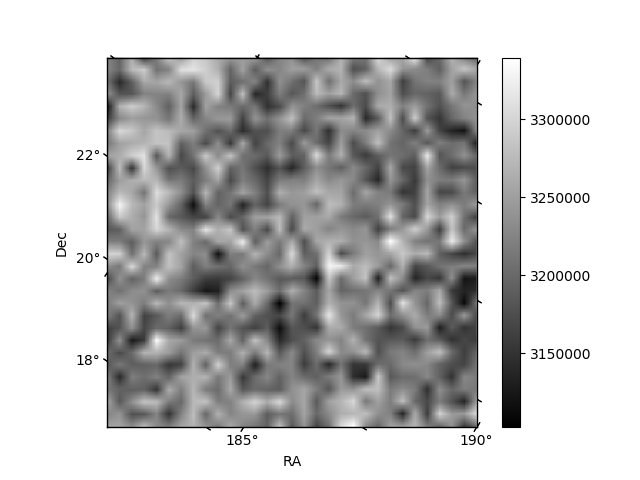
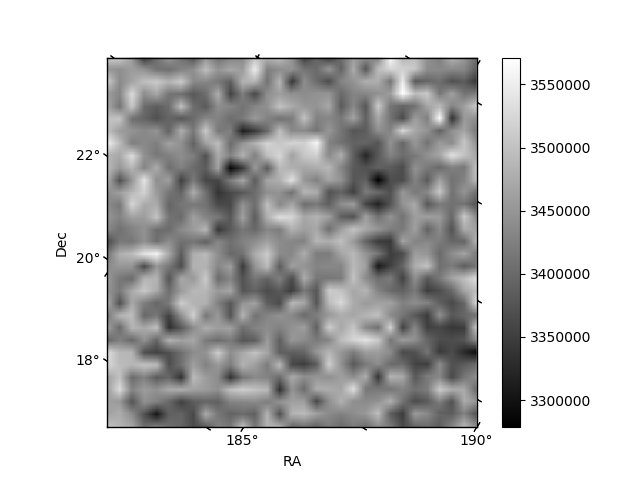
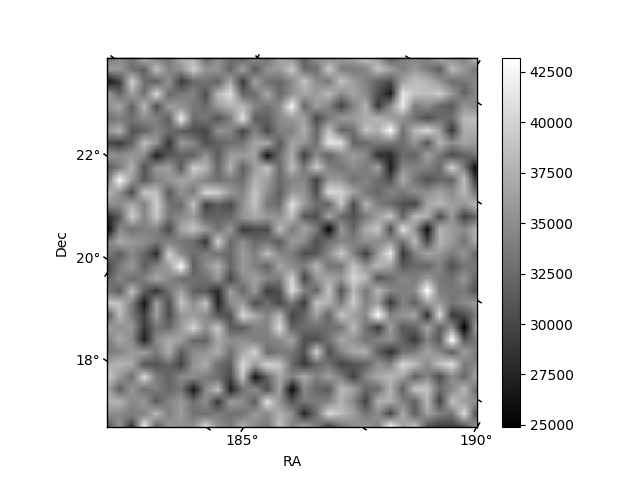
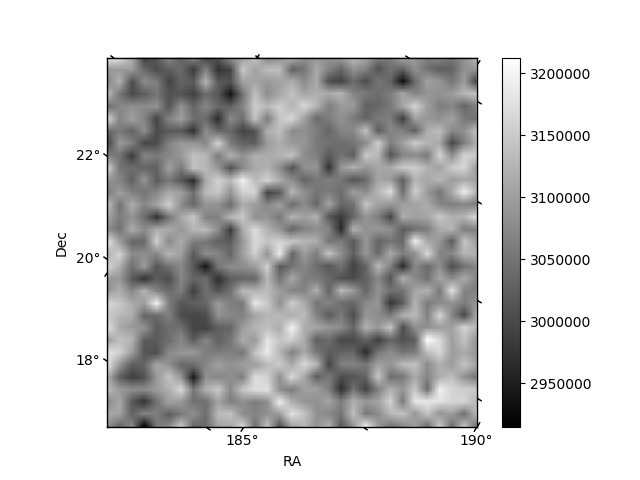
Histogram calculated using DETX and DETY for each event in the final _common_clean file
| Quadrant A | 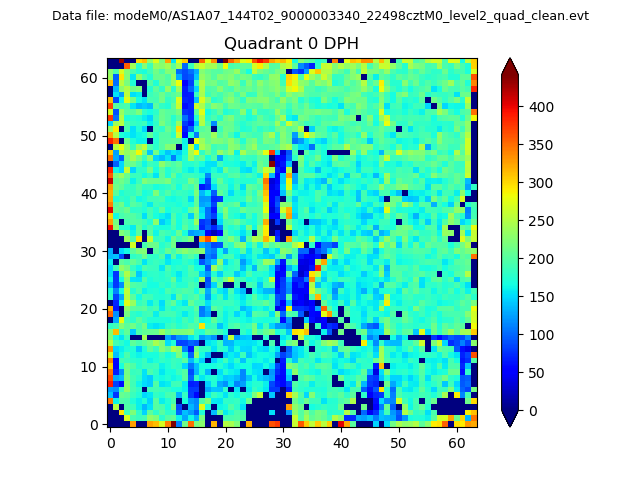 |
 |
Quadrant B |
|---|---|---|---|
| Quadrant D |  |
 |
Quadrant C |
| Plot type | Count rate plots | Images |
|---|---|---|
| Comparison with Poisson distribution Blue bars denote a histogram of data divided into 1 sec bins. Red curve is a Poisson curve with rate = median count rate of data. |
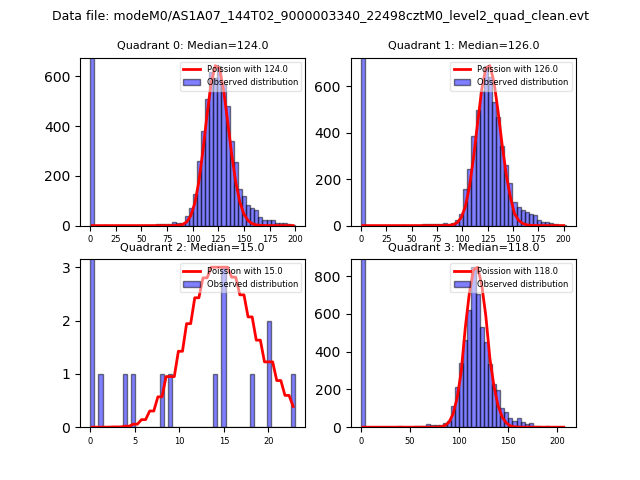 |
 |
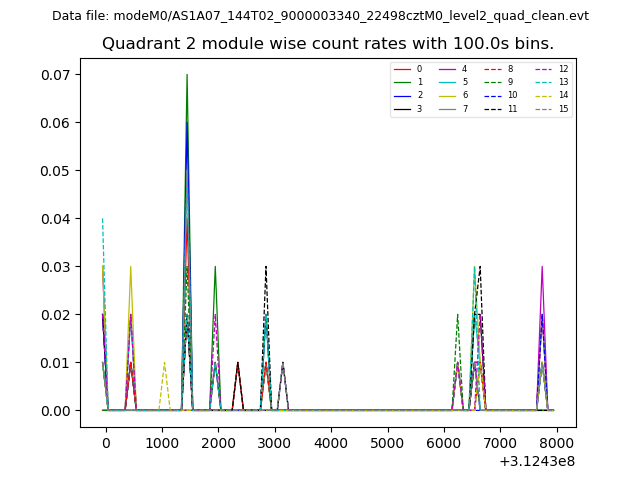
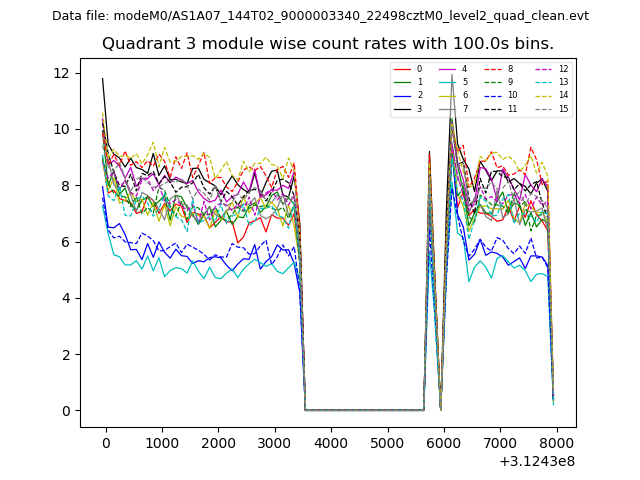
| Quadrant-wise count rates Data is divided into 100 sec bins |
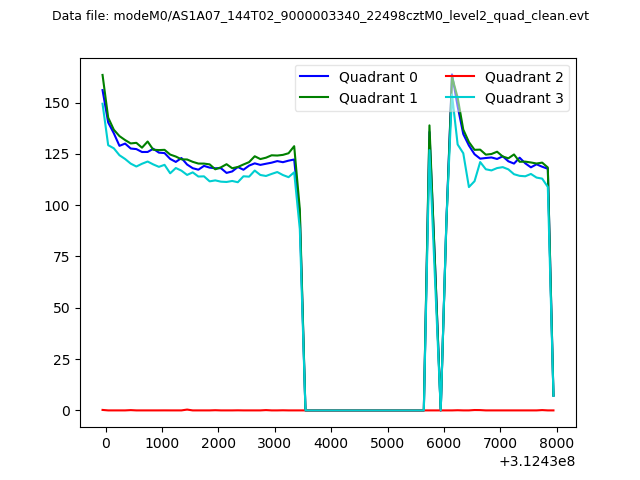 |
|
| Module-wise count rates for Quadrant A Data is divided into 100 sec bins |
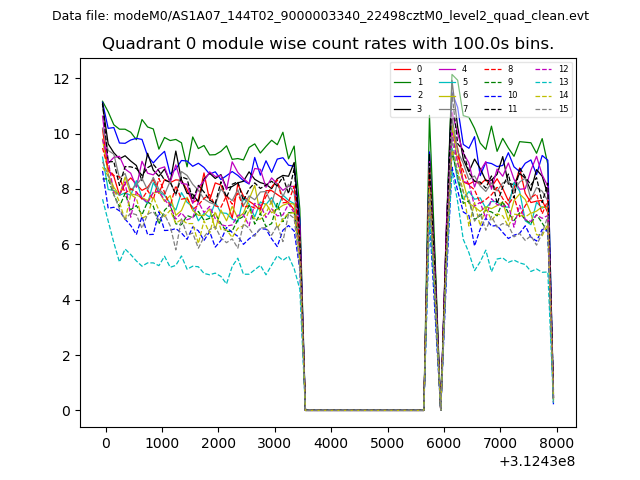 |
 |
| Module-wise count rates for Quadrant B Data is divided into 100 sec bins |
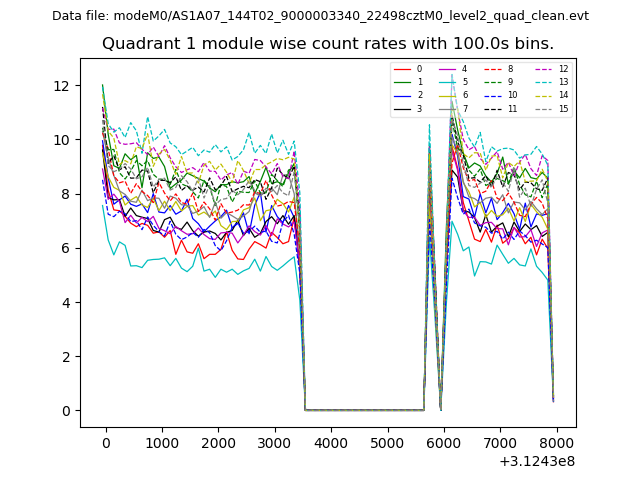 |
 |
| Module-wise count rates for Quadrant C Data is divided into 100 sec bins |
 |
 |
| Module-wise count rates for Quadrant D Data is divided into 100 sec bins |
 |
 |
| Parameter | Plot |
|---|---|
| CZT HV Monitor | 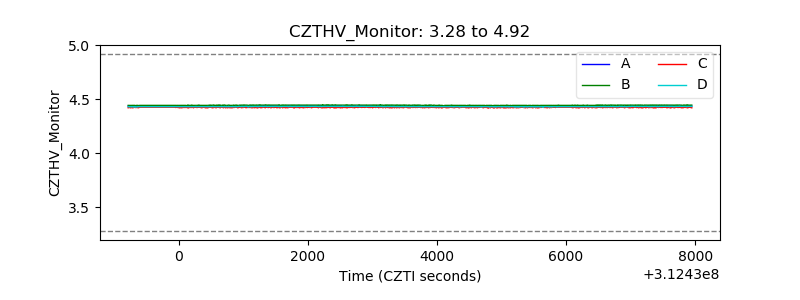 |
| D_VDD | 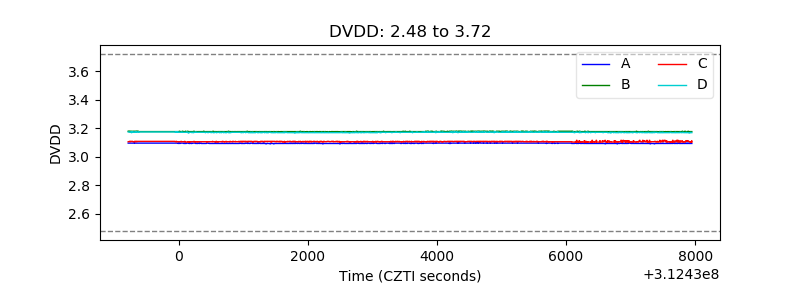 |
| Temperature 1 | 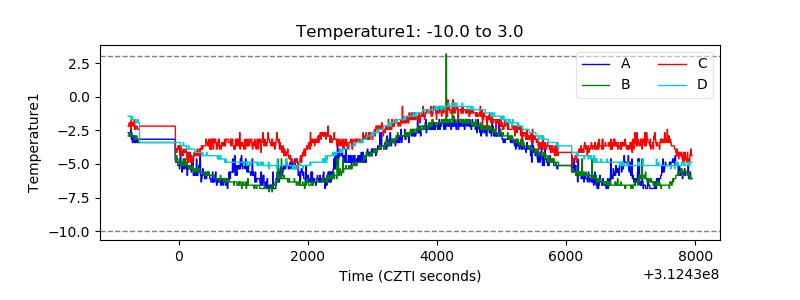 |
| Veto HV Monitor | 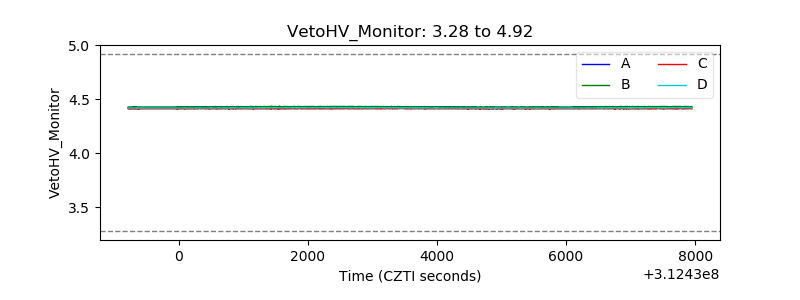 |
| Veto LLD | 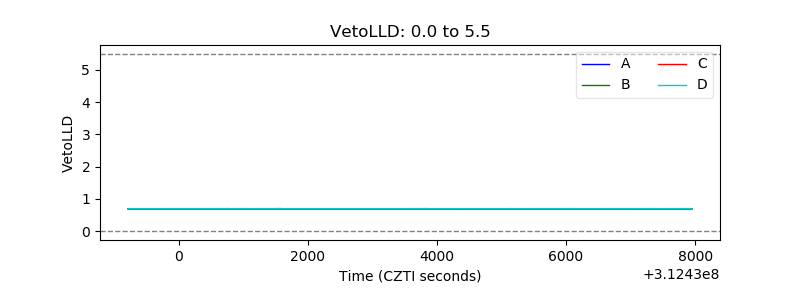 |
| Alpha Counter | 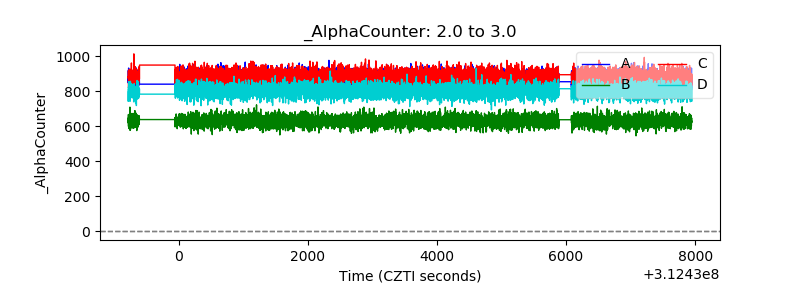 |
| _CPM_Rate | 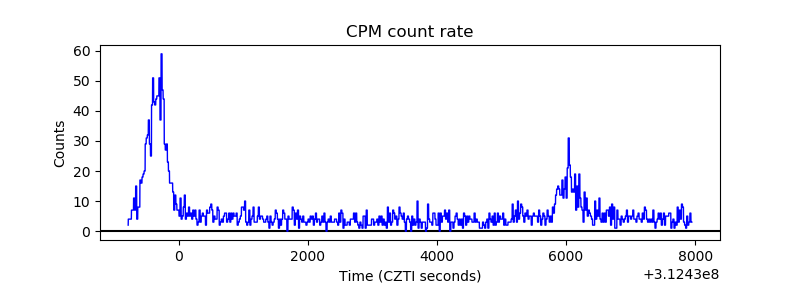 |
| CZT Counter | 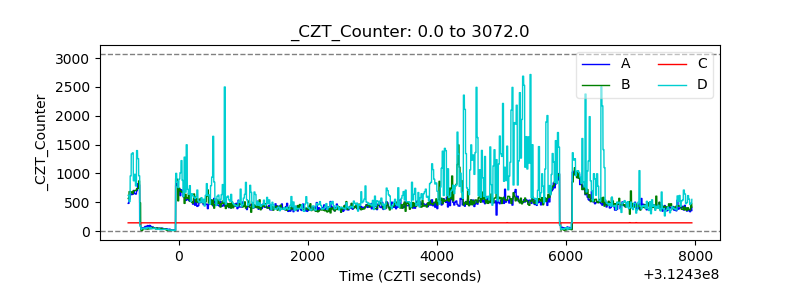 |
| +2.5 Volts monitor |  |
| +5 Volts monitor |  |
| _ROLL_ROT | 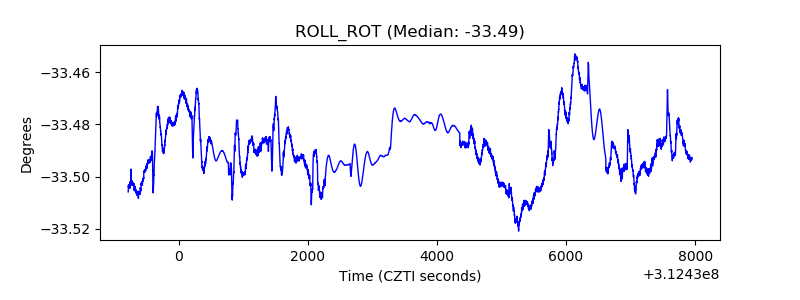 |
| _Roll_DEC | 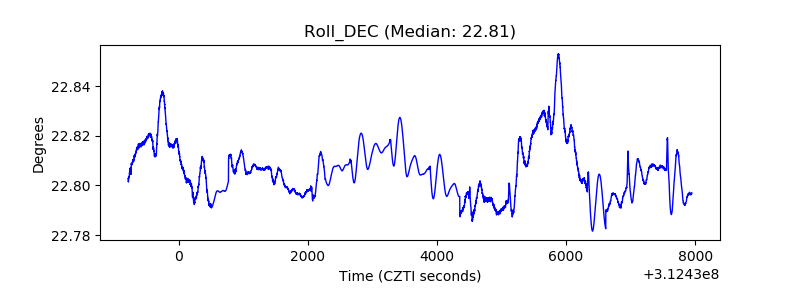 |
| _Roll_RA | 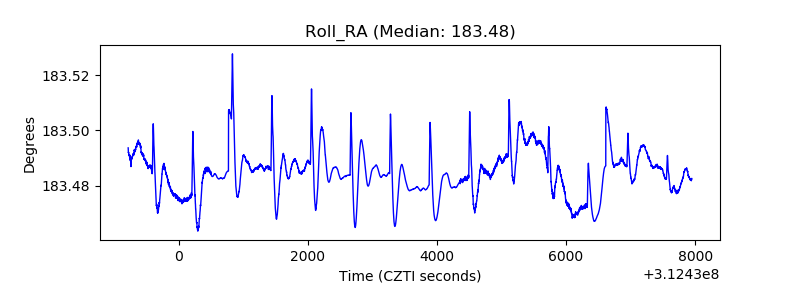 |
| Veto Counter | 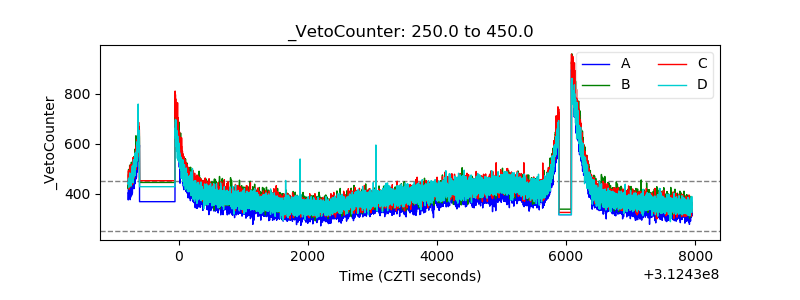 |