| Param | Original file | Final file |
|---|---|---|
| Filename | modeM0/AS1A07_144T02_9000003340_22499cztM0_level2.evt | modeM0/AS1A07_144T02_9000003340_22499cztM0_level2_quad_clean.evt |
| Size (bytes) | 379,929,600 | 68,987,520 |
| Size | 362.3 MB | 65.8 MB |
| Events in quadrant A | 3,137,256 | 544,789 |
| Events in quadrant B | 3,412,842 | 552,648 |
| Events in quadrant C | 964,190 | 87 |
| Events in quadrant D | 3,529,009 | 522,098 |
| Mode M9 | |||
|---|---|---|---|
| Quadrant | BADHDUFLAG | Total packets | Discarded packets |
| A | 0 | 2 | 0 |
| B | 0 | 2 | 0 |
| C | 0 | 2 | 0 |
| D | 0 | 2 | 0 |
| Mode SS | |||
|---|---|---|---|
| Quadrant | BADHDUFLAG | Total packets | Discarded packets |
| A | 0 | 138 | 0 |
| B | 0 | 138 | 0 |
| C | 0 | 138 | 0 |
| D | 0 | 138 | 0 |
| Mode M0 | |||
|---|---|---|---|
| Quadrant | BADHDUFLAG | Total packets | Discarded packets |
| A | 0 | 13898 | 2 |
| B | 0 | 14696 | 2 |
| C | 0 | 6693 | 2 |
| D | 0 | 15022 | 2 |
| Quadrant | Total seconds | Saturated seconds | Saturation percentage |
|---|---|---|---|
| A | 6691 | 97 | 1.449709% |
| B | 6691 | 159 | 2.376326% |
| C | 6691 | 6691 | 100.000000% |
| D | 6692 | 76 | 1.135684% |
Noise dominated data is calculated using 1-second bins in cleaned event files. If a bin has >2000 counts, and if more than 50% of those come from <1% of pixels, then it is considered to be noise-dominated and hence unusable.
| Quadrant | # 1 sec bins | Bins with >0 counts | Bins with >2000 counts | High rate bins dominated by noise | Noise dominated (total time) | Noise dominated (detector-on time) | Marked lightcurve |
|---|---|---|---|---|---|---|---|
| A | 6996 | 6691 | 0 | 0 | 0.00% | 0.00% |  |
| B | 6996 | 6692 | 31 | 31 | 0.44% | 0.46% |  |
| C | 6995 | 6690 | 0 | 0 | 0.00% | 0.00% |  |
| D | 6997 | 6693 | 40 | 40 | 0.57% | 0.60% |  |
Top three noisy pixels from each quadrant. If the there are fewer than three noisy pixels in the level2.evt file, extra rows are filled as -1
| Pixel properties | Quadrant properties | ||||||
|---|---|---|---|---|---|---|---|
| Quadrant | DetID | PixID | Counts | Sigma | Mean | Median | Sigma |
| A | 6 | 240 | 14161 | 81.84 | 803 | 785 | 163.5 |
| A | 3 | 1 | 13011 | 74.8 | 803 | 785 | 163.5 |
| A | 13 | 254 | 10058 | 56.73 | 803 | 785 | 163.5 |
| B | 15 | 33 | 158891 | 1015.23 | 798 | 777 | 155.7 |
| B | 5 | 172 | 114985 | 733.32 | 798 | 777 | 155.7 |
| B | 12 | 111 | 19357 | 119.3 | 798 | 777 | 155.7 |
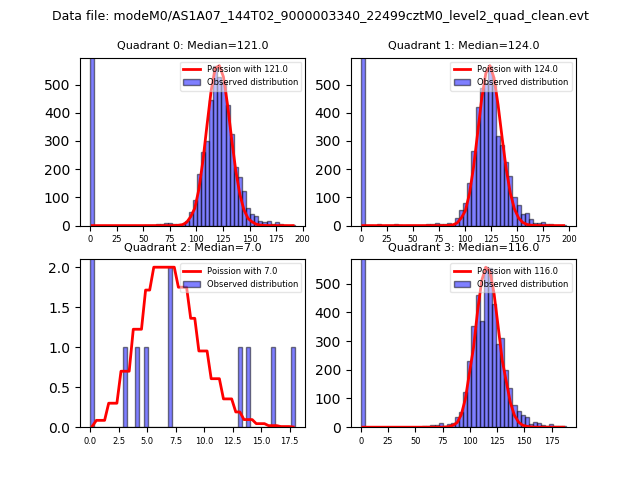
| C | 7 | 119 | 952032 | 689066.46 | 2 | 2 | 1.4 |
| C | 7 | 226 | 1979 | 1430.93 | 2 | 2 | 1.4 |
| C | 14 | 238 | 1060 | 765.77 | 2 | 2 | 1.4 |
| D | 1 | 52 | 541801 | 2809.79 | 780 | 755 | 192.6 |
| D | 2 | 234 | 28975 | 146.55 | 780 | 755 | 192.6 |
| D | 13 | 172 | 20585 | 102.98 | 780 | 755 | 192.6 |
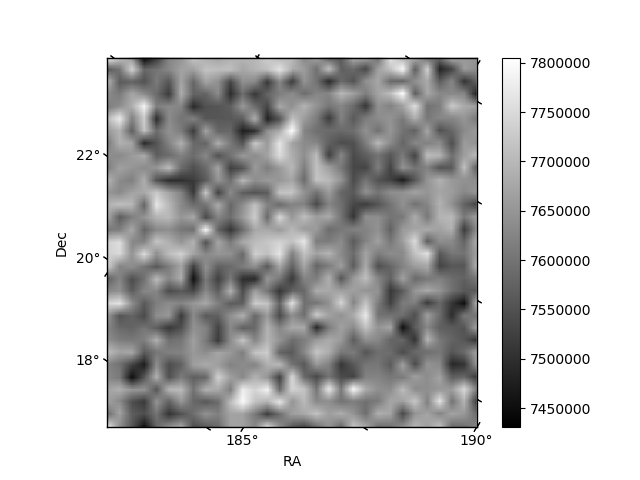
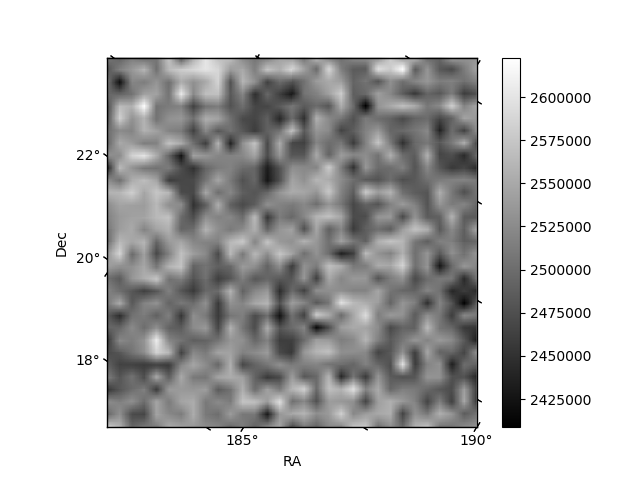
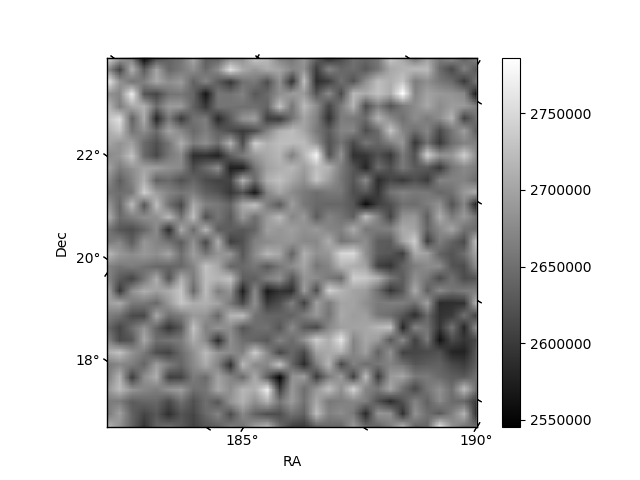
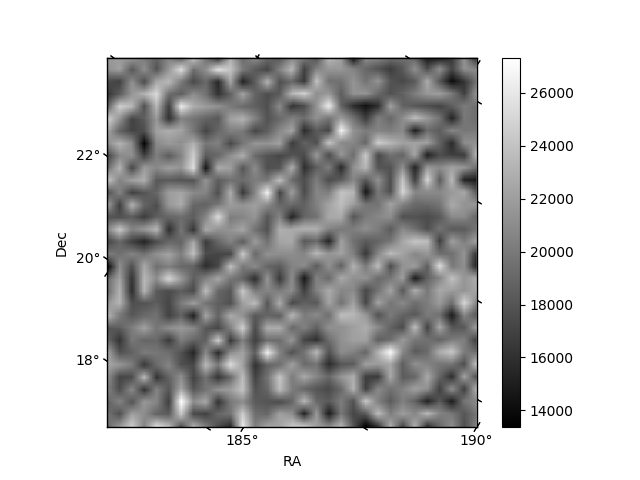
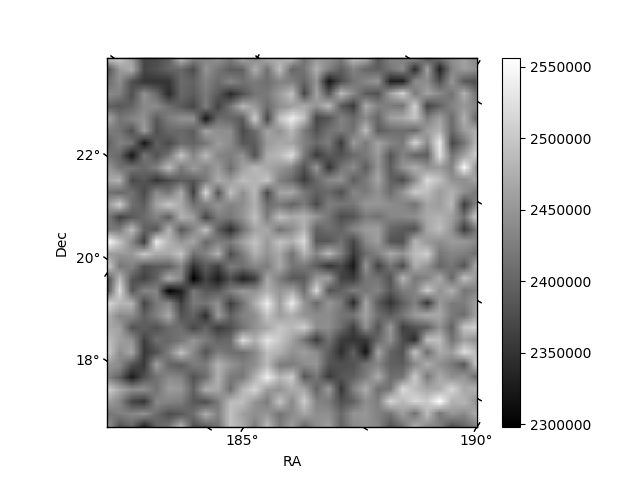
Histogram calculated using DETX and DETY for each event in the final _common_clean file
| Quadrant A |  |
 |
Quadrant B |
|---|---|---|---|
| Quadrant D |  |
 |
Quadrant C |
| Plot type | Count rate plots | Images |
|---|---|---|
| Comparison with Poisson distribution Blue bars denote a histogram of data divided into 1 sec bins. Red curve is a Poisson curve with rate = median count rate of data. |
 |
 |
| Quadrant-wise count rates Data is divided into 100 sec bins |
 |
|
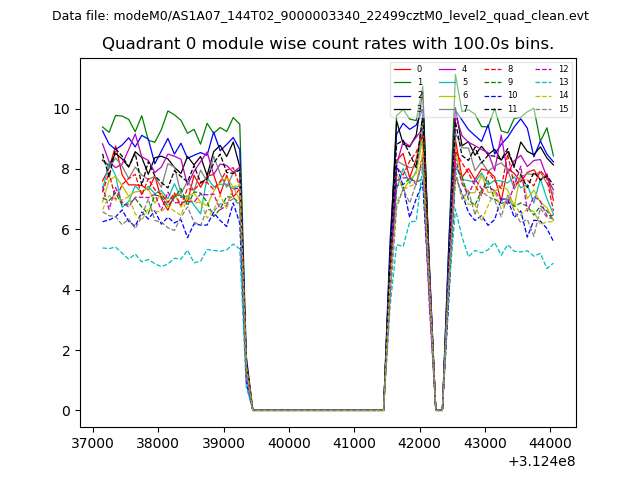
| Module-wise count rates for Quadrant A Data is divided into 100 sec bins |
 |
 |
| Module-wise count rates for Quadrant B Data is divided into 100 sec bins |
 |
 |
| Module-wise count rates for Quadrant C Data is divided into 100 sec bins |
 |
 |
| Module-wise count rates for Quadrant D Data is divided into 100 sec bins |
 |
 |
| Parameter | Plot |
|---|---|
| CZT HV Monitor |  |
| D_VDD | 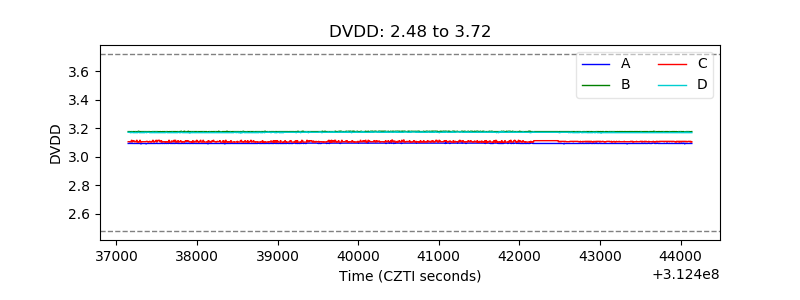 |
| Temperature 1 | 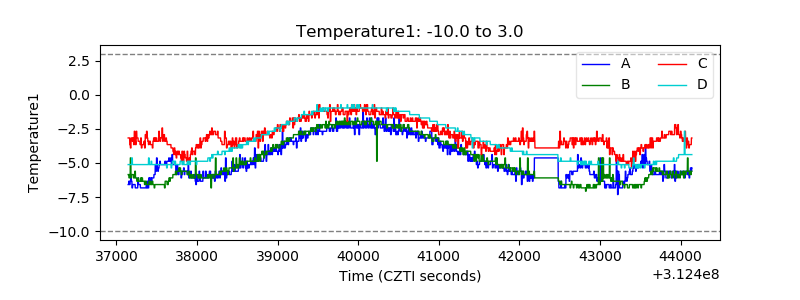 |
| Veto HV Monitor | 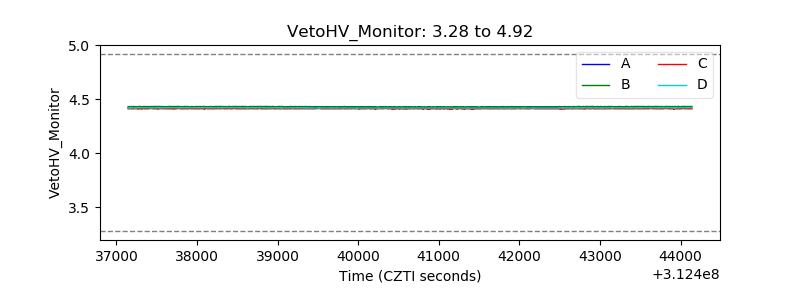 |
| Veto LLD | 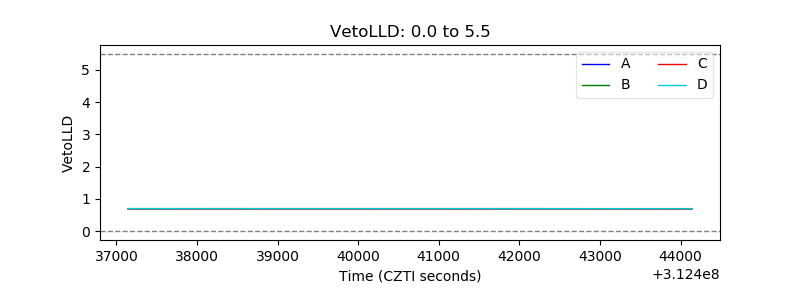 |
| Alpha Counter |  |
| _CPM_Rate |  |
| CZT Counter | 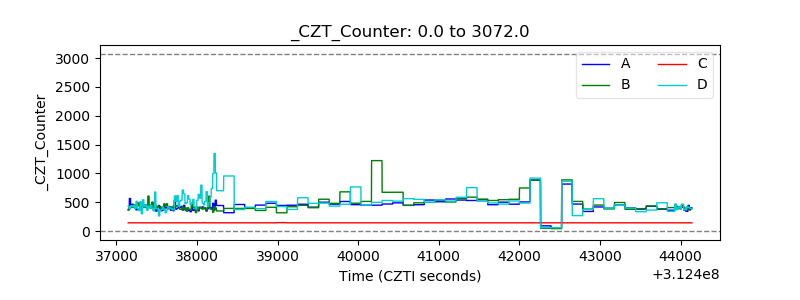 |
| +2.5 Volts monitor |  |
| +5 Volts monitor |  |
| _ROLL_ROT | 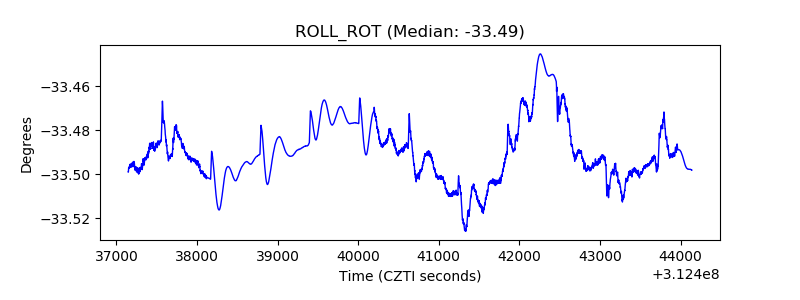 |
| _Roll_DEC | 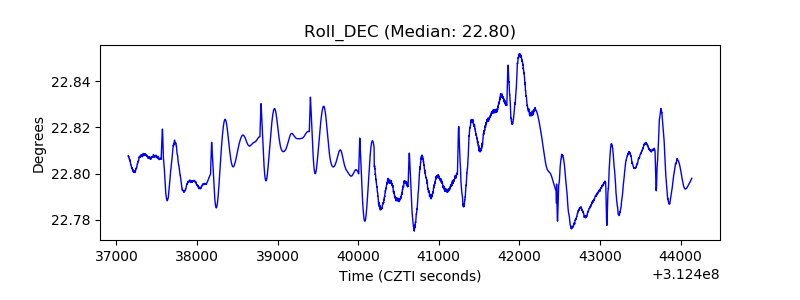 |
| _Roll_RA | 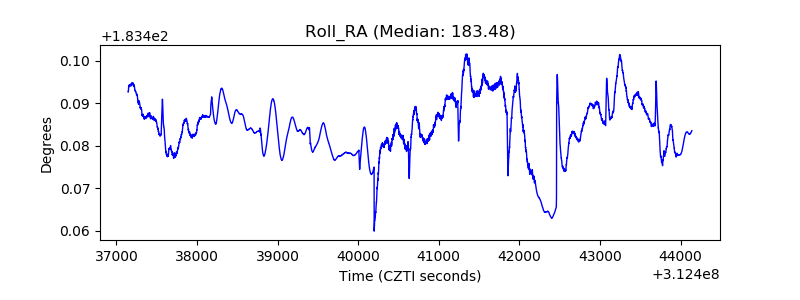 |
| Veto Counter | 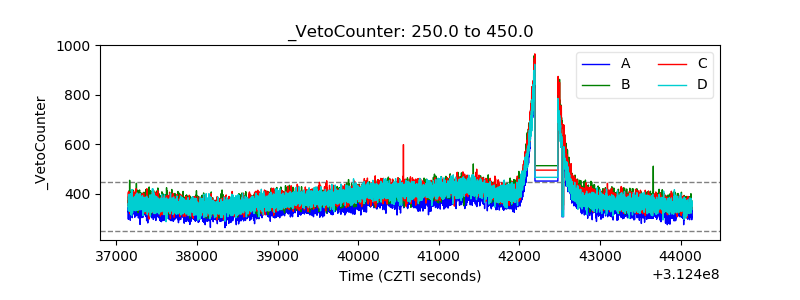 |