| Param | Original file | Final file |
|---|---|---|
| Filename | modeM0/AS1A07_144T02_9000003340_22505cztM0_level2.evt | modeM0/AS1A07_144T02_9000003340_22505cztM0_level2_quad_clean.evt |
| Size (bytes) | 427,377,600 | 69,552,000 |
| Size | 407.6 MB | 66.3 MB |
| Events in quadrant A | 3,070,520 | 421,793 |
| Events in quadrant B | 3,117,531 | 430,095 |
| Events in quadrant C | 3,149,772 | 415,976 |
| Events in quadrant D | 3,187,559 | 408,929 |
| Mode M9 | |||
|---|---|---|---|
| Quadrant | BADHDUFLAG | Total packets | Discarded packets |
| A | 0 | 11 | 0 |
| B | 0 | 11 | 0 |
| C | 0 | 11 | 0 |
| D | 0 | 11 | 0 |
| Mode SS | |||
|---|---|---|---|
| Quadrant | BADHDUFLAG | Total packets | Discarded packets |
| A | 0 | 124 | 0 |
| B | 0 | 124 | 0 |
| C | 0 | 124 | 0 |
| D | 0 | 124 | 0 |
| Mode M0 | |||
|---|---|---|---|
| Quadrant | BADHDUFLAG | Total packets | Discarded packets |
| A | 0 | 12941 | 1 |
| B | 0 | 13062 | 1 |
| C | 0 | 13116 | 2 |
| D | 0 | 13435 | 1 |
| Quadrant | Total seconds | Saturated seconds | Saturation percentage |
|---|---|---|---|
| A | 6149 | 49 | 0.796878% |
| B | 6150 | 45 | 0.731707% |
| C | 6149 | 78 | 1.268499% |
| D | 6149 | 42 | 0.683038% |
Noise dominated data is calculated using 1-second bins in cleaned event files. If a bin has >2000 counts, and if more than 50% of those come from <1% of pixels, then it is considered to be noise-dominated and hence unusable.
| Quadrant | # 1 sec bins | Bins with >0 counts | Bins with >2000 counts | High rate bins dominated by noise | Noise dominated (total time) | Noise dominated (detector-on time) | Marked lightcurve |
|---|---|---|---|---|---|---|---|
| A | 7264 | 6149 | 0 | 0 | 0.00% | 0.00% | 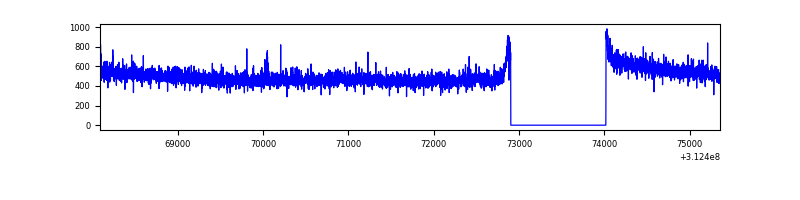 |
| B | 7265 | 6150 | 0 | 0 | 0.00% | 0.00% | 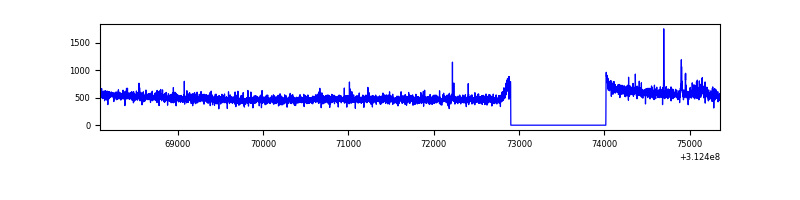 |
| C | 7265 | 6150 | 0 | 0 | 0.00% | 0.00% | 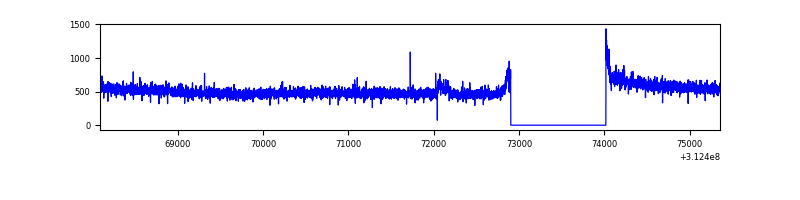 |
| D | 7265 | 6150 | 6 | 6 | 0.08% | 0.10% | 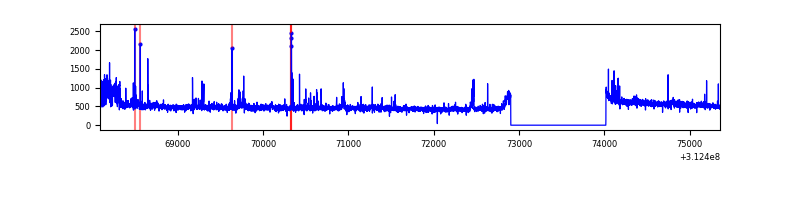 |
Top three noisy pixels from each quadrant. If the there are fewer than three noisy pixels in the level2.evt file, extra rows are filled as -1
| Pixel properties | Quadrant properties | ||||||
|---|---|---|---|---|---|---|---|
| Quadrant | DetID | PixID | Counts | Sigma | Mean | Median | Sigma |
| A | 13 | 254 | 9736 | 56.34 | 794 | 779 | 159.0 |
| A | 3 | 1 | 7762 | 43.93 | 794 | 779 | 159.0 |
| A | 0 | 226 | 6856 | 38.23 | 794 | 779 | 159.0 |
| B | 12 | 111 | 17815 | 113.11 | 788 | 768 | 150.7 |
| B | 11 | 111 | 15972 | 100.88 | 788 | 768 | 150.7 |
| B | 0 | 190 | 14800 | 93.1 | 788 | 768 | 150.7 |
| C | 14 | 238 | 121336 | 674.33 | 769 | 775 | 178.8 |
| C | 0 | 10 | 16506 | 87.99 | 769 | 775 | 178.8 |
| C | 10 | 22 | 16371 | 87.23 | 769 | 775 | 178.8 |
| D | 1 | 52 | 143144 | 747.95 | 780 | 757 | 190.4 |
| D | 13 | 172 | 31105 | 159.42 | 780 | 757 | 190.4 |
| D | 2 | 234 | 25384 | 129.36 | 780 | 757 | 190.4 |
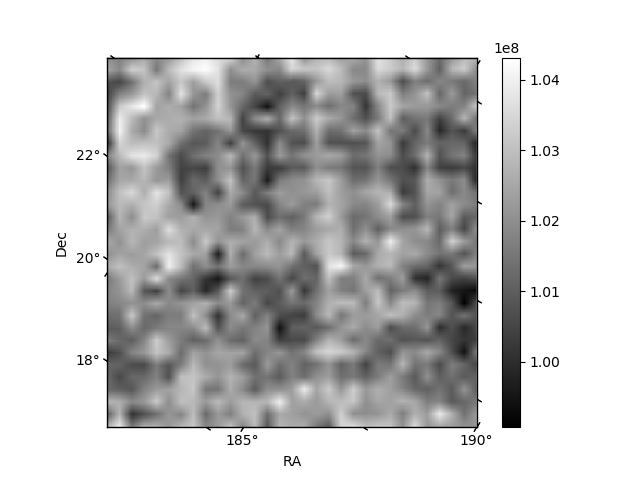
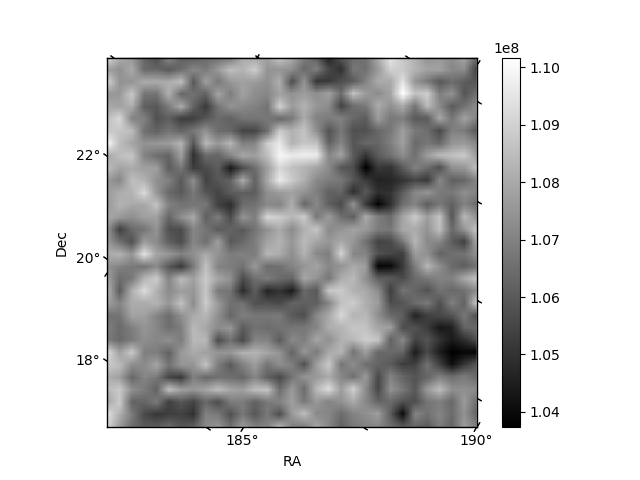
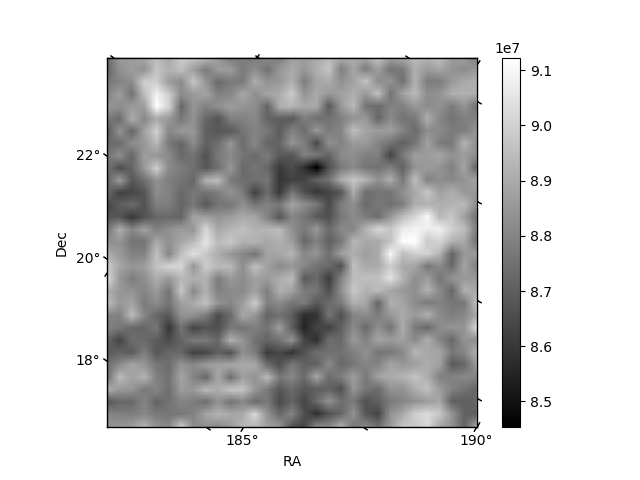
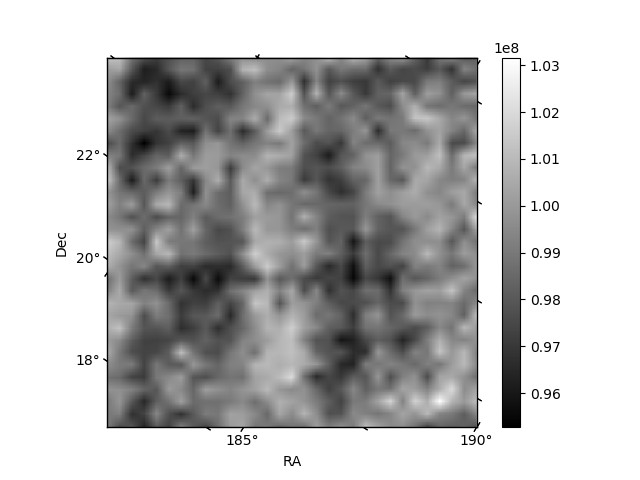
Histogram calculated using DETX and DETY for each event in the final _common_clean file
| Quadrant A | 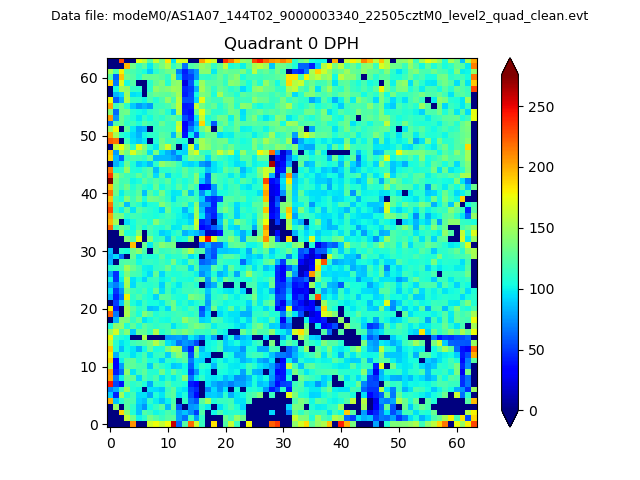 |
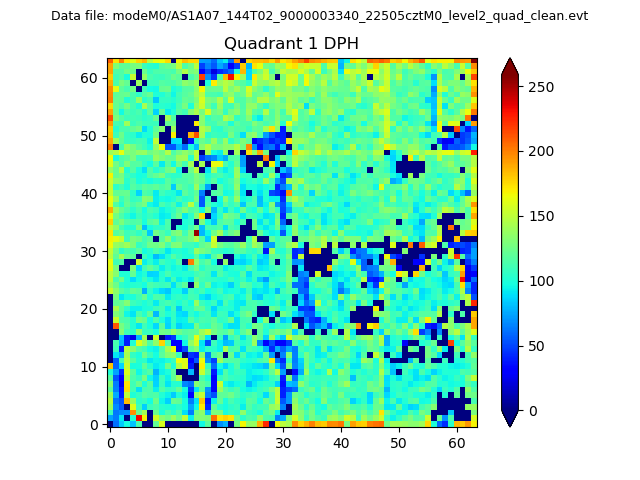 |
Quadrant B |
|---|---|---|---|
| Quadrant D | 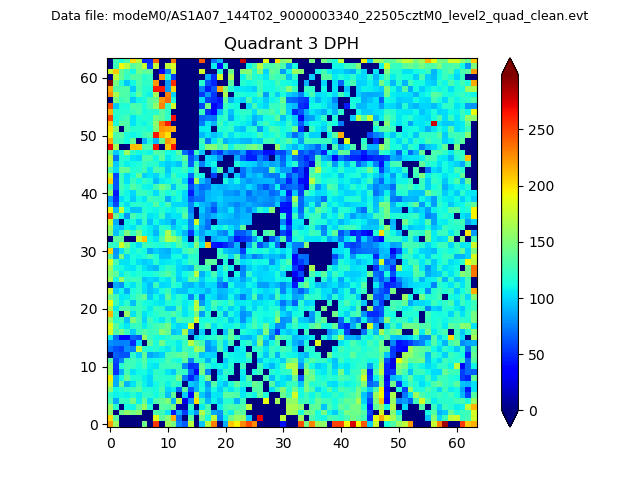 |
 |
Quadrant C |
| Plot type | Count rate plots | Images |
|---|---|---|
| Comparison with Poisson distribution Blue bars denote a histogram of data divided into 1 sec bins. Red curve is a Poisson curve with rate = median count rate of data. |
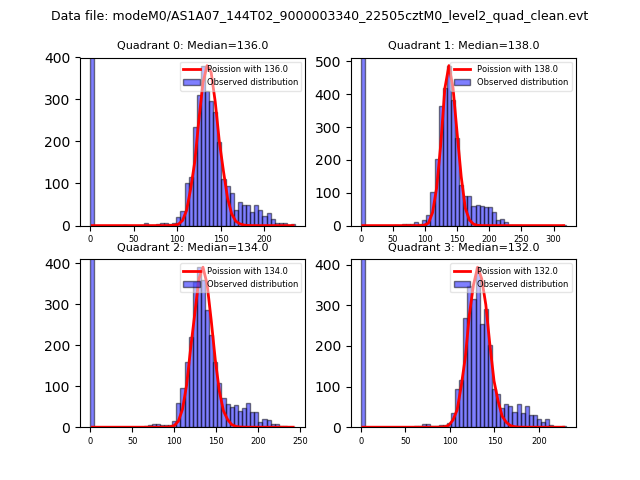 |
 |
| Quadrant-wise count rates Data is divided into 100 sec bins |
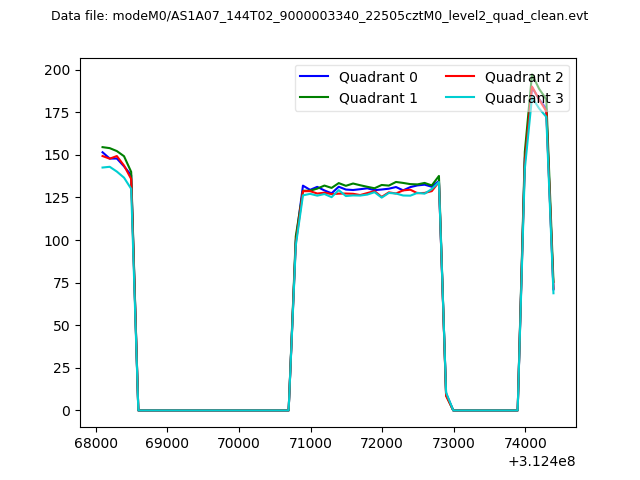 |
|
| Module-wise count rates for Quadrant A Data is divided into 100 sec bins |
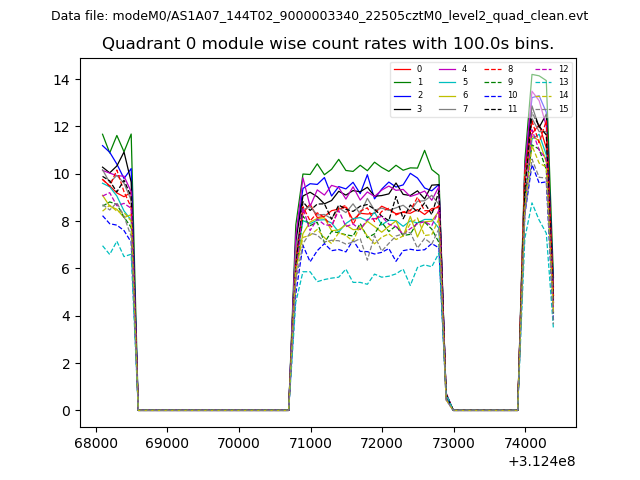 |
 |
| Module-wise count rates for Quadrant B Data is divided into 100 sec bins |
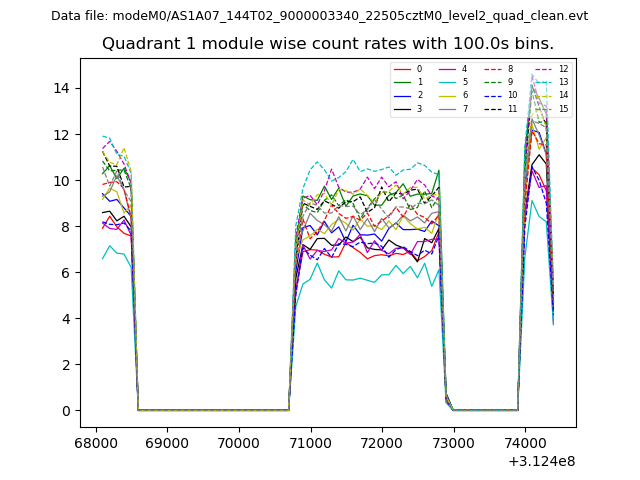 |
 |
| Module-wise count rates for Quadrant C Data is divided into 100 sec bins |
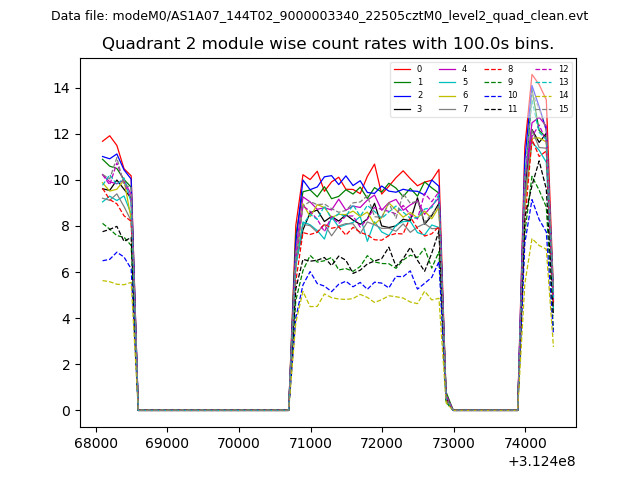 |
 |
| Module-wise count rates for Quadrant D Data is divided into 100 sec bins |
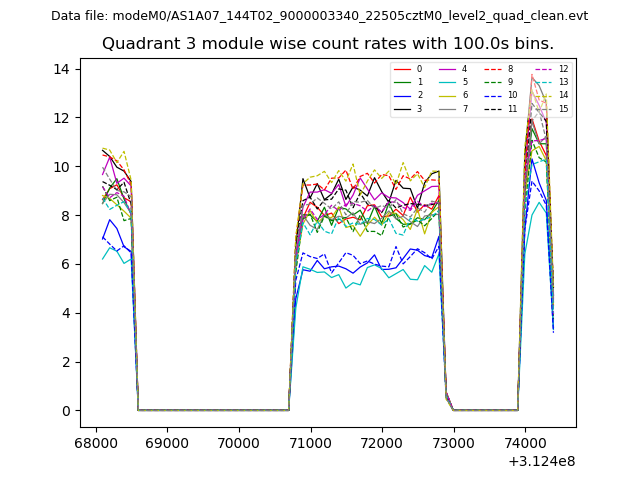 |
 |
| Parameter | Plot |
|---|---|
| CZT HV Monitor | 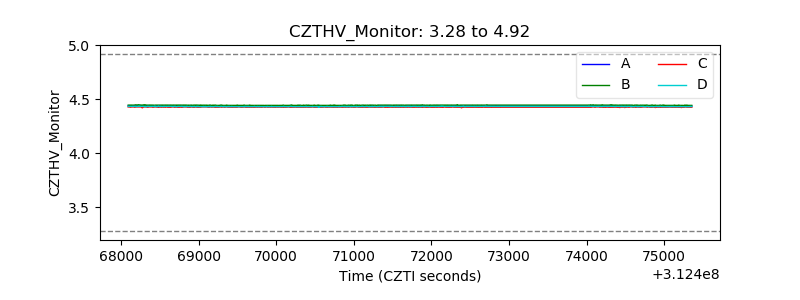 |
| D_VDD | 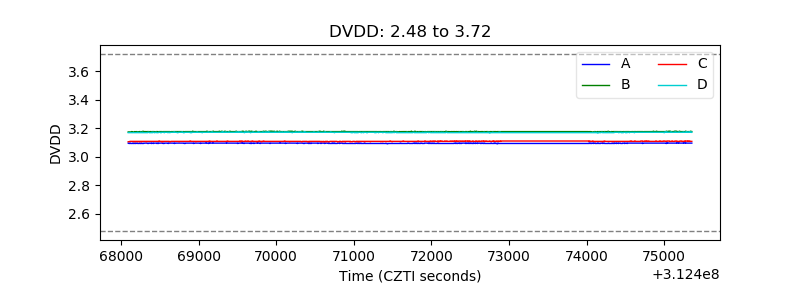 |
| Temperature 1 | 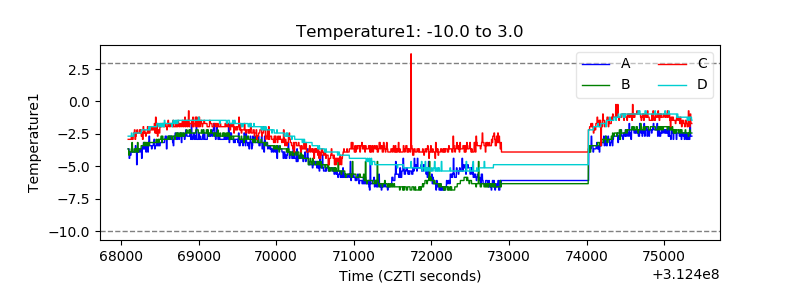 |
| Veto HV Monitor | 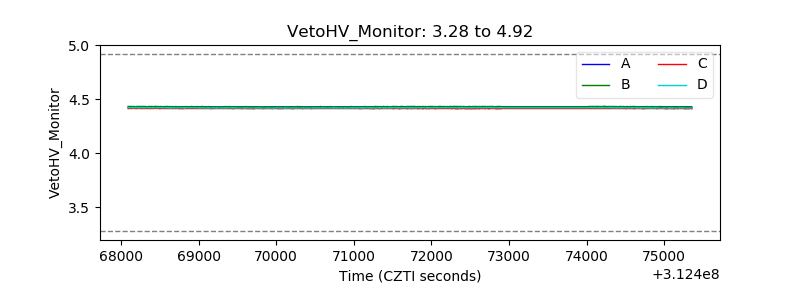 |
| Veto LLD | 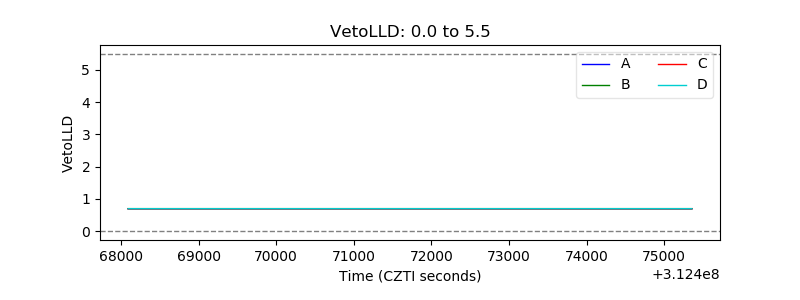 |
| Alpha Counter | 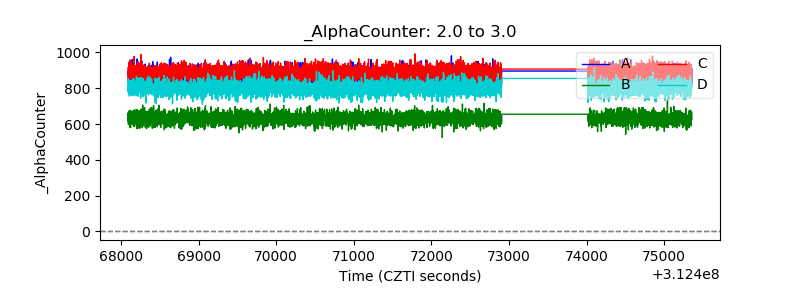 |
| _CPM_Rate | 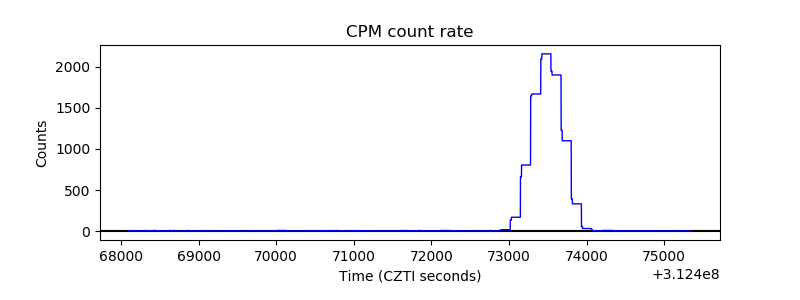 |
| CZT Counter | 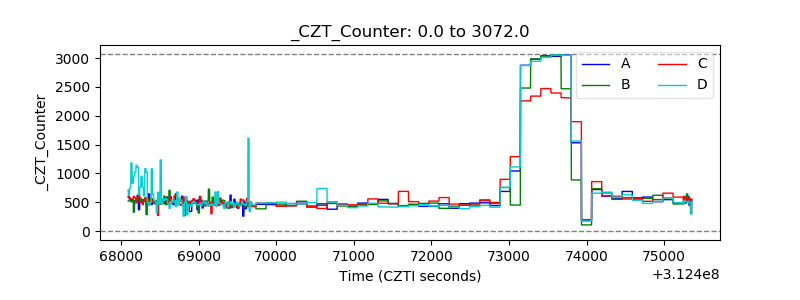 |
| +2.5 Volts monitor |  |
| +5 Volts monitor |  |
| _ROLL_ROT | 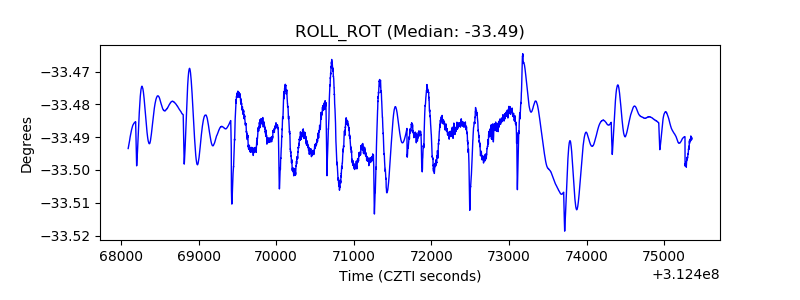 |
| _Roll_DEC | 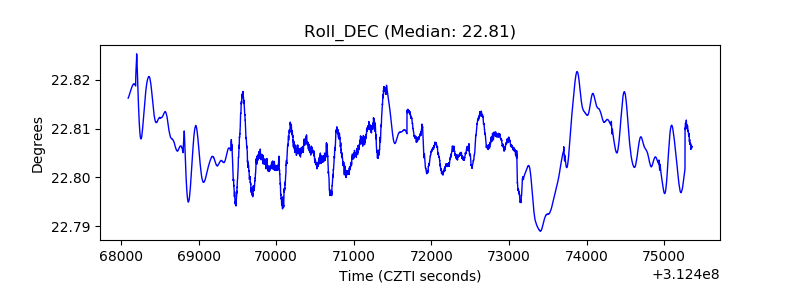 |
| _Roll_RA |  |
| Veto Counter | 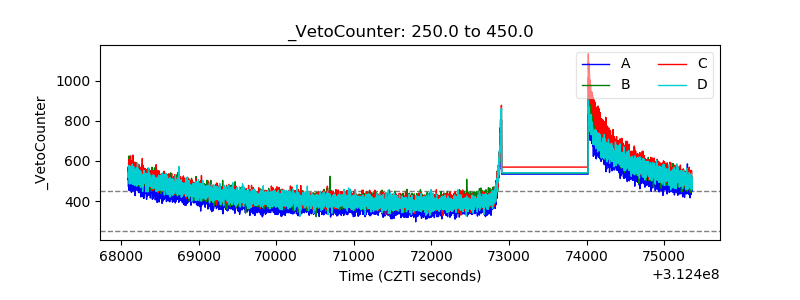 |