| Param | Original file | Final file |
|---|---|---|
| Filename | modeM0/AS1A07_144T02_9000003340_22507cztM0_level2.evt | modeM0/AS1A07_144T02_9000003340_22507cztM0_level2_quad_clean.evt |
| Size (bytes) | 510,393,600 | 65,416,320 |
| Size | 486.7 MB | 62.4 MB |
| Events in quadrant A | 3,659,994 | 384,129 |
| Events in quadrant B | 3,950,916 | 392,987 |
| Events in quadrant C | 3,637,876 | 381,396 |
| Events in quadrant D | 3,773,003 | 373,939 |
| Mode M9 | |||
|---|---|---|---|
| Quadrant | BADHDUFLAG | Total packets | Discarded packets |
| A | 0 | 15 | 0 |
| B | 0 | 16 | 0 |
| C | 0 | 16 | 0 |
| D | 0 | 16 | 0 |
| Mode SS | |||
|---|---|---|---|
| Quadrant | BADHDUFLAG | Total packets | Discarded packets |
| A | 0 | 130 | 0 |
| B | 0 | 130 | 0 |
| C | 0 | 130 | 0 |
| D | 0 | 130 | 0 |
| Mode M0 | |||
|---|---|---|---|
| Quadrant | BADHDUFLAG | Total packets | Discarded packets |
| A | 0 | 15123 | 2 |
| B | 0 | 16024 | 2 |
| C | 0 | 15014 | 2 |
| D | 0 | 15450 | 2 |
| Quadrant | Total seconds | Saturated seconds | Saturation percentage |
|---|---|---|---|
| A | 6425 | 65 | 1.011673% |
| B | 6424 | 127 | 1.976961% |
| C | 6424 | 141 | 2.194894% |
| D | 6424 | 73 | 1.136364% |
Noise dominated data is calculated using 1-second bins in cleaned event files. If a bin has >2000 counts, and if more than 50% of those come from <1% of pixels, then it is considered to be noise-dominated and hence unusable.
| Quadrant | # 1 sec bins | Bins with >0 counts | Bins with >2000 counts | High rate bins dominated by noise | Noise dominated (total time) | Noise dominated (detector-on time) | Marked lightcurve |
|---|---|---|---|---|---|---|---|
| A | 7715 | 6425 | 3 | 3 | 0.04% | 0.05% | 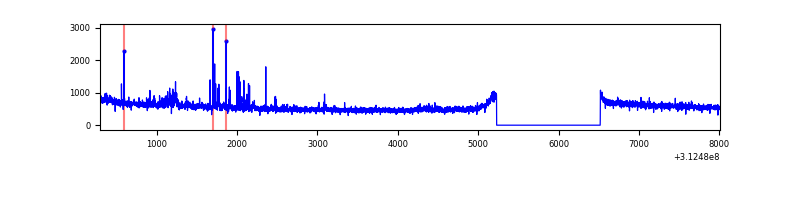 |
| B | 7714 | 6424 | 13 | 13 | 0.17% | 0.20% | 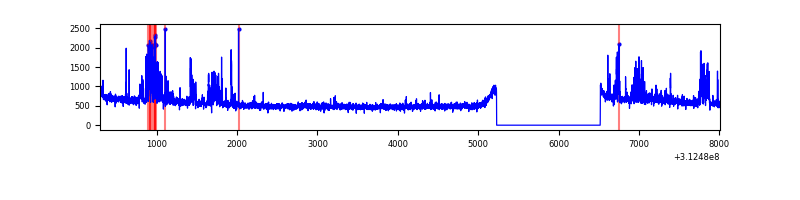 |
| C | 7714 | 6424 | 1 | 1 | 0.01% | 0.02% | 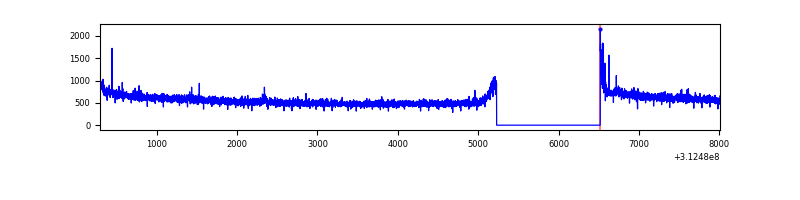 |
| D | 7714 | 6424 | 16 | 16 | 0.21% | 0.25% | 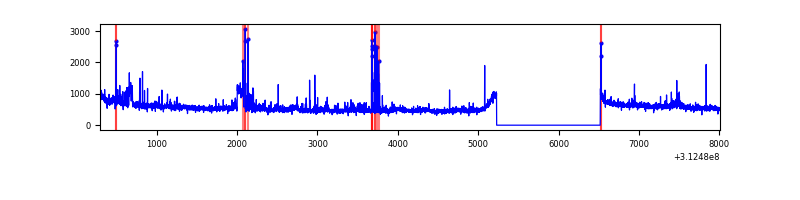 |
Top three noisy pixels from each quadrant. If the there are fewer than three noisy pixels in the level2.evt file, extra rows are filled as -1
| Pixel properties | Quadrant properties | ||||||
|---|---|---|---|---|---|---|---|
| Quadrant | DetID | PixID | Counts | Sigma | Mean | Median | Sigma |
| A | 13 | 34 | 84571 | 465.97 | 906 | 892 | 179.6 |
| A | 6 | 240 | 52262 | 286.06 | 906 | 892 | 179.6 |
| A | 3 | 1 | 33878 | 183.68 | 906 | 892 | 179.6 |
| B | 15 | 33 | 360454 | 2172.68 | 900 | 881 | 165.5 |
| B | 15 | 35 | 23194 | 134.82 | 900 | 881 | 165.5 |
| B | 12 | 111 | 18866 | 108.67 | 900 | 881 | 165.5 |
| C | 14 | 238 | 141194 | 691.4 | 885 | 895 | 202.9 |
| C | 0 | 10 | 36752 | 176.71 | 885 | 895 | 202.9 |
| C | 10 | 22 | 11202 | 50.79 | 885 | 895 | 202.9 |
| D | 1 | 52 | 251749 | 1161.92 | 896 | 872 | 215.9 |
| D | 7 | 223 | 26636 | 119.32 | 896 | 872 | 215.9 |
| D | 2 | 234 | 26171 | 117.17 | 896 | 872 | 215.9 |
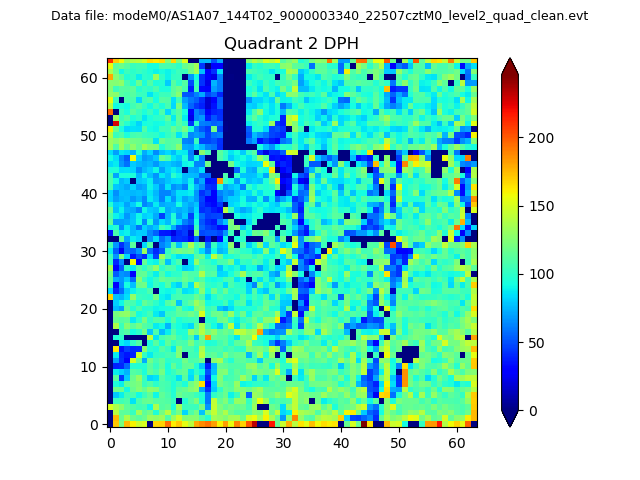
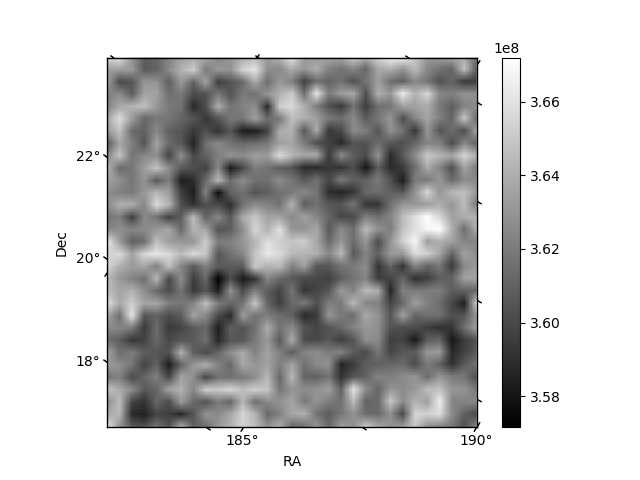
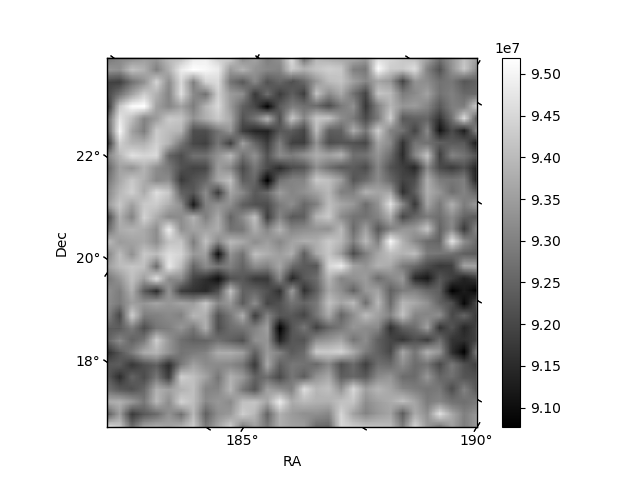
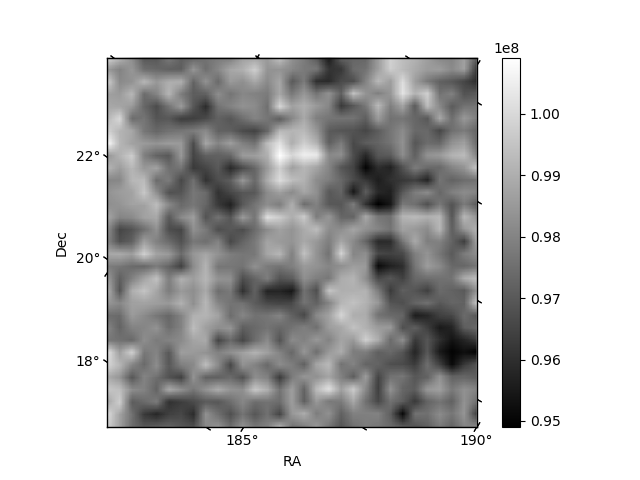
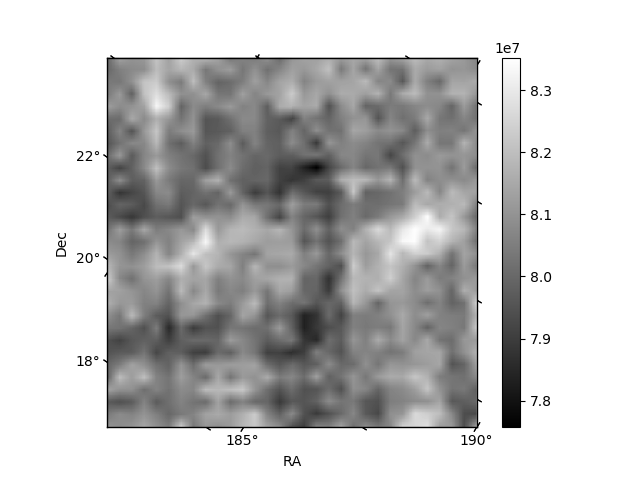
Histogram calculated using DETX and DETY for each event in the final _common_clean file
| Quadrant A | 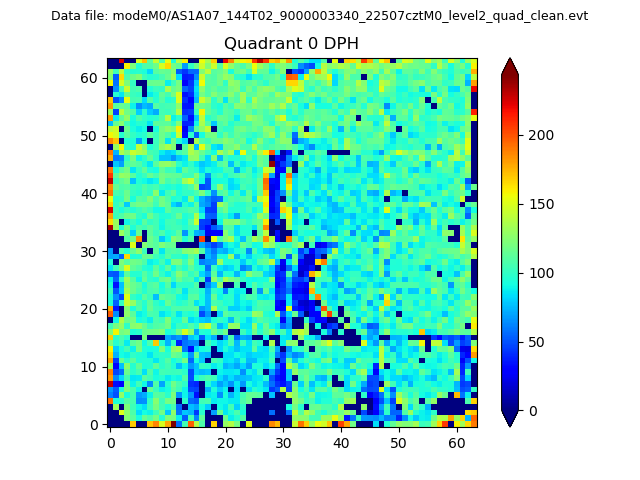 |
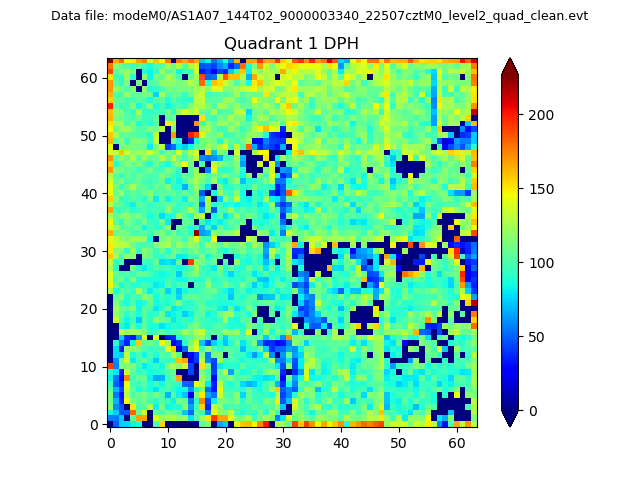 |
Quadrant B |
|---|---|---|---|
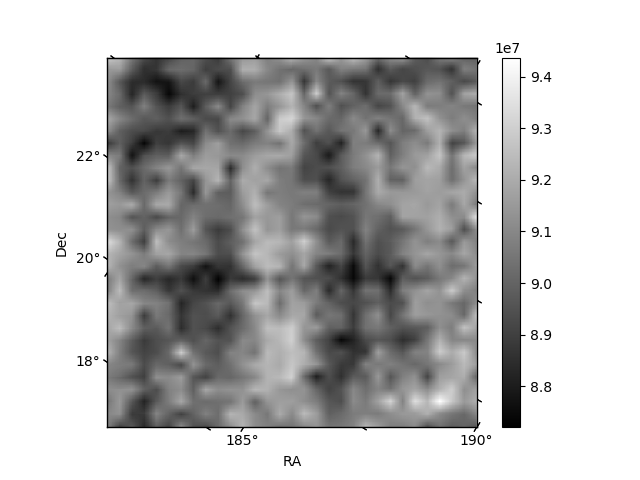
| Quadrant D | 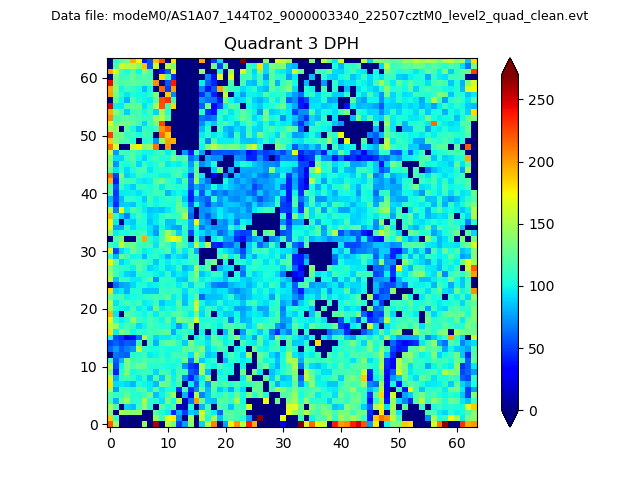 |
 |
Quadrant C |
| Plot type | Count rate plots | Images |
|---|---|---|
| Comparison with Poisson distribution Blue bars denote a histogram of data divided into 1 sec bins. Red curve is a Poisson curve with rate = median count rate of data. |
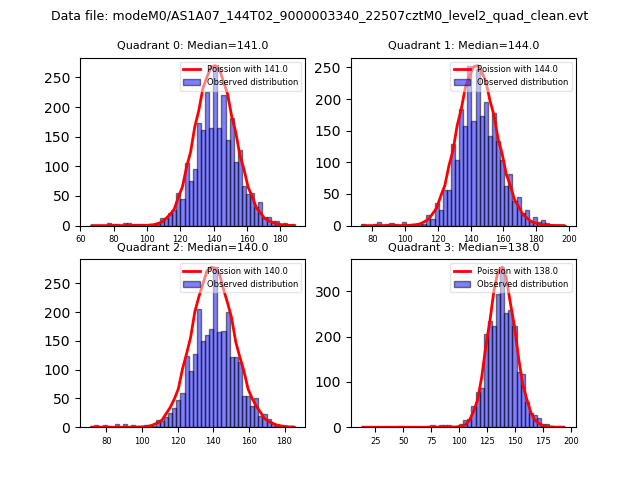 |
 |
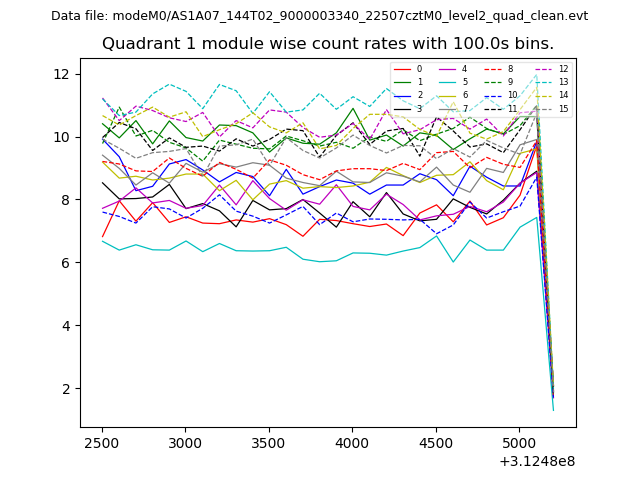
| Quadrant-wise count rates Data is divided into 100 sec bins |
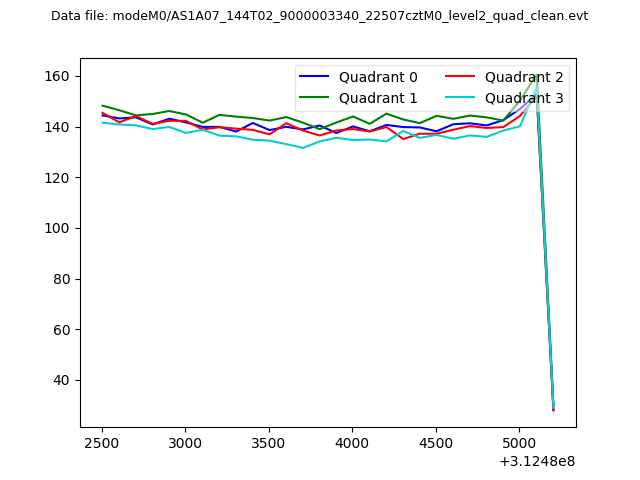 |
|
| Module-wise count rates for Quadrant A Data is divided into 100 sec bins |
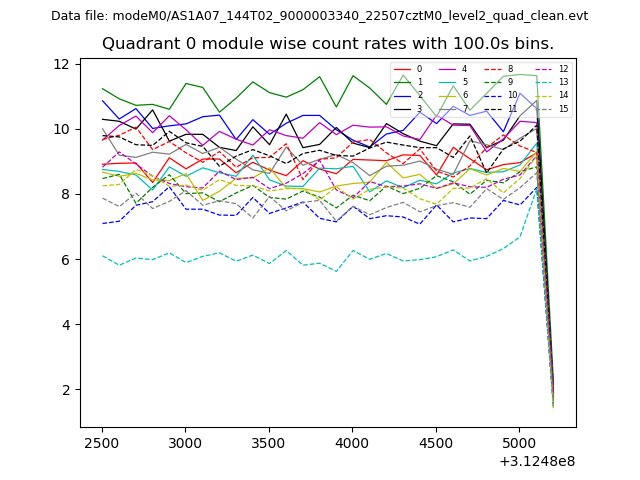 |
 |
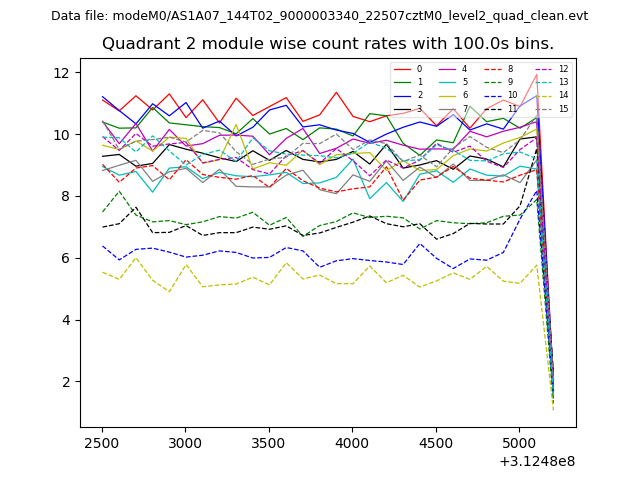
| Module-wise count rates for Quadrant B Data is divided into 100 sec bins |
 |
 |
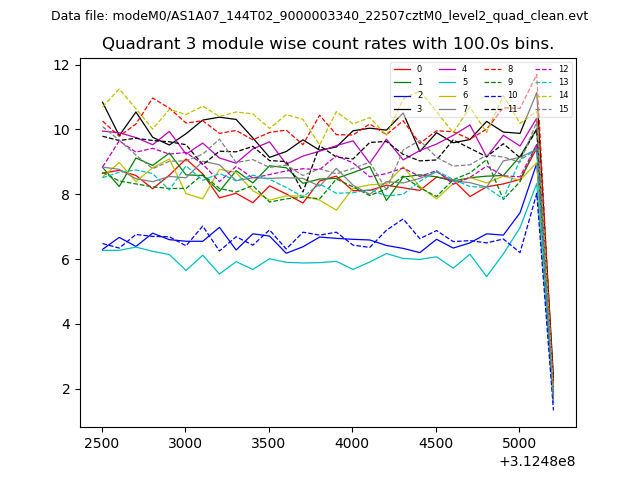
| Module-wise count rates for Quadrant C Data is divided into 100 sec bins |
 |
 |
| Module-wise count rates for Quadrant D Data is divided into 100 sec bins |
 |
 |
| Parameter | Plot |
|---|---|
| CZT HV Monitor | 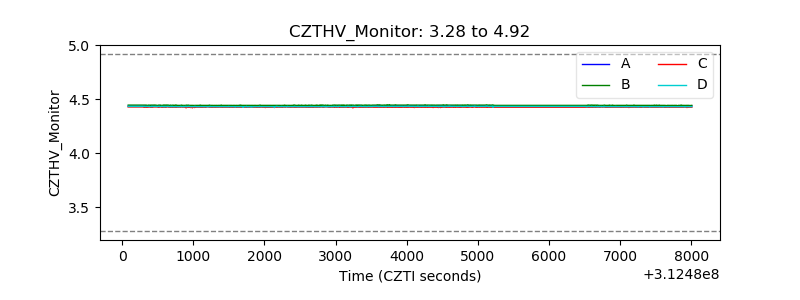 |
| D_VDD | 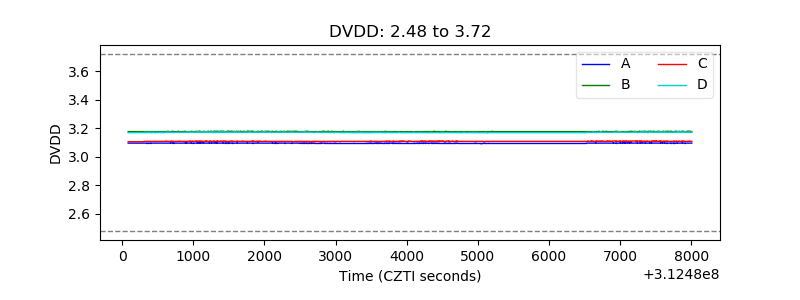 |
| Temperature 1 | 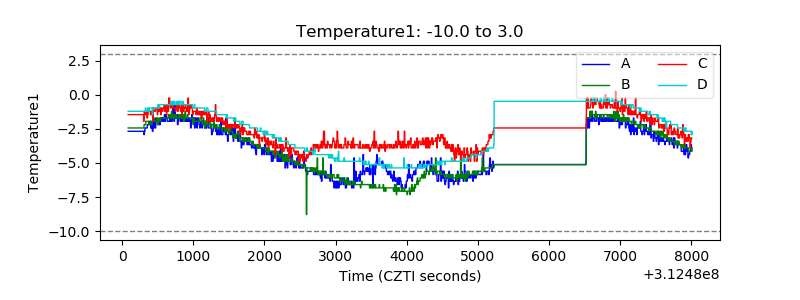 |
| Veto HV Monitor | 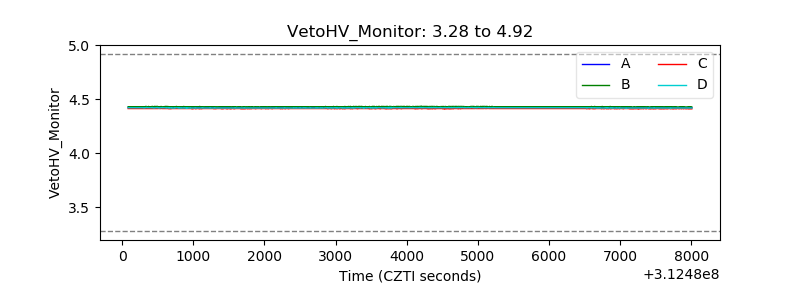 |
| Veto LLD | 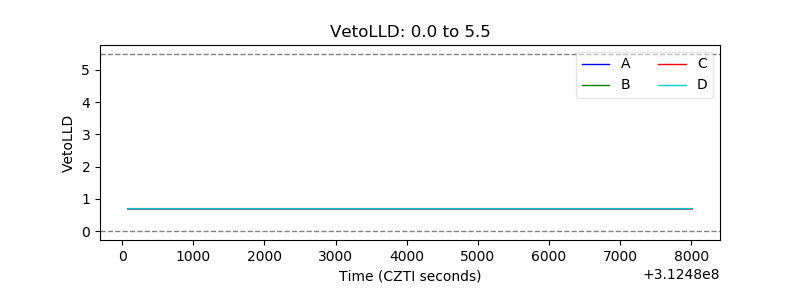 |
| Alpha Counter | 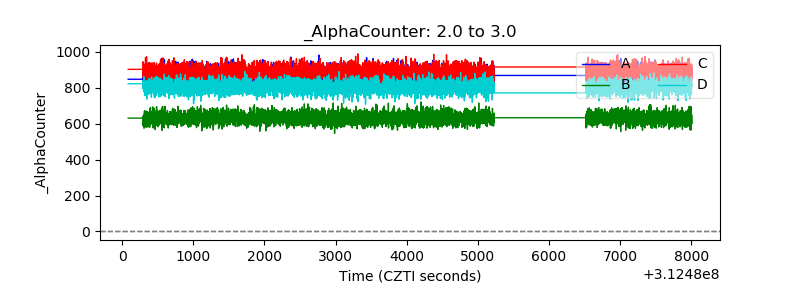 |
| _CPM_Rate | 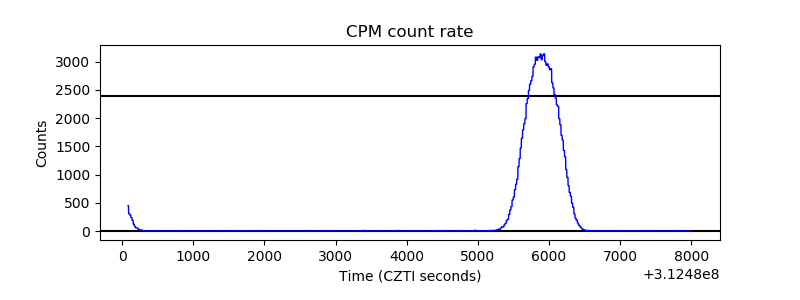 |
| CZT Counter | 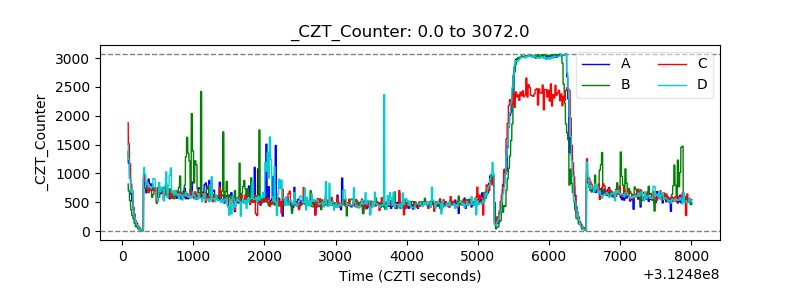 |
| +2.5 Volts monitor |  |
| +5 Volts monitor | 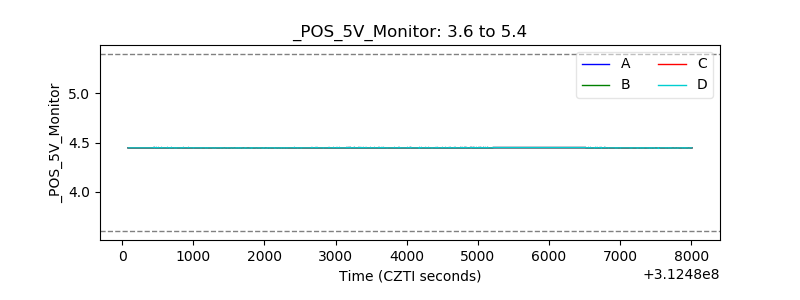 |
| _ROLL_ROT | 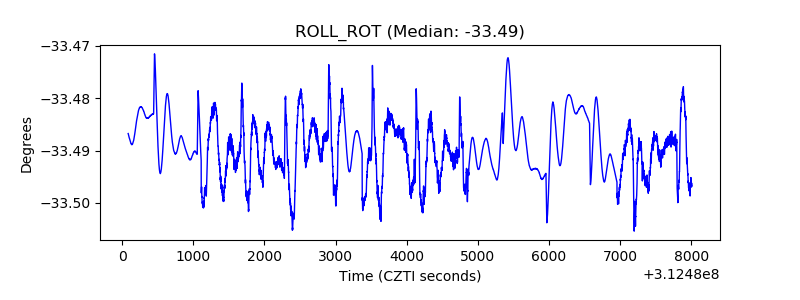 |
| _Roll_DEC | 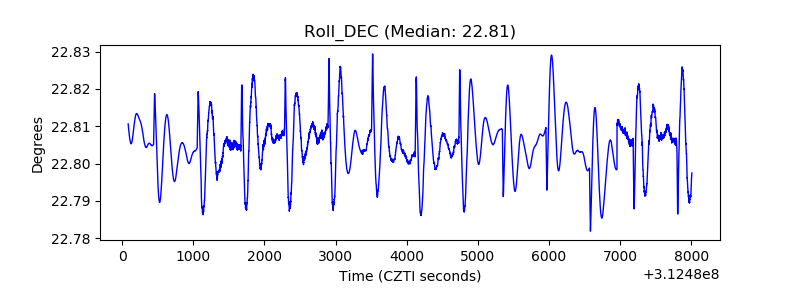 |
| _Roll_RA | 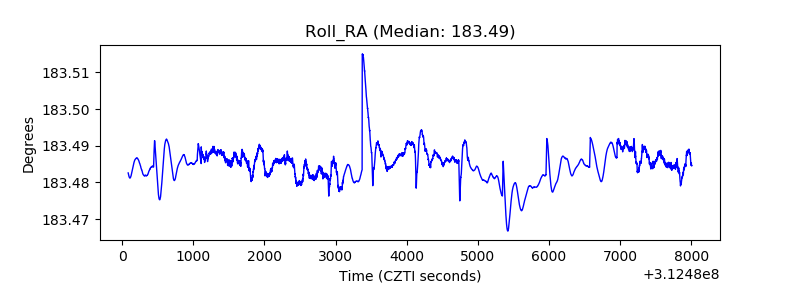 |
| Veto Counter | 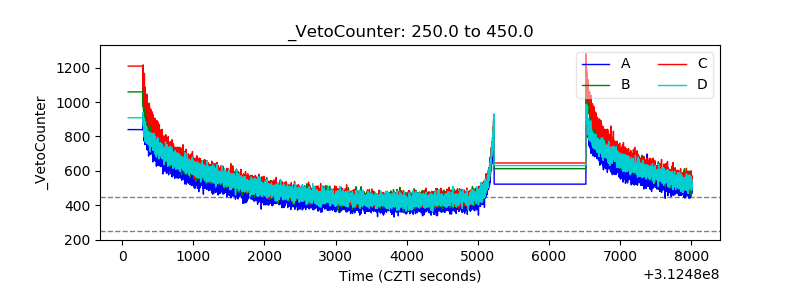 |