| Param | Original file | Final file |
|---|---|---|
| Filename | modeM0/AS1A07_144T02_9000003340_22508cztM0_level2.evt | modeM0/AS1A07_144T02_9000003340_22508cztM0_level2_quad_clean.evt |
| Size (bytes) | 466,652,160 | 72,780,480 |
| Size | 445.0 MB | 69.4 MB |
| Events in quadrant A | 3,310,635 | 444,941 |
| Events in quadrant B | 3,683,035 | 453,626 |
| Events in quadrant C | 3,405,849 | 444,145 |
| Events in quadrant D | 3,318,017 | 434,176 |
| Mode M9 | |||
|---|---|---|---|
| Quadrant | BADHDUFLAG | Total packets | Discarded packets |
| A | 0 | 13 | 0 |
| B | 0 | 13 | 0 |
| C | 0 | 13 | 0 |
| D | 0 | 13 | 0 |
| Mode SS | |||
|---|---|---|---|
| Quadrant | BADHDUFLAG | Total packets | Discarded packets |
| A | 0 | 124 | 0 |
| B | 0 | 124 | 0 |
| C | 0 | 124 | 0 |
| D | 0 | 124 | 0 |
| Mode M0 | |||
|---|---|---|---|
| Quadrant | BADHDUFLAG | Total packets | Discarded packets |
| A | 0 | 13779 | 1 |
| B | 0 | 14939 | 1 |
| C | 0 | 14123 | 1 |
| D | 0 | 13936 | 1 |
| Quadrant | Total seconds | Saturated seconds | Saturation percentage |
|---|---|---|---|
| A | 6114 | 83 | 1.357540% |
| B | 6115 | 136 | 2.224039% |
| C | 6115 | 142 | 2.322159% |
| D | 6115 | 80 | 1.308258% |
Noise dominated data is calculated using 1-second bins in cleaned event files. If a bin has >2000 counts, and if more than 50% of those come from <1% of pixels, then it is considered to be noise-dominated and hence unusable.
| Quadrant | # 1 sec bins | Bins with >0 counts | Bins with >2000 counts | High rate bins dominated by noise | Noise dominated (total time) | Noise dominated (detector-on time) | Marked lightcurve |
|---|---|---|---|---|---|---|---|
| A | 7434 | 6114 | 0 | 0 | 0.00% | 0.00% | 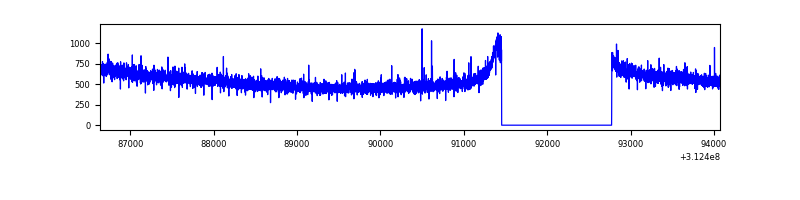 |
| B | 7435 | 6115 | 14 | 14 | 0.19% | 0.23% | 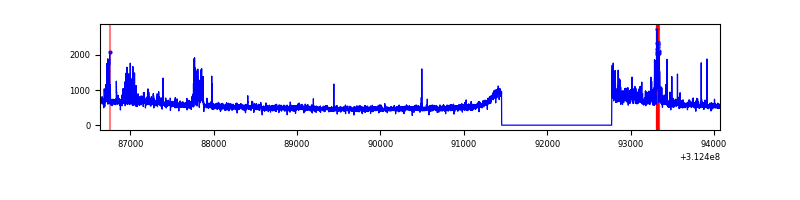 |
| C | 7435 | 6115 | 0 | 0 | 0.00% | 0.00% | 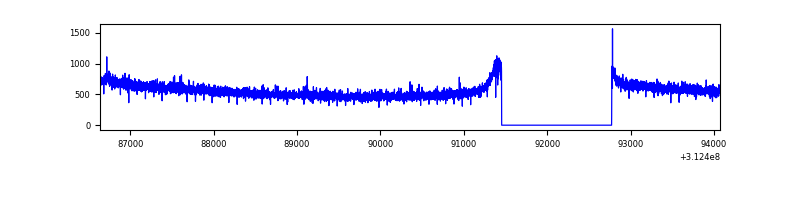 |
| D | 7435 | 6115 | 5 | 5 | 0.07% | 0.08% | 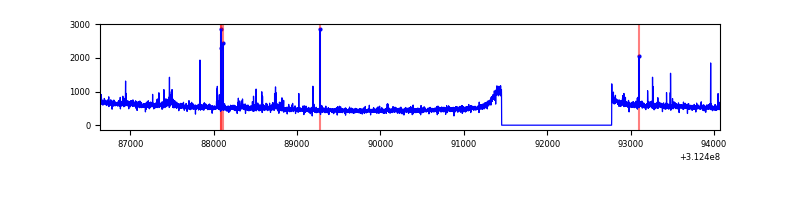 |
Top three noisy pixels from each quadrant. If the there are fewer than three noisy pixels in the level2.evt file, extra rows are filled as -1
| Pixel properties | Quadrant properties | ||||||
|---|---|---|---|---|---|---|---|
| Quadrant | DetID | PixID | Counts | Sigma | Mean | Median | Sigma |
| A | 13 | 254 | 10137 | 54.53 | 856 | 843 | 170.4 |
| A | 13 | 34 | 8587 | 45.44 | 856 | 843 | 170.4 |
| A | 0 | 226 | 7450 | 38.77 | 856 | 843 | 170.4 |
| B | 15 | 33 | 210106 | 1310.88 | 851 | 832 | 159.6 |
| B | 0 | 228 | 57767 | 356.64 | 851 | 832 | 159.6 |
| B | 15 | 35 | 56962 | 351.6 | 851 | 832 | 159.6 |
| C | 14 | 238 | 132920 | 686.72 | 835 | 846 | 192.3 |
| C | 10 | 22 | 9371 | 44.33 | 835 | 846 | 192.3 |
| C | 0 | 10 | 8286 | 38.68 | 835 | 846 | 192.3 |
| D | 0 | 11 | 47099 | 226.15 | 847 | 825 | 204.6 |
| D | 1 | 52 | 37957 | 181.47 | 847 | 825 | 204.6 |
| D | 2 | 234 | 24833 | 117.33 | 847 | 825 | 204.6 |
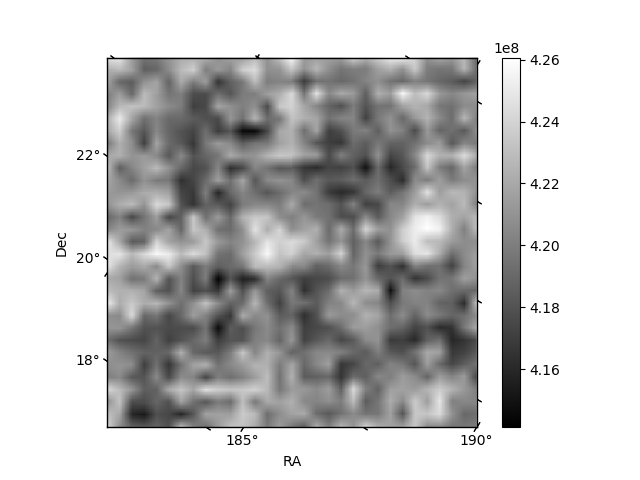
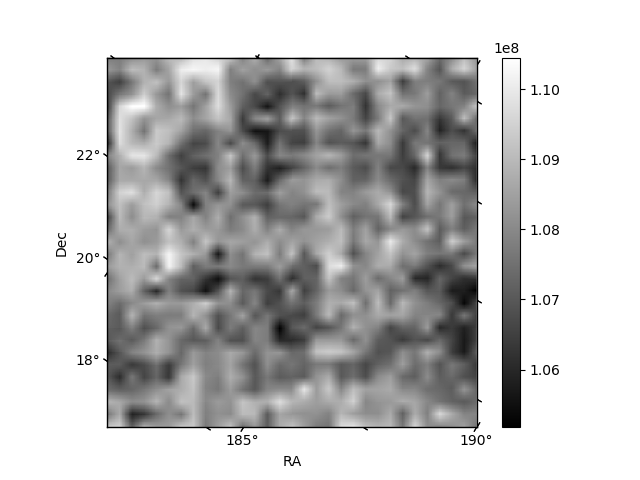
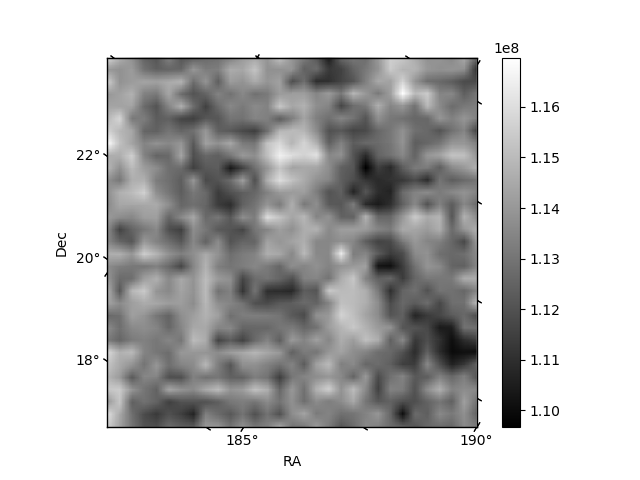
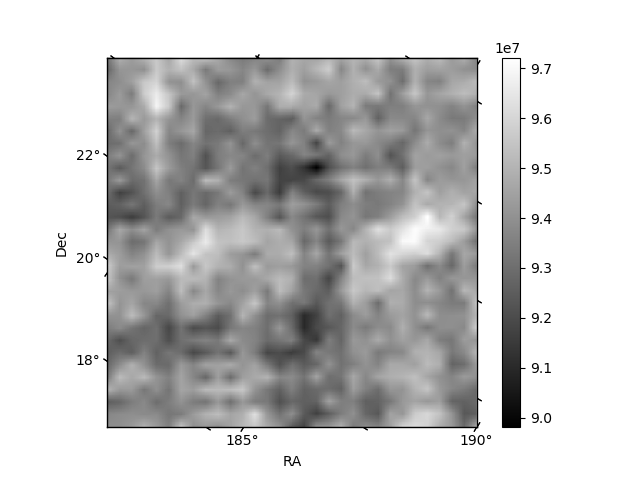
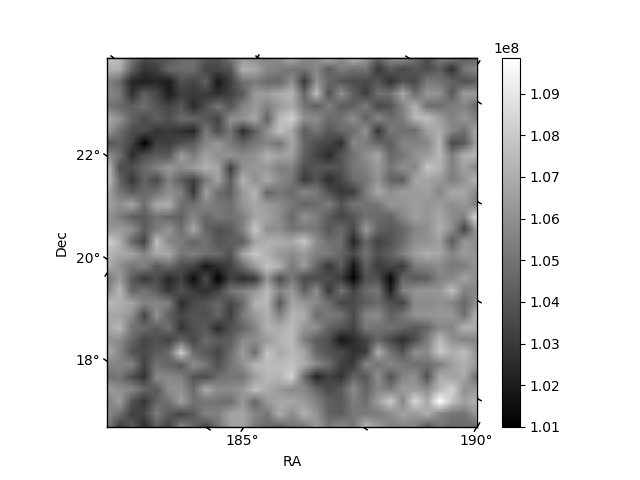
Histogram calculated using DETX and DETY for each event in the final _common_clean file
| Quadrant A | 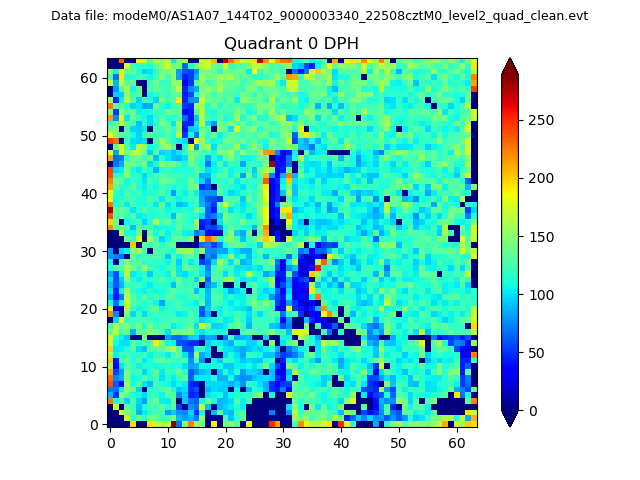 |
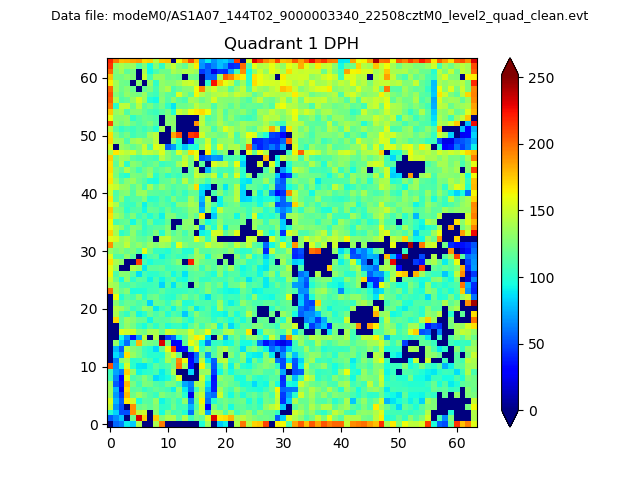 |
Quadrant B |
|---|---|---|---|
| Quadrant D | 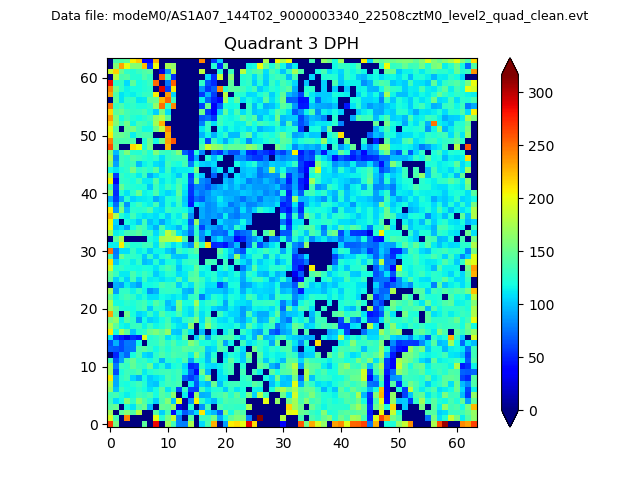 |
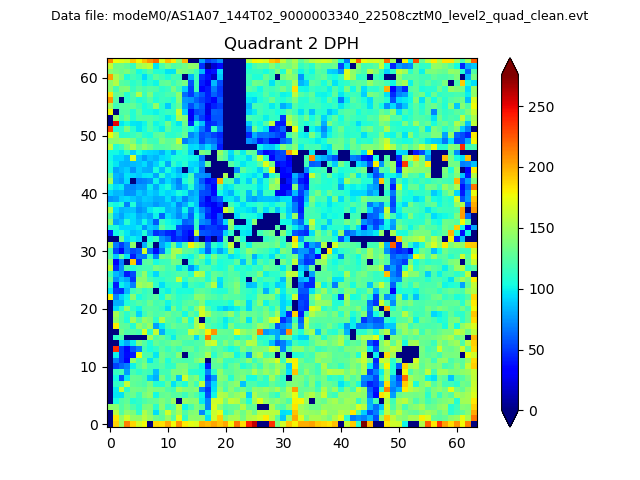 |
Quadrant C |
| Plot type | Count rate plots | Images |
|---|---|---|
| Comparison with Poisson distribution Blue bars denote a histogram of data divided into 1 sec bins. Red curve is a Poisson curve with rate = median count rate of data. |
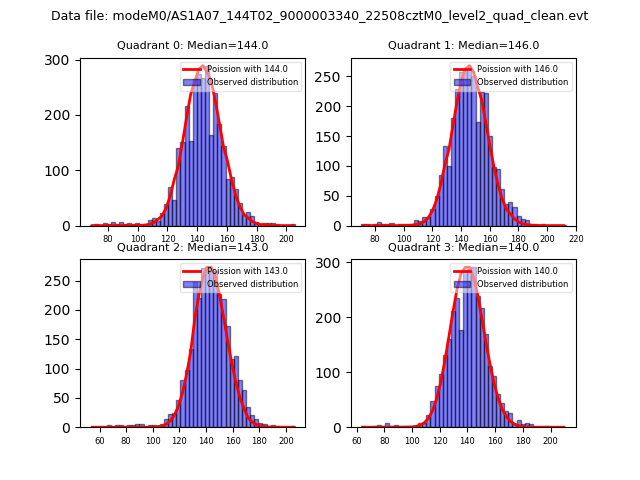 |
 |
| Quadrant-wise count rates Data is divided into 100 sec bins |
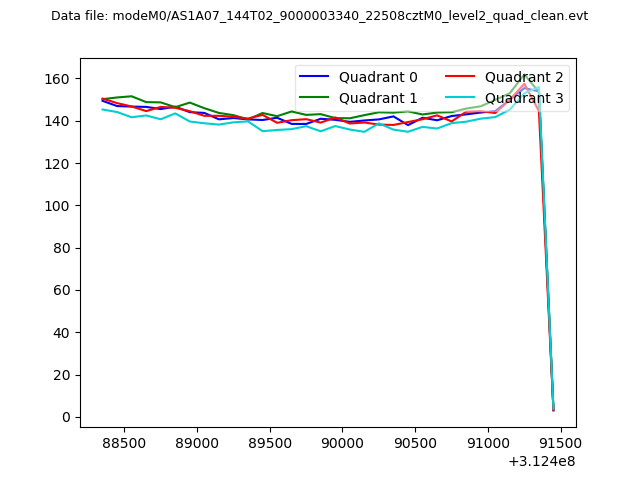 |
|
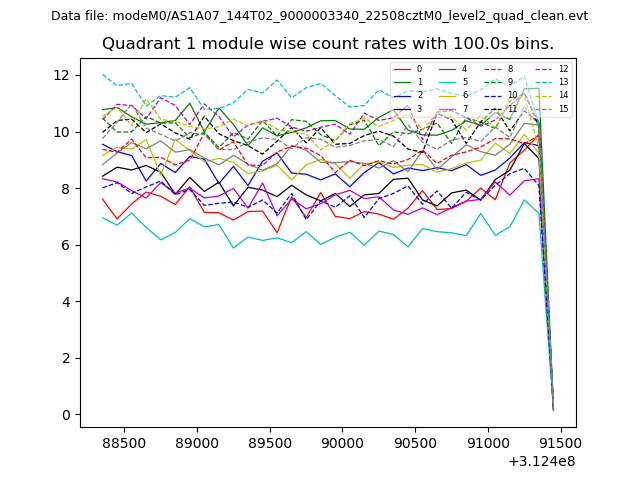
| Module-wise count rates for Quadrant A Data is divided into 100 sec bins |
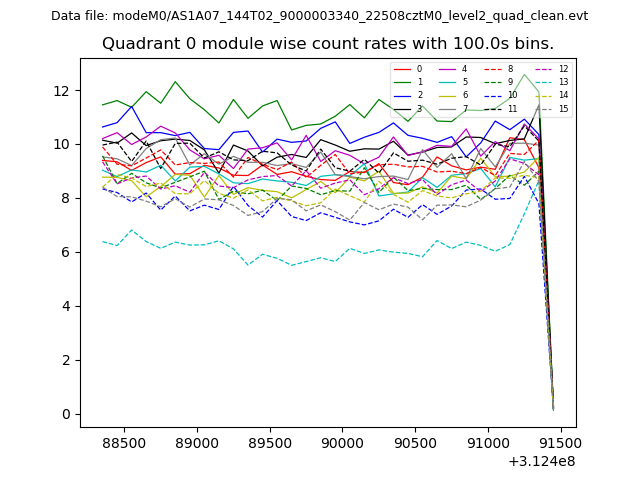 |
 |
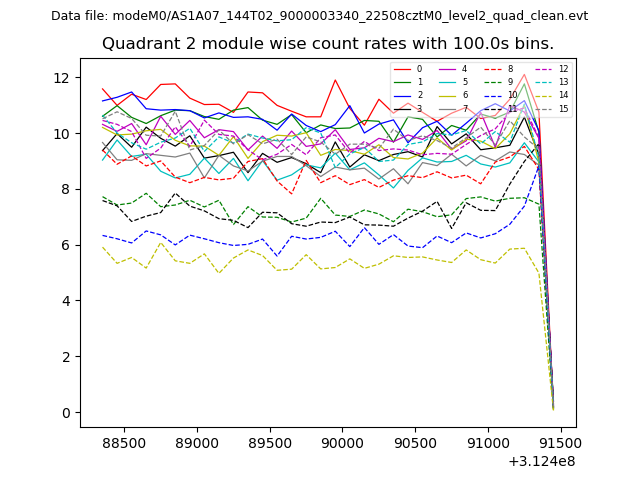
| Module-wise count rates for Quadrant B Data is divided into 100 sec bins |
 |
 |
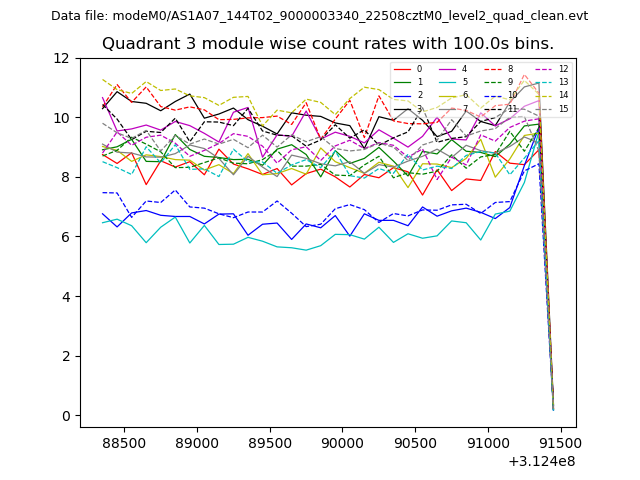
| Module-wise count rates for Quadrant C Data is divided into 100 sec bins |
 |
 |
| Module-wise count rates for Quadrant D Data is divided into 100 sec bins |
 |
 |
| Parameter | Plot |
|---|---|
| CZT HV Monitor | 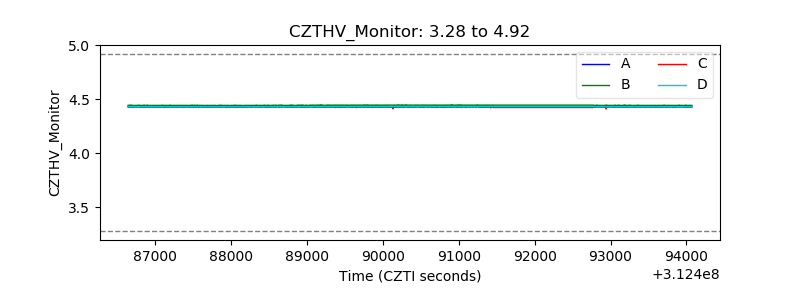 |
| D_VDD | 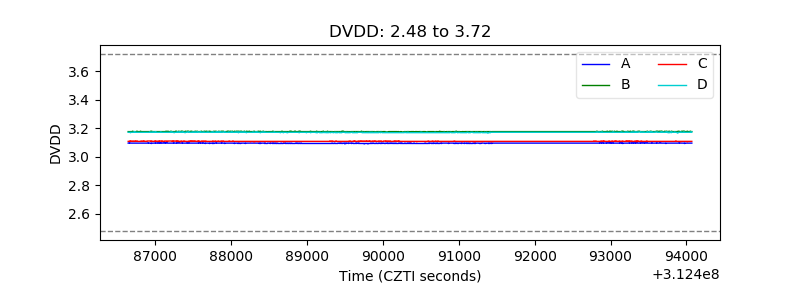 |
| Temperature 1 | 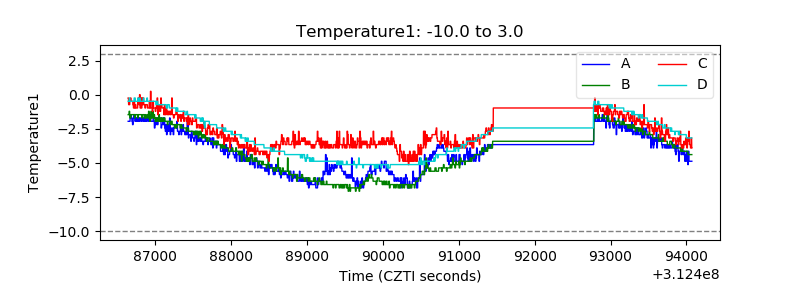 |
| Veto HV Monitor | 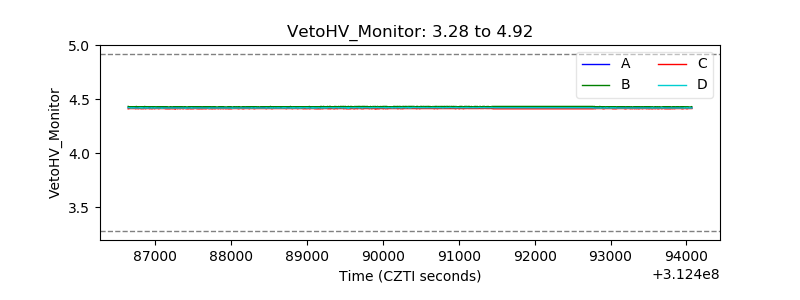 |
| Veto LLD | 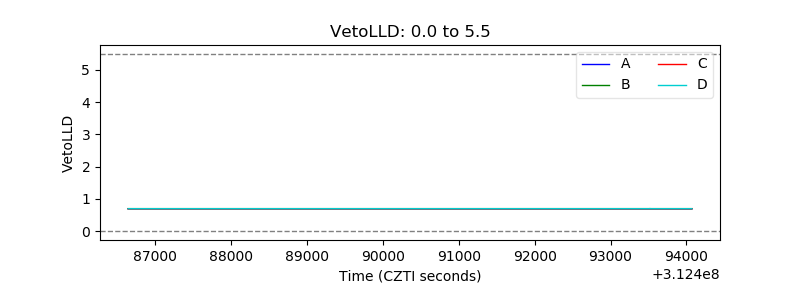 |
| Alpha Counter |  |
| _CPM_Rate | 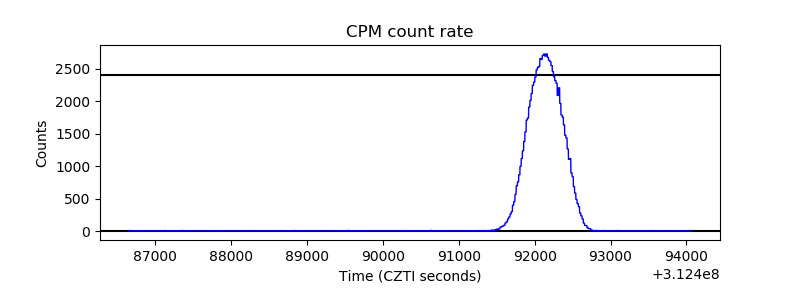 |
| CZT Counter | 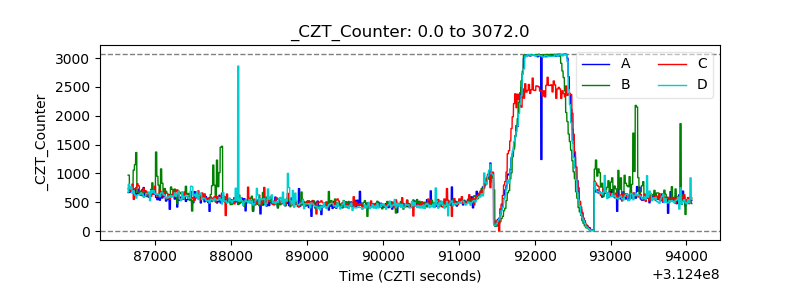 |
| +2.5 Volts monitor | 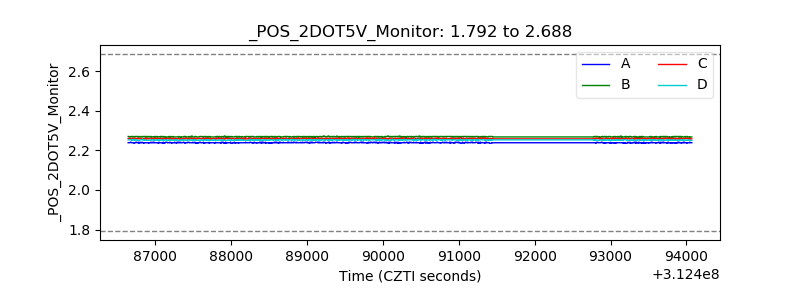 |
| +5 Volts monitor | 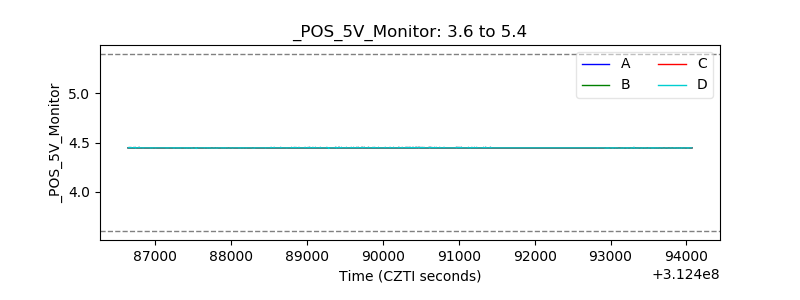 |
| _ROLL_ROT | 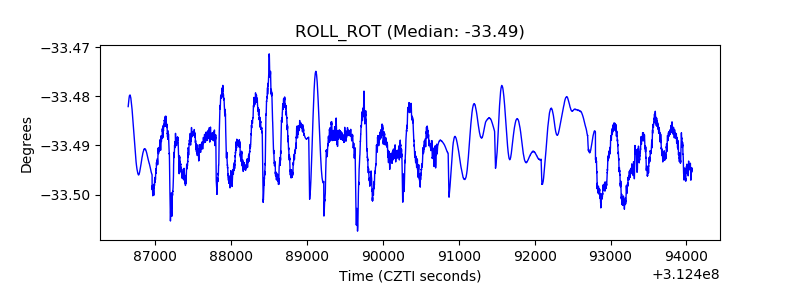 |
| _Roll_DEC |  |
| _Roll_RA | 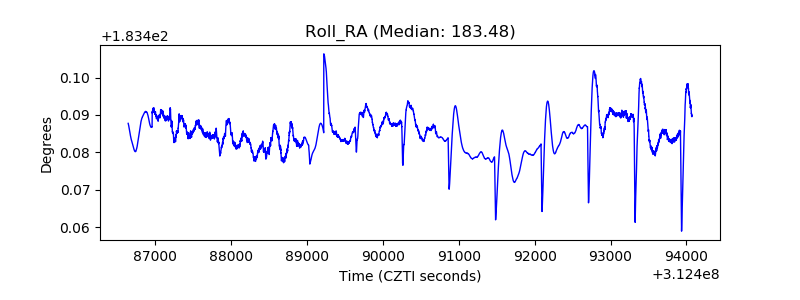 |
| Veto Counter | 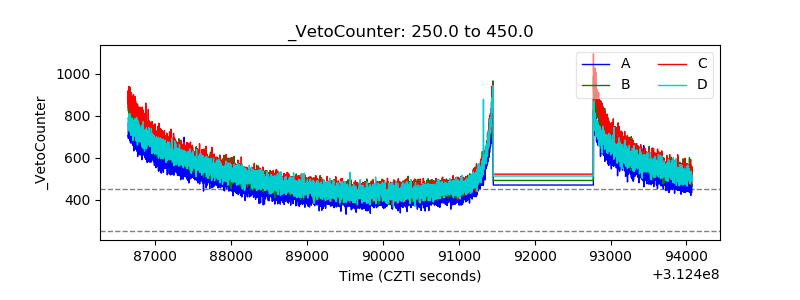 |