| Param | Original file | Final file |
|---|---|---|
| Filename | modeM0/AS1A07_144T02_9000003340_22509cztM0_level2.evt | modeM0/AS1A07_144T02_9000003340_22509cztM0_level2_quad_clean.evt |
| Size (bytes) | 189,627,840 | 25,943,040 |
| Size | 180.8 MB | 24.7 MB |
| Events in quadrant A | 1,332,921 | 152,194 |
| Events in quadrant B | 1,541,364 | 154,690 |
| Events in quadrant C | 1,377,030 | 151,679 |
| Events in quadrant D | 1,320,953 | 148,242 |
| Mode M9 | |||
|---|---|---|---|
| Quadrant | BADHDUFLAG | Total packets | Discarded packets |
| A | 0 | 10 | 0 |
| B | 0 | 11 | 0 |
| C | 0 | 11 | 0 |
| D | 0 | 11 | 0 |
| Mode SS | |||
|---|---|---|---|
| Quadrant | BADHDUFLAG | Total packets | Discarded packets |
| A | 0 | 50 | 0 |
| B | 0 | 50 | 0 |
| C | 0 | 50 | 0 |
| D | 0 | 50 | 0 |
| Mode M0 | |||
|---|---|---|---|
| Quadrant | BADHDUFLAG | Total packets | Discarded packets |
| A | 0 | 5539 | 1 |
| B | 0 | 6135 | 1 |
| C | 0 | 5675 | 1 |
| D | 0 | 5496 | 1 |
| Quadrant | Total seconds | Saturated seconds | Saturation percentage |
|---|---|---|---|
| A | 2479 | 8 | 0.322711% |
| B | 2479 | 43 | 1.734570% |
| C | 2479 | 33 | 1.331182% |
| D | 2479 | 10 | 0.403388% |
Noise dominated data is calculated using 1-second bins in cleaned event files. If a bin has >2000 counts, and if more than 50% of those come from <1% of pixels, then it is considered to be noise-dominated and hence unusable.
| Quadrant | # 1 sec bins | Bins with >0 counts | Bins with >2000 counts | High rate bins dominated by noise | Noise dominated (total time) | Noise dominated (detector-on time) | Marked lightcurve |
|---|---|---|---|---|---|---|---|
| A | 2479 | 2479 | 0 | 0 | 0.00% | 0.00% | 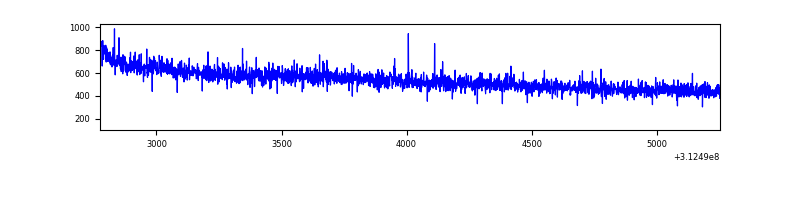 |
| B | 2479 | 2479 | 13 | 13 | 0.52% | 0.52% | 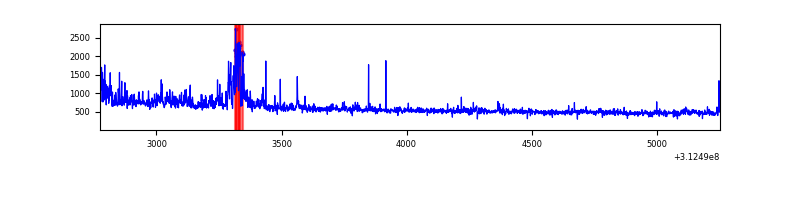 |
| C | 2479 | 2479 | 0 | 0 | 0.00% | 0.00% | 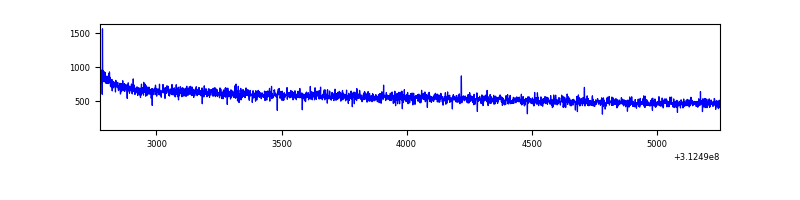 |
| D | 2479 | 2479 | 1 | 1 | 0.04% | 0.04% | 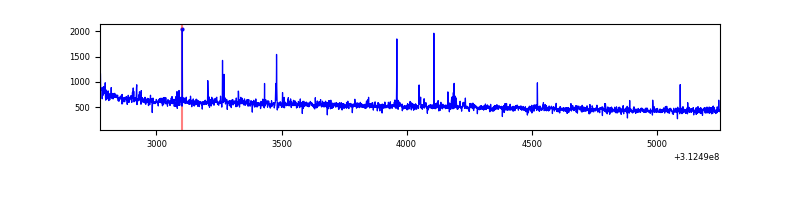 |
Top three noisy pixels from each quadrant. If the there are fewer than three noisy pixels in the level2.evt file, extra rows are filled as -1
| Pixel properties | Quadrant properties | ||||||
|---|---|---|---|---|---|---|---|
| Quadrant | DetID | PixID | Counts | Sigma | Mean | Median | Sigma |
| A | 13 | 254 | 4335 | 56.75 | 345 | 339 | 70.4 |
| A | 0 | 226 | 3074 | 38.84 | 345 | 339 | 70.4 |
| A | 3 | 137 | 2720 | 33.81 | 345 | 339 | 70.4 |
| B | 15 | 33 | 74257 | 1136.67 | 345 | 338 | 65.0 |
| B | 0 | 228 | 53226 | 813.27 | 345 | 338 | 65.0 |
| B | 15 | 35 | 36683 | 558.88 | 345 | 338 | 65.0 |
| C | 14 | 238 | 54683 | 688.16 | 338 | 340 | 79.0 |
| C | 0 | 10 | 3496 | 39.97 | 338 | 340 | 79.0 |
| C | 13 | 61 | 2295 | 24.76 | 338 | 340 | 79.0 |
| D | 1 | 52 | 16465 | 193.11 | 341 | 332 | 83.5 |
| D | 2 | 234 | 9845 | 113.87 | 341 | 332 | 83.5 |
| D | 2 | 120 | 6171 | 69.89 | 341 | 332 | 83.5 |
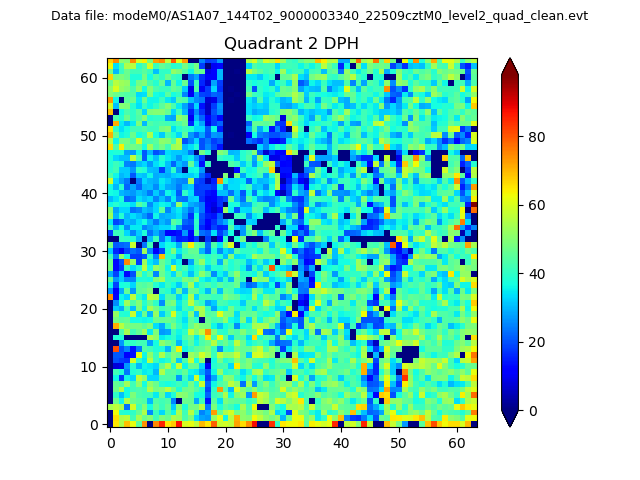
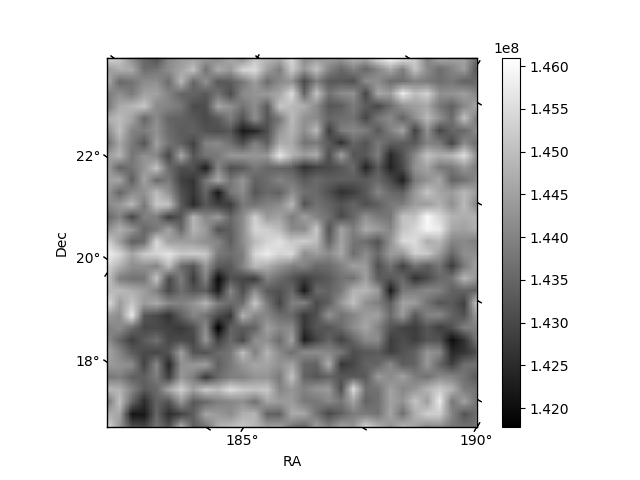
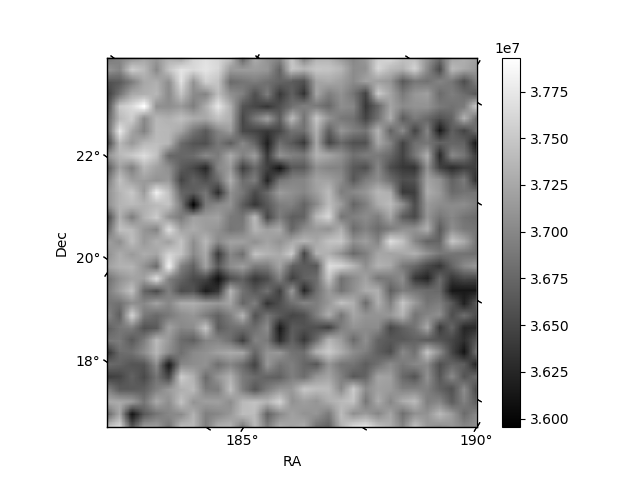
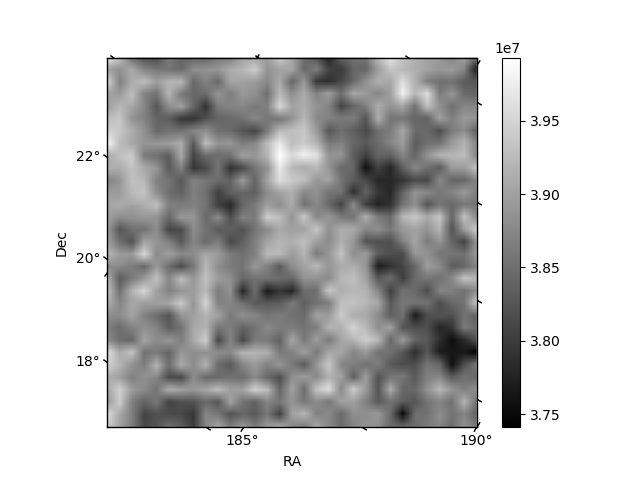
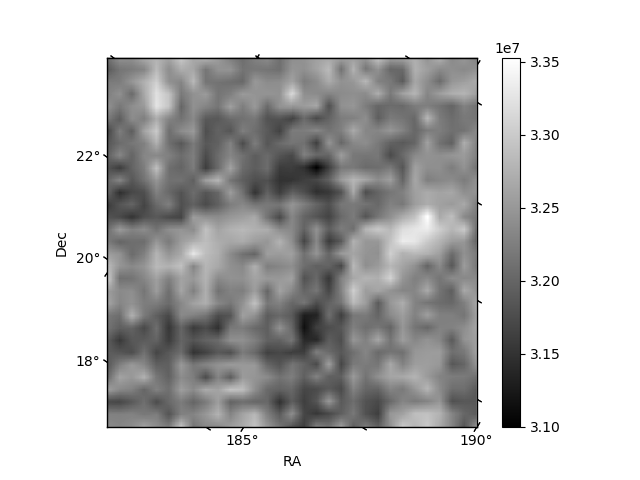
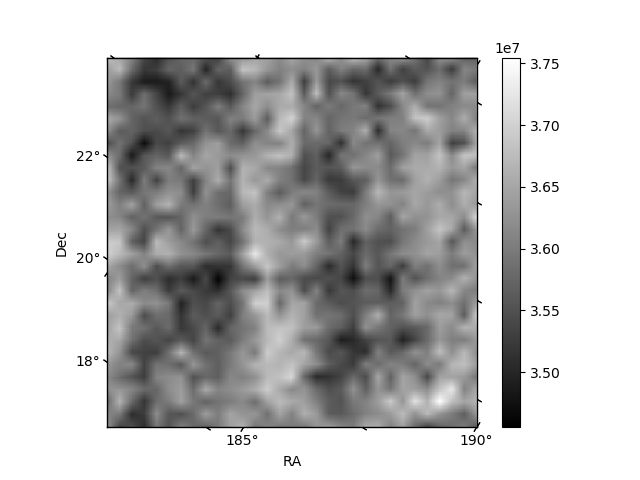
Histogram calculated using DETX and DETY for each event in the final _common_clean file
| Quadrant A | 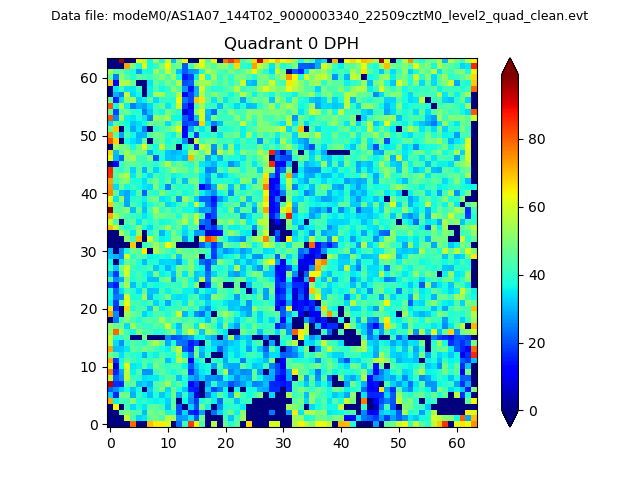 |
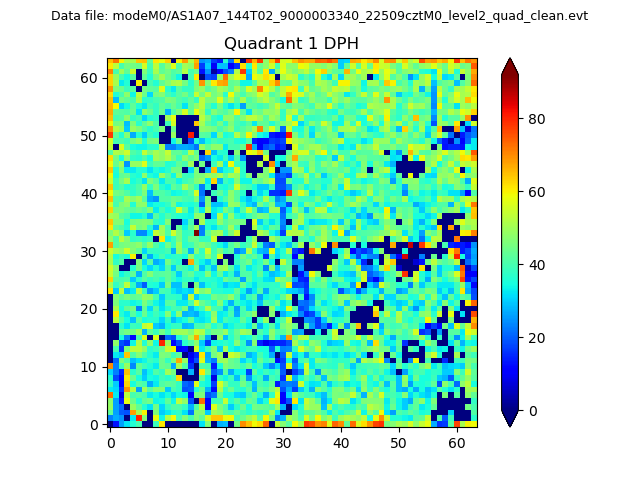 |
Quadrant B |
|---|---|---|---|
| Quadrant D | 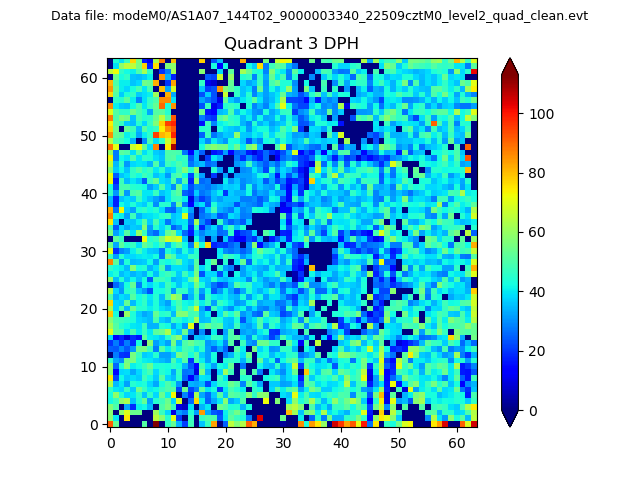 |
 |
Quadrant C |
| Plot type | Count rate plots | Images |
|---|---|---|
| Comparison with Poisson distribution Blue bars denote a histogram of data divided into 1 sec bins. Red curve is a Poisson curve with rate = median count rate of data. |
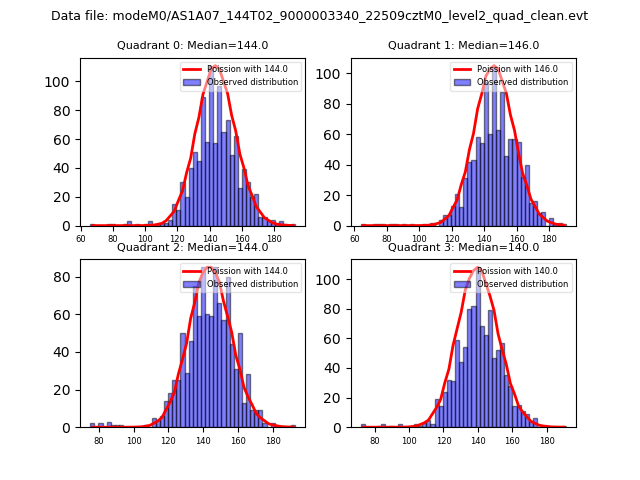 |
 |
| Quadrant-wise count rates Data is divided into 100 sec bins |
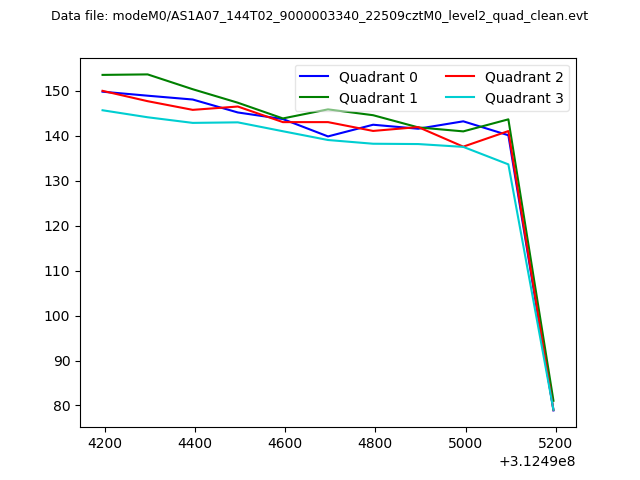 |
|
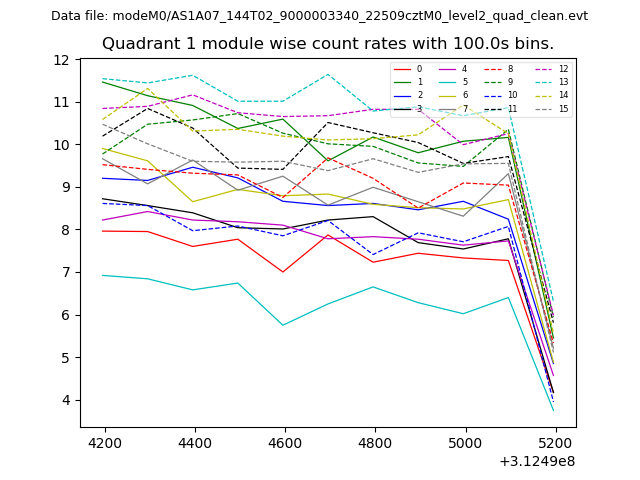
| Module-wise count rates for Quadrant A Data is divided into 100 sec bins |
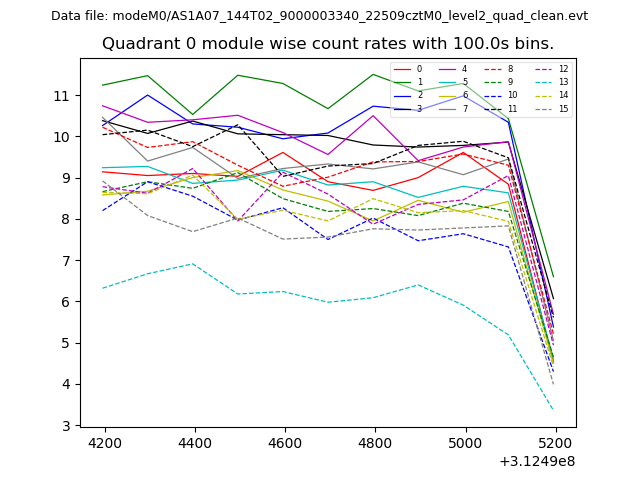 |
 |
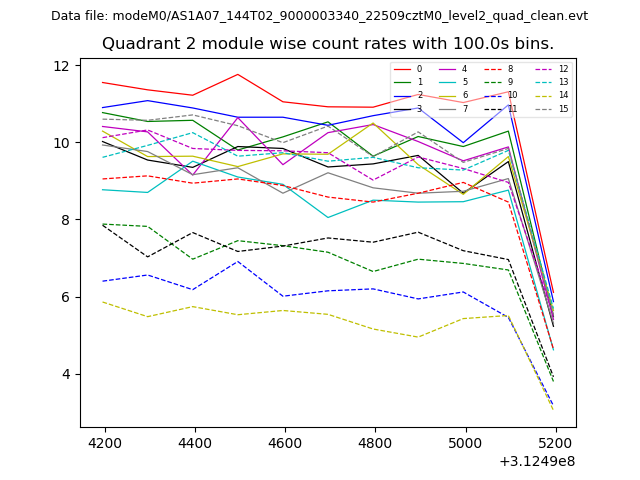
| Module-wise count rates for Quadrant B Data is divided into 100 sec bins |
 |
 |
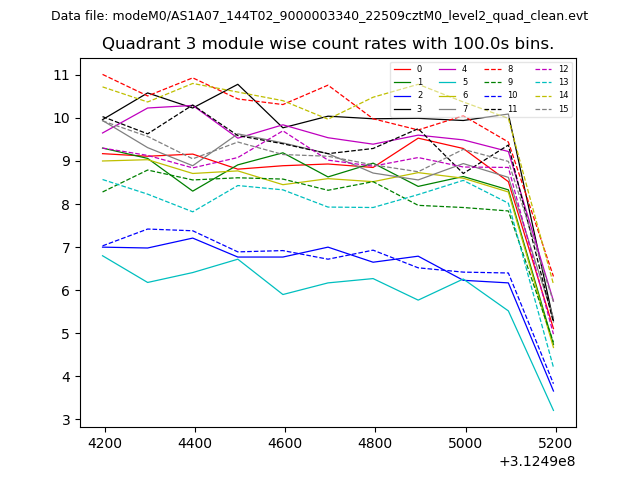
| Module-wise count rates for Quadrant C Data is divided into 100 sec bins |
 |
 |
| Module-wise count rates for Quadrant D Data is divided into 100 sec bins |
 |
 |
| Parameter | Plot |
|---|---|
| CZT HV Monitor | 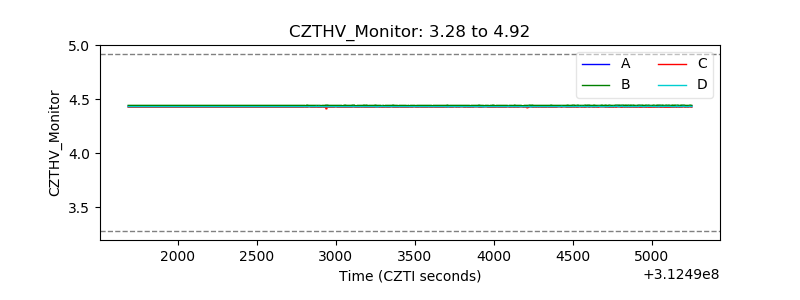 |
| D_VDD | 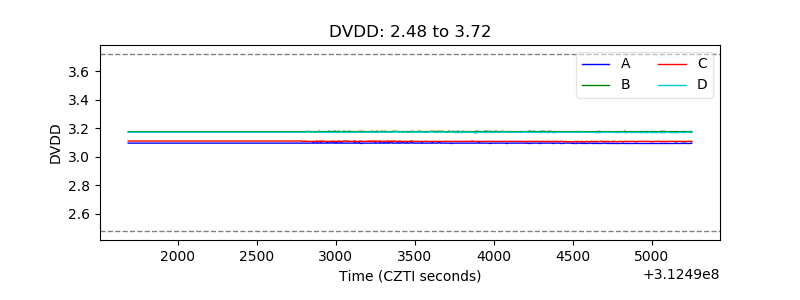 |
| Temperature 1 | 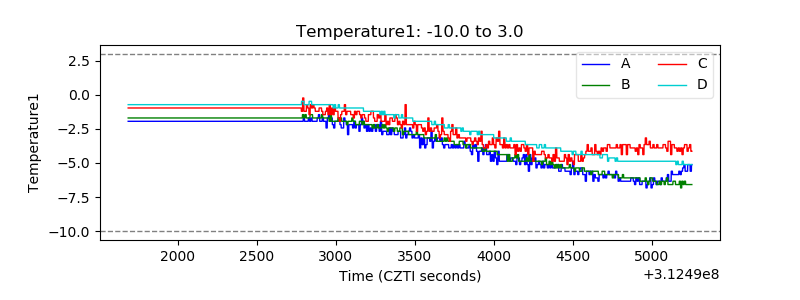 |
| Veto HV Monitor | 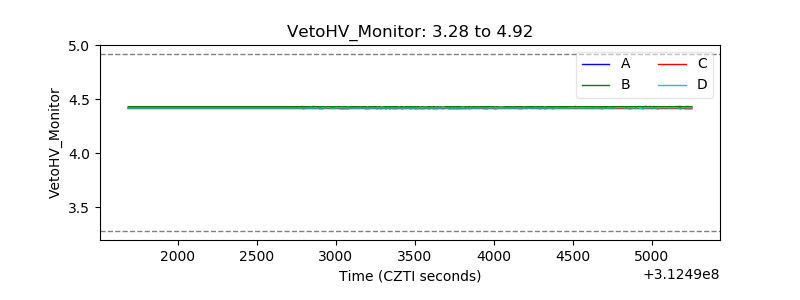 |
| Veto LLD | 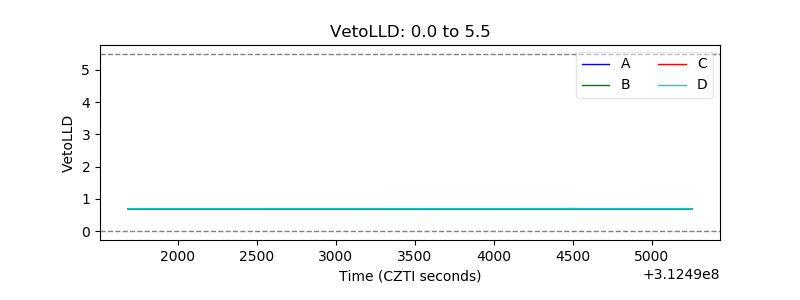 |
| Alpha Counter | 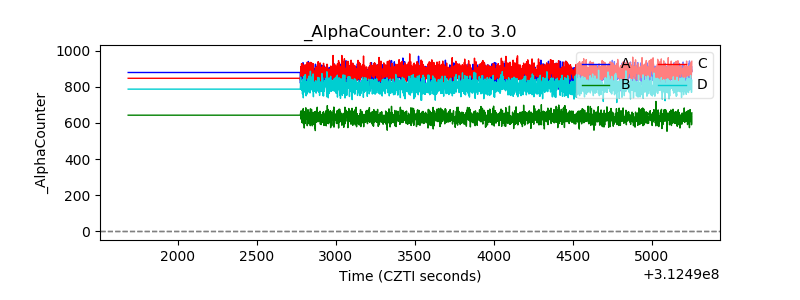 |
| _CPM_Rate | 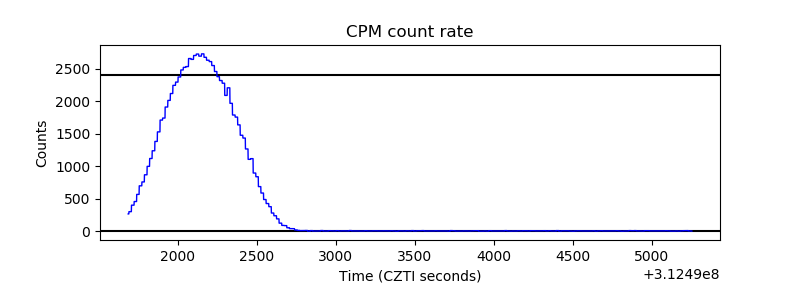 |
| CZT Counter |  |
| +2.5 Volts monitor |  |
| +5 Volts monitor | 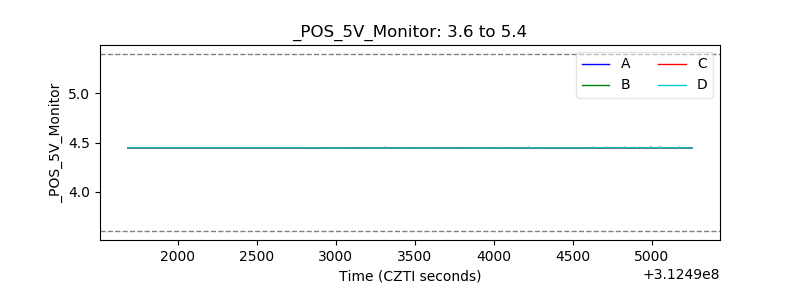 |
| _ROLL_ROT | 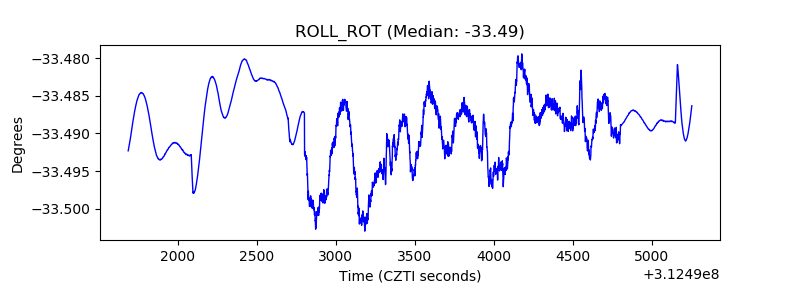 |
| _Roll_DEC | 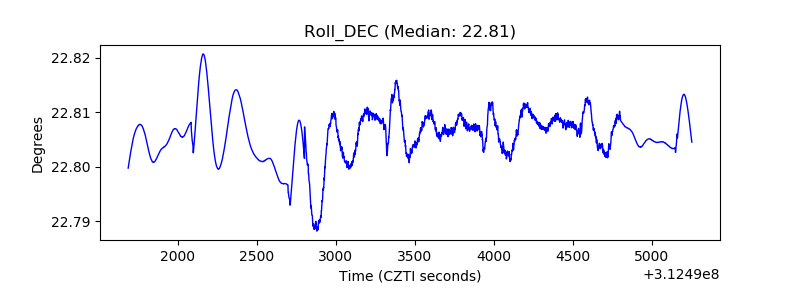 |
| _Roll_RA |  |
| Veto Counter | 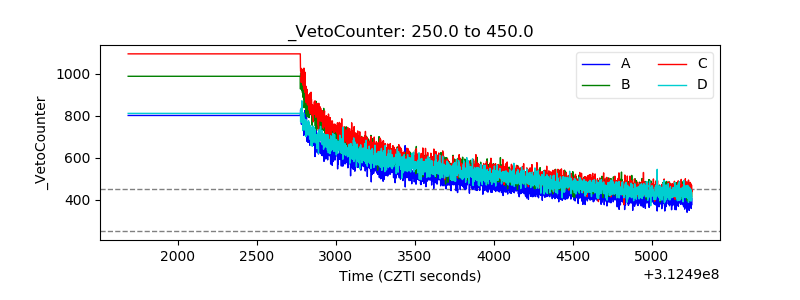 |