| Param | Original file | Final file |
|---|---|---|
| Filename | modeM0/AS1A08_003T01_9000003342cztM0_level2.fits | modeM0/AS1A08_003T01_9000003342cztM0_level2_quad_clean.evt |
| Size (bytes) | 1,110,070,080 | 1,052,599,680 |
| Size | 1.0 GB | 1003.8 MB |
| Events in quadrant A | 6,853,924 | 6,278,289 |
| Events in quadrant B | 6,554,712 | 6,337,401 |
| Events in quadrant C | 6,734,048 | 6,080,554 |
| Events in quadrant D | 5,830,370 | 5,538,403 |
| Mode M9 | |||
|---|---|---|---|
| Quadrant | BADHDUFLAG | Total packets | Discarded packets |
| A | 0 | 162 | 0 |
| B | 0 | 162 | 0 |
| C | 0 | 162 | 0 |
| D | 0 | 162 | 0 |
| Mode M0 | |||
|---|---|---|---|
| Quadrant | BADHDUFLAG | Total packets | Discarded packets |
| A | 0 | 232691 | 0 |
| B | 0 | 245545 | 0 |
| C | 0 | 234841 | 0 |
| D | 0 | 283191 | 0 |
| Mode SS | |||
|---|---|---|---|
| Quadrant | BADHDUFLAG | Total packets | Discarded packets |
| A | 0 | 2272 | 0 |
| B | 0 | 2272 | 0 |
| C | 0 | 2272 | 0 |
| D | 0 | 2272 | 0 |
| Quadrant | Total seconds | Saturated seconds | Saturation percentage |
|---|---|---|---|
| A | 111543 | 1101 | 0.987063% |
| B | 111543 | 2240 | 2.008194% |
| C | 111543 | 1965 | 1.761652% |
| D | 111543 | 4494 | 4.028940% |
Noise dominated data is calculated using 1-second bins in cleaned event files. If a bin has >2000 counts, and if more than 50% of those come from <1% of pixels, then it is considered to be noise-dominated and hence unusable.
| Quadrant | # 1 sec bins | Bins with >0 counts | Bins with >2000 counts | High rate bins dominated by noise | Noise dominated (total time) | Noise dominated (detector-on time) | Marked lightcurve |
|---|---|---|---|---|---|---|---|
| A | 127768 | 111524 | 0 | 0 | 0.00% | 0.00% |  |
| B | 127769 | 111523 | 0 | 0 | 0.00% | 0.00% |  |
| C | 127768 | 111521 | 0 | 0 | 0.00% | 0.00% |  |
| D | 127769 | 111452 | 0 | 0 | 0.00% | 0.00% |  |
Top three noisy pixels from each quadrant. If the there are fewer than three noisy pixels in the level2.evt file, extra rows are filled as -1
| Pixel properties | Quadrant properties | ||||||
|---|---|---|---|---|---|---|---|
| Quadrant | DetID | PixID | Counts | Sigma | Mean | Median | Sigma |
| A | 0 | 29 | 6527 | 11.09 | 1780 | 1667 | 438.1 |
| A | 7 | 110 | 5468 | 8.68 | 1780 | 1667 | 438.1 |
| A | 0 | 30 | 5101 | 7.84 | 1780 | 1667 | 438.1 |
| B | 2 | 9 | 5302 | 10.85 | 1729 | 1647 | 336.7 |
| B | 2 | 8 | 4391 | 8.15 | 1729 | 1647 | 336.7 |
| B | 3 | 17 | 4310 | 7.91 | 1729 | 1647 | 336.7 |
| C | 3 | 234 | 4759 | 6.86 | 1779 | 1665 | 450.9 |
| C | 12 | 241 | 4569 | 6.44 | 1779 | 1665 | 450.9 |
| C | 3 | 235 | 4562 | 6.42 | 1779 | 1665 | 450.9 |
| D | 15 | 46 | 4177 | 6.1 | 1661 | 1518 | 435.6 |
| D | 3 | 14 | 4155 | 6.05 | 1661 | 1518 | 435.6 |
| D | 6 | 231 | 4087 | 5.9 | 1661 | 1518 | 435.6 |
Histogram calculated using DETX and DETY for each event in the final _common_clean file
| Quadrant A | 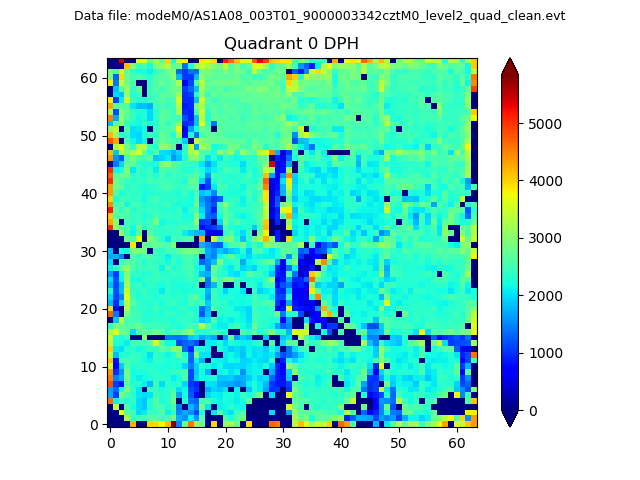 |
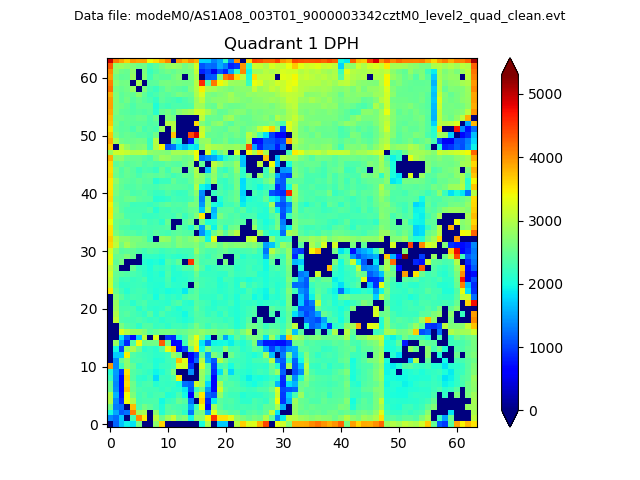 |
Quadrant B |
|---|---|---|---|
| Quadrant D |  |
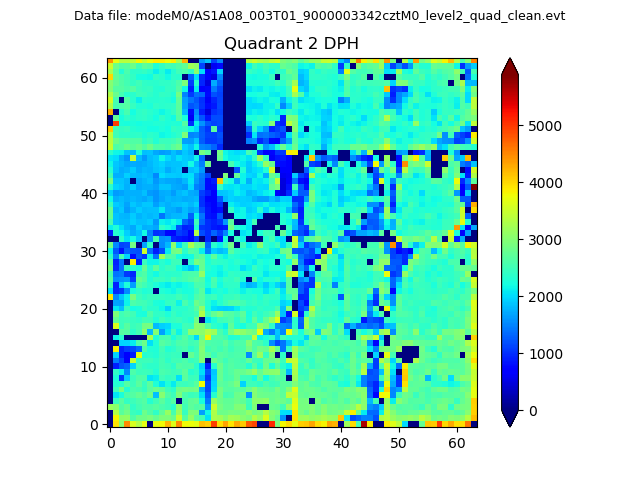 |
Quadrant C |
| Plot type | Count rate plots | Images |
|---|---|---|
| Comparison with Poisson distribution Blue bars denote a histogram of data divided into 1 sec bins. Red curve is a Poisson curve with rate = median count rate of data. |
 |
 |
| Quadrant-wise count rates Data is divided into 100 sec bins |
 |
|
| Module-wise count rates for Quadrant A Data is divided into 100 sec bins |
 |
 |
| Module-wise count rates for Quadrant B Data is divided into 100 sec bins |
 |
 |
| Module-wise count rates for Quadrant C Data is divided into 100 sec bins |
 |
 |
| Module-wise count rates for Quadrant D Data is divided into 100 sec bins |
 |
 |
| Parameter | Plot |
|---|---|
| CZT HV Monitor |  |
| D_VDD | 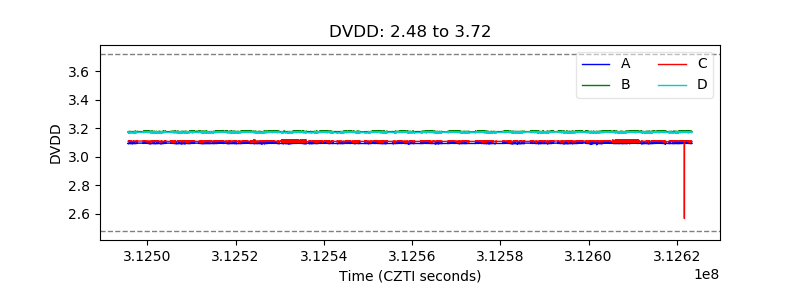 |
| Temperature 1 |  |
| Veto HV Monitor |  |
| Veto LLD |  |
| Alpha Counter |  |
| _CPM_Rate |  |
| CZT Counter |  |
| +2.5 Volts monitor |  |
| +5 Volts monitor |  |
| _ROLL_ROT | 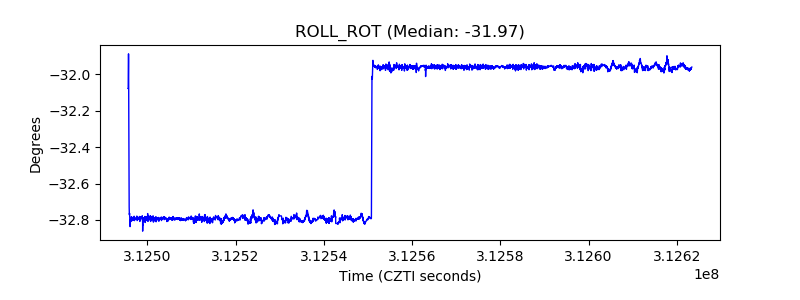 |
| _Roll_DEC |  |
| _Roll_RA |  |
| Veto Counter |  |