| Param | Original file | Final file |
|---|---|---|
| Filename | modeM0/AS1A08_003T01_9000003342_22509cztM0_level2.evt | modeM0/AS1A08_003T01_9000003342_22509cztM0_level2_quad_clean.evt |
| Size (bytes) | 249,122,880 | 49,400,640 |
| Size | 237.6 MB | 47.1 MB |
| Events in quadrant A | 1,752,692 | 315,403 |
| Events in quadrant B | 1,907,146 | 321,911 |
| Events in quadrant C | 1,810,731 | 314,326 |
| Events in quadrant D | 1,846,956 | 308,399 |
| Mode M9 | |||
|---|---|---|---|
| Quadrant | BADHDUFLAG | Total packets | Discarded packets |
| A | 0 | 13 | 0 |
| B | 0 | 13 | 0 |
| C | 0 | 13 | 0 |
| D | 0 | 13 | 0 |
| Mode M0 | |||
|---|---|---|---|
| Quadrant | BADHDUFLAG | Total packets | Discarded packets |
| A | 0 | 7291 | 1 |
| B | 0 | 7759 | 1 |
| C | 0 | 7453 | 1 |
| D | 0 | 7677 | 1 |
| Mode SS | |||
|---|---|---|---|
| Quadrant | BADHDUFLAG | Total packets | Discarded packets |
| A | 0 | 68 | 0 |
| B | 0 | 68 | 0 |
| C | 0 | 68 | 0 |
| D | 0 | 68 | 0 |
| Quadrant | Total seconds | Saturated seconds | Saturation percentage |
|---|---|---|---|
| A | 3321 | 88 | 2.649804% |
| B | 3321 | 136 | 4.095152% |
| C | 3321 | 132 | 3.974706% |
| D | 3321 | 114 | 3.432701% |
Noise dominated data is calculated using 1-second bins in cleaned event files. If a bin has >2000 counts, and if more than 50% of those come from <1% of pixels, then it is considered to be noise-dominated and hence unusable.
| Quadrant | # 1 sec bins | Bins with >0 counts | Bins with >2000 counts | High rate bins dominated by noise | Noise dominated (total time) | Noise dominated (detector-on time) | Marked lightcurve |
|---|---|---|---|---|---|---|---|
| A | 4591 | 3321 | 0 | 0 | 0.00% | 0.00% | 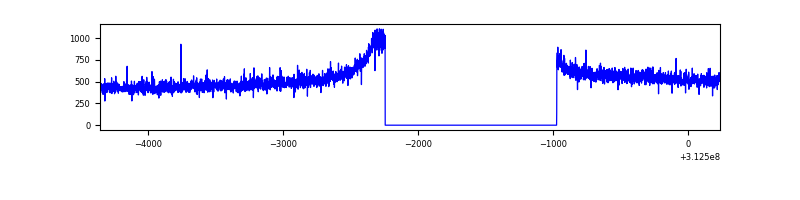 |
| B | 4591 | 3321 | 7 | 7 | 0.15% | 0.21% | 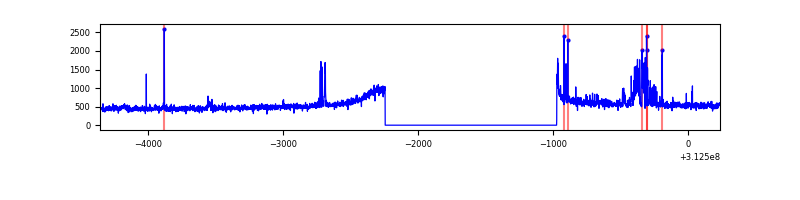 |
| C | 4591 | 3321 | 0 | 0 | 0.00% | 0.00% | 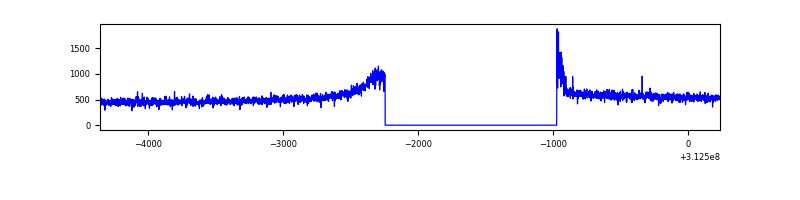 |
| D | 4591 | 3321 | 30 | 30 | 0.65% | 0.90% | 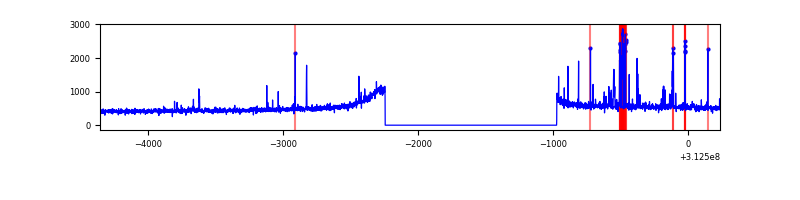 |
Top three noisy pixels from each quadrant. If the there are fewer than three noisy pixels in the level2.evt file, extra rows are filled as -1
| Pixel properties | Quadrant properties | ||||||
|---|---|---|---|---|---|---|---|
| Quadrant | DetID | PixID | Counts | Sigma | Mean | Median | Sigma |
| A | 13 | 254 | 5388 | 53.54 | 454 | 444 | 92.3 |
| A | 0 | 226 | 3992 | 38.42 | 454 | 444 | 92.3 |
| A | 3 | 137 | 3813 | 36.48 | 454 | 444 | 92.3 |
| B | 15 | 33 | 105656 | 1187.66 | 451 | 440 | 88.6 |
| B | 5 | 172 | 25401 | 281.76 | 451 | 440 | 88.6 |
| B | 12 | 111 | 10269 | 110.95 | 451 | 440 | 88.6 |
| C | 14 | 238 | 68652 | 654.86 | 440 | 444 | 104.2 |
| C | 0 | 10 | 28230 | 266.77 | 440 | 444 | 104.2 |
| C | 13 | 61 | 2981 | 24.36 | 440 | 444 | 104.2 |
| D | 2 | 120 | 74128 | 676.45 | 444 | 433 | 108.9 |
| D | 1 | 52 | 49978 | 454.77 | 444 | 433 | 108.9 |
| D | 2 | 136 | 22607 | 203.54 | 444 | 433 | 108.9 |
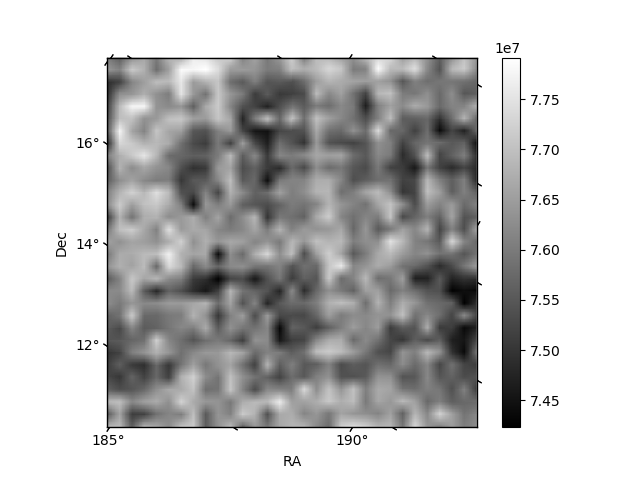
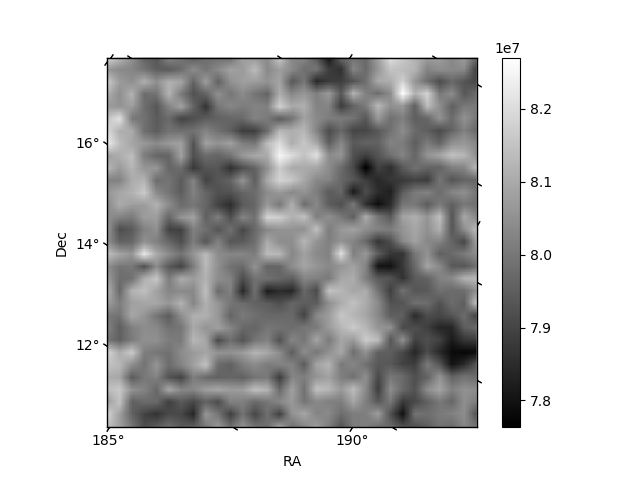
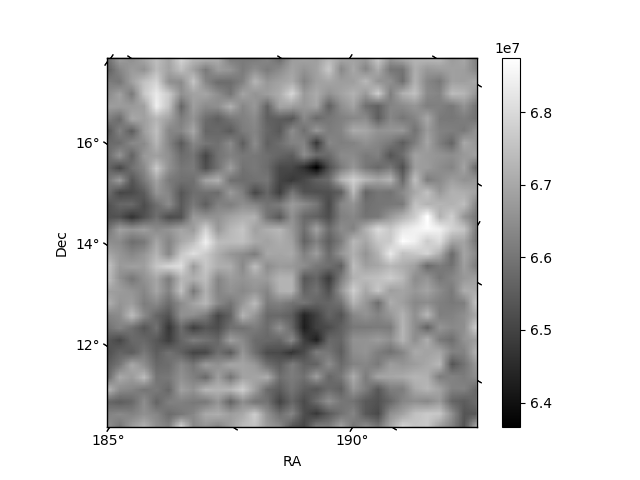
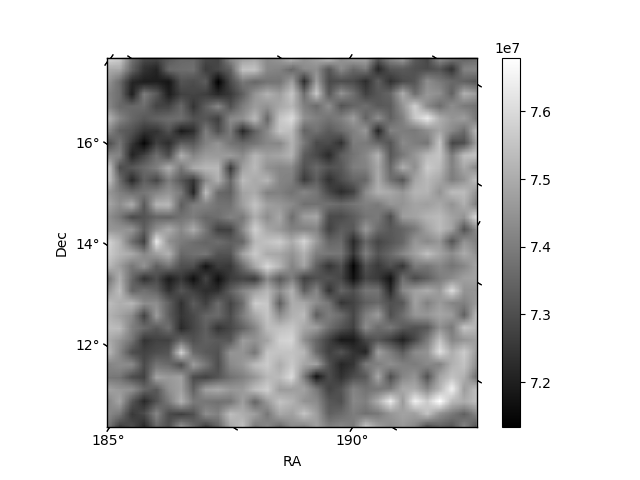
Histogram calculated using DETX and DETY for each event in the final _common_clean file
| Quadrant A |  |
 |
Quadrant B |
|---|---|---|---|
| Quadrant D |  |
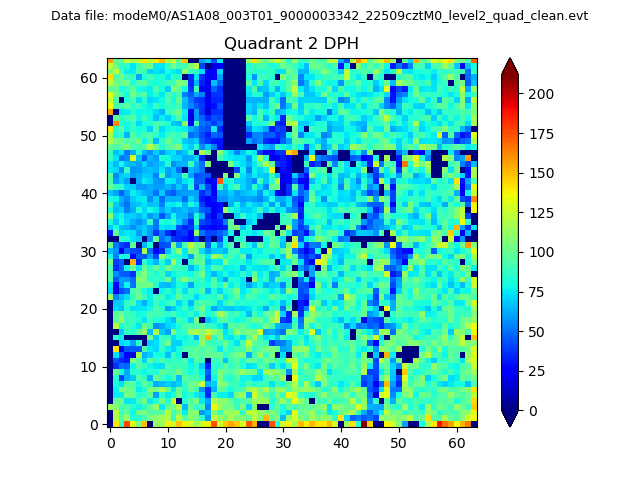 |
Quadrant C |
| Plot type | Count rate plots | Images |
|---|---|---|
| Comparison with Poisson distribution Blue bars denote a histogram of data divided into 1 sec bins. Red curve is a Poisson curve with rate = median count rate of data. |
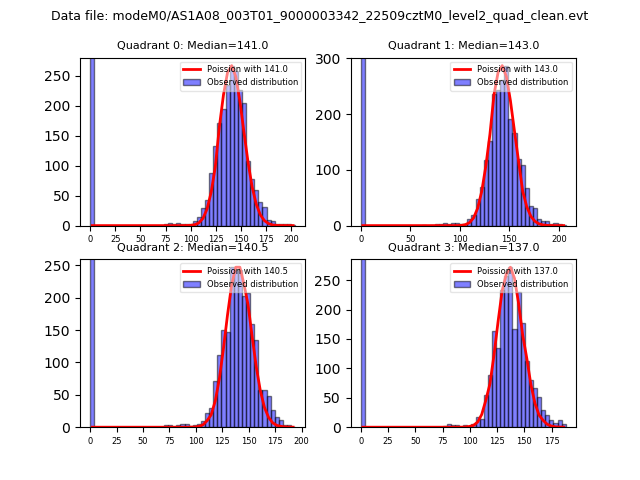 |
 |
| Quadrant-wise count rates Data is divided into 100 sec bins |
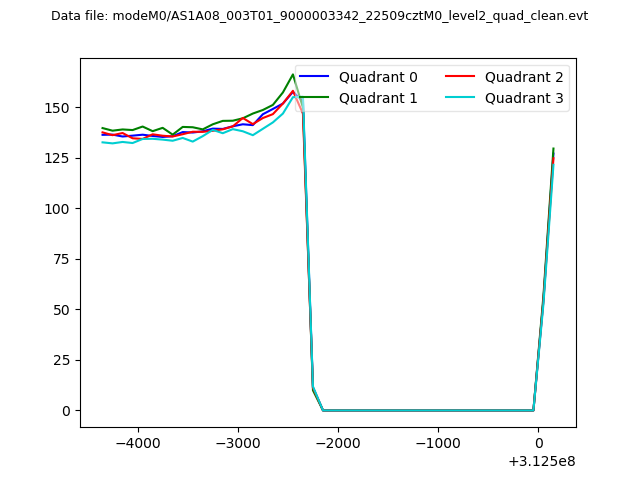 |
|
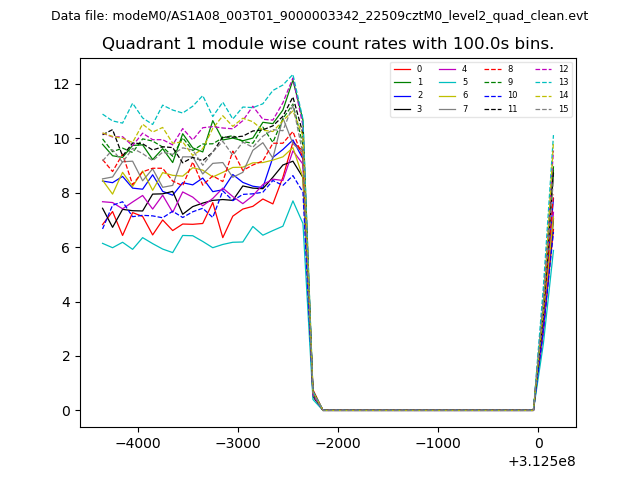
| Module-wise count rates for Quadrant A Data is divided into 100 sec bins |
 |
 |
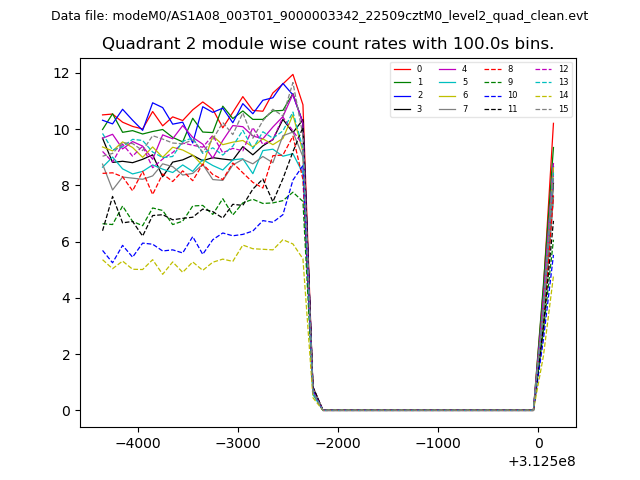
| Module-wise count rates for Quadrant B Data is divided into 100 sec bins |
 |
 |
| Module-wise count rates for Quadrant C Data is divided into 100 sec bins |
 |
 |
| Module-wise count rates for Quadrant D Data is divided into 100 sec bins |
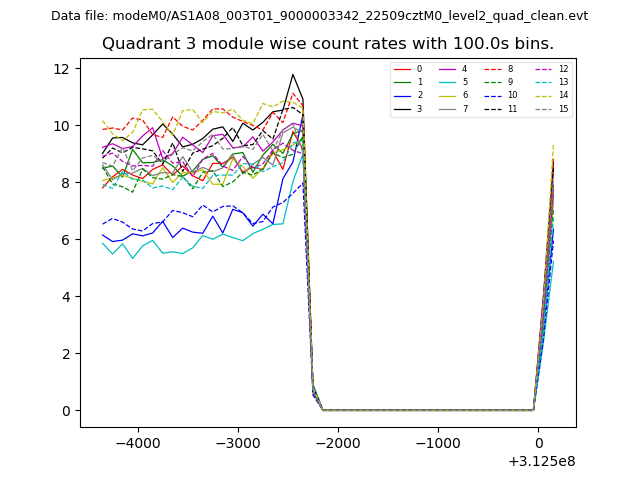 |
 |
| Parameter | Plot |
|---|---|
| CZT HV Monitor | 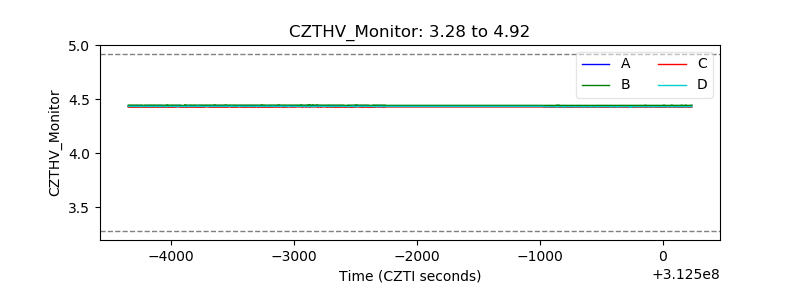 |
| D_VDD | 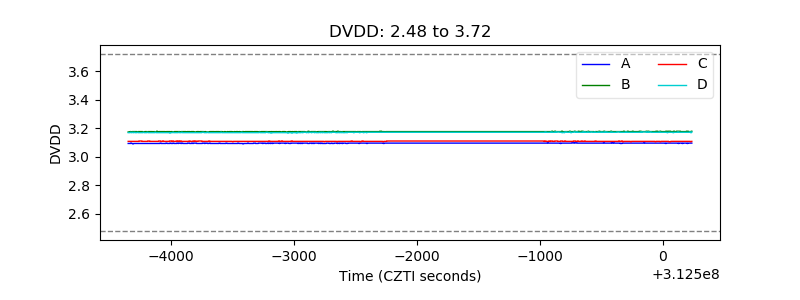 |
| Temperature 1 | 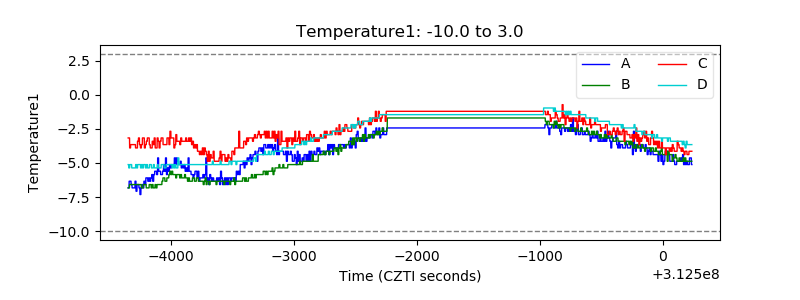 |
| Veto HV Monitor | 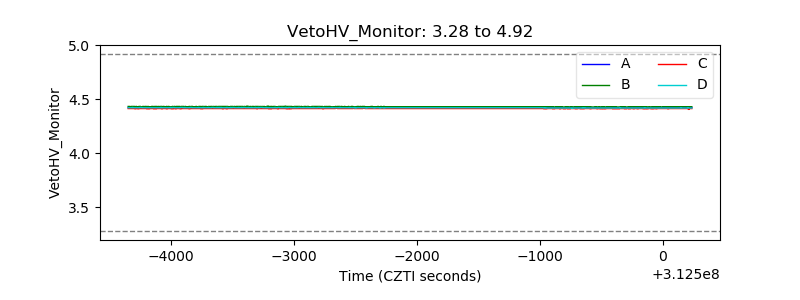 |
| Veto LLD | 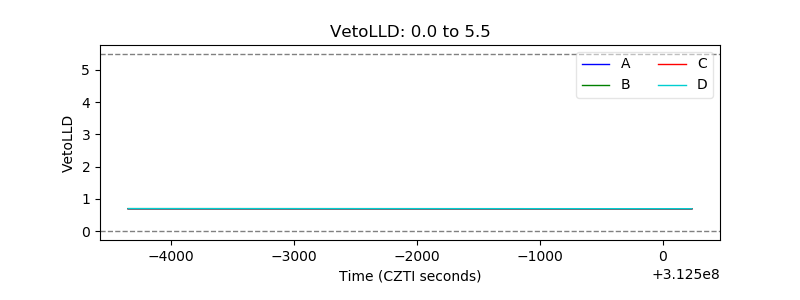 |
| Alpha Counter | 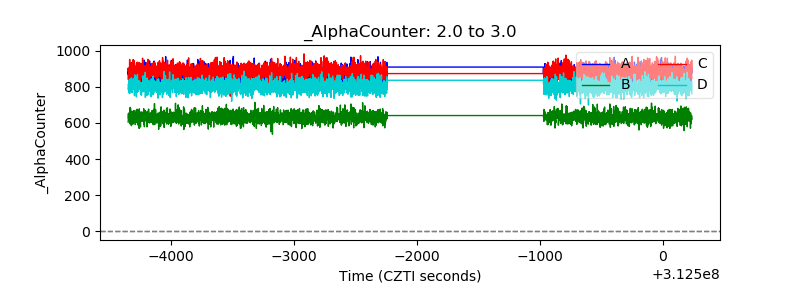 |
| _CPM_Rate | 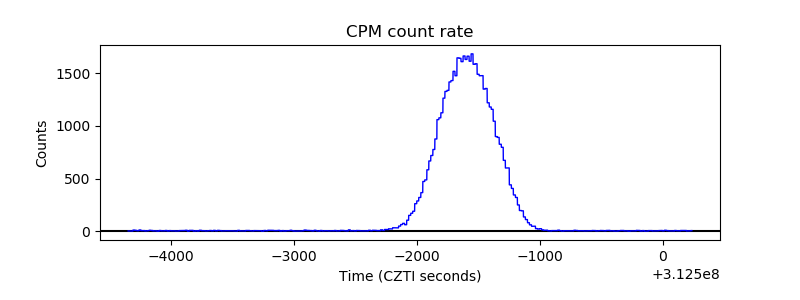 |
| CZT Counter | 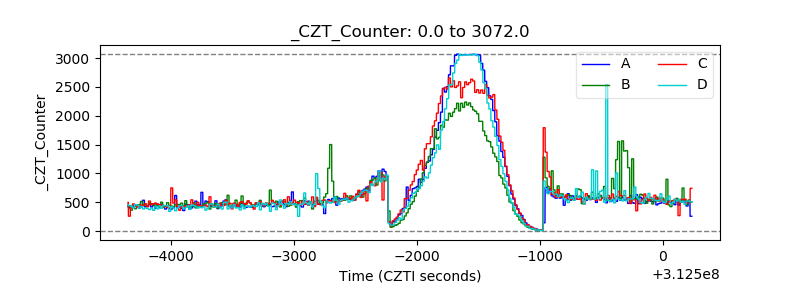 |
| +2.5 Volts monitor |  |
| +5 Volts monitor | 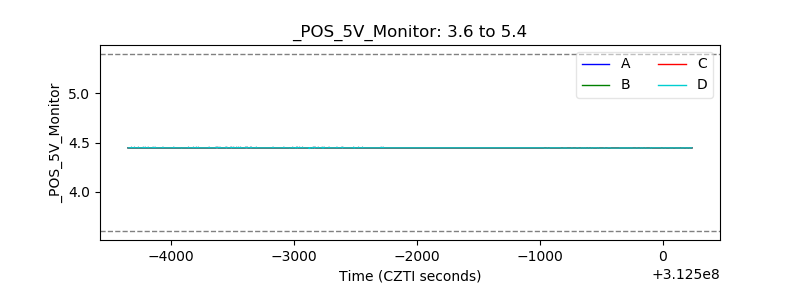 |
| _ROLL_ROT | 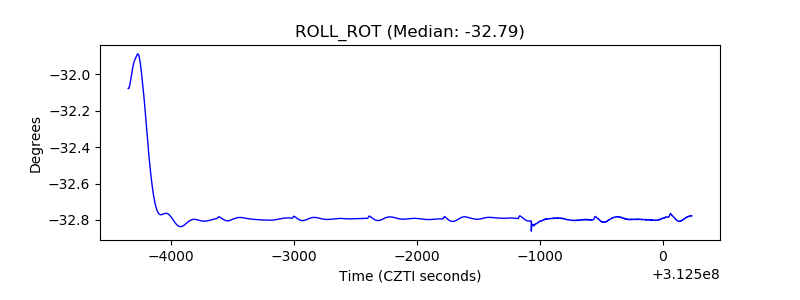 |
| _Roll_DEC | 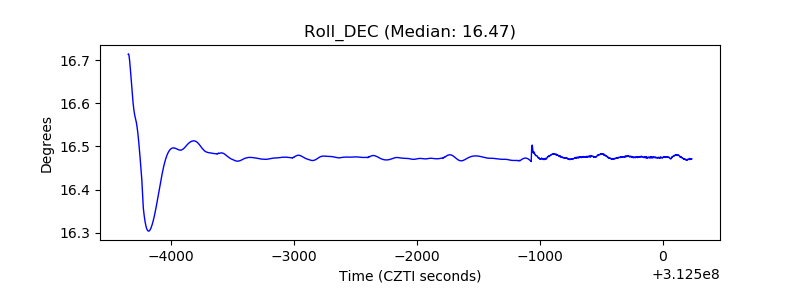 |
| _Roll_RA | 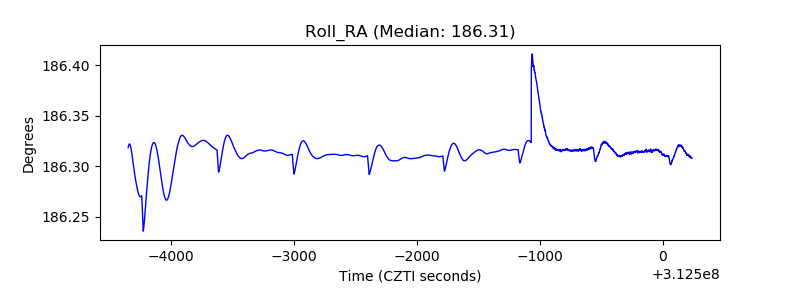 |
| Veto Counter | 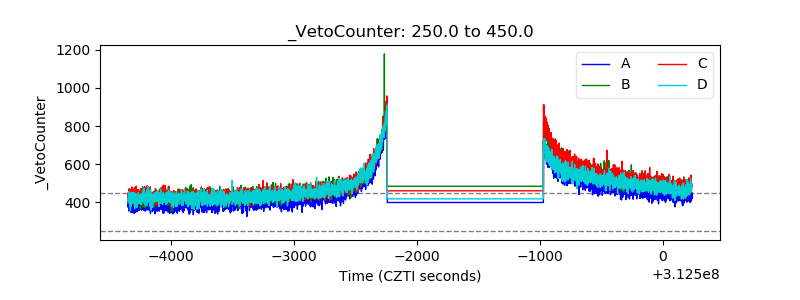 |