| Param | Original file | Final file |
|---|---|---|
| Filename | modeM0/AS1A08_003T01_9000003342_22510cztM0_level2.evt | modeM0/AS1A08_003T01_9000003342_22510cztM0_level2_quad_clean.evt |
| Size (bytes) | 456,145,920 | 88,764,480 |
| Size | 435.0 MB | 84.7 MB |
| Events in quadrant A | 3,210,239 | 561,706 |
| Events in quadrant B | 3,413,640 | 575,278 |
| Events in quadrant C | 3,324,935 | 555,904 |
| Events in quadrant D | 3,428,623 | 546,639 |
| Mode M9 | |||
|---|---|---|---|
| Quadrant | BADHDUFLAG | Total packets | Discarded packets |
| A | 0 | 19 | 0 |
| B | 0 | 20 | 0 |
| C | 0 | 20 | 0 |
| D | 0 | 20 | 0 |
| Mode M0 | |||
|---|---|---|---|
| Quadrant | BADHDUFLAG | Total packets | Discarded packets |
| A | 0 | 13564 | 2 |
| B | 0 | 14184 | 2 |
| C | 0 | 13845 | 2 |
| D | 0 | 14467 | 2 |
| Mode SS | |||
|---|---|---|---|
| Quadrant | BADHDUFLAG | Total packets | Discarded packets |
| A | 0 | 132 | 0 |
| B | 0 | 132 | 0 |
| C | 0 | 132 | 0 |
| D | 0 | 132 | 0 |
| Quadrant | Total seconds | Saturated seconds | Saturation percentage |
|---|---|---|---|
| A | 6425 | 74 | 1.151751% |
| B | 6424 | 124 | 1.930262% |
| C | 6424 | 132 | 2.054795% |
| D | 6424 | 101 | 1.572229% |
Noise dominated data is calculated using 1-second bins in cleaned event files. If a bin has >2000 counts, and if more than 50% of those come from <1% of pixels, then it is considered to be noise-dominated and hence unusable.
| Quadrant | # 1 sec bins | Bins with >0 counts | Bins with >2000 counts | High rate bins dominated by noise | Noise dominated (total time) | Noise dominated (detector-on time) | Marked lightcurve |
|---|---|---|---|---|---|---|---|
| A | 7510 | 6425 | 0 | 0 | 0.00% | 0.00% | 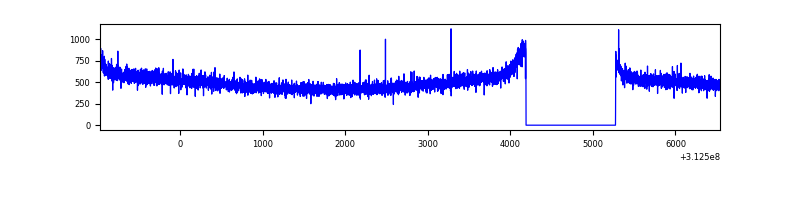 |
| B | 7509 | 6424 | 12 | 12 | 0.16% | 0.19% |  |
| C | 7509 | 6424 | 0 | 0 | 0.00% | 0.00% | 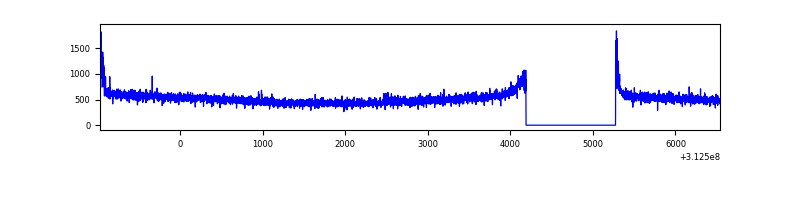 |
| D | 7509 | 6425 | 48 | 48 | 0.64% | 0.75% | 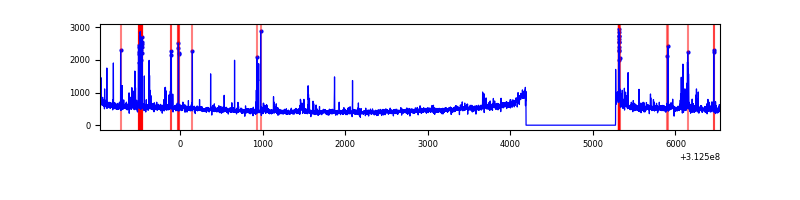 |
Top three noisy pixels from each quadrant. If the there are fewer than three noisy pixels in the level2.evt file, extra rows are filled as -1
| Pixel properties | Quadrant properties | ||||||
|---|---|---|---|---|---|---|---|
| Quadrant | DetID | PixID | Counts | Sigma | Mean | Median | Sigma |
| A | 13 | 254 | 10658 | 58.59 | 832 | 813 | 168.0 |
| A | 0 | 226 | 7318 | 38.71 | 832 | 813 | 168.0 |
| A | 3 | 137 | 7010 | 36.88 | 832 | 813 | 168.0 |
| B | 15 | 33 | 119230 | 748.31 | 830 | 810 | 158.3 |
| B | 0 | 228 | 38415 | 237.63 | 830 | 810 | 158.3 |
| B | 12 | 111 | 19036 | 115.17 | 830 | 810 | 158.3 |
| C | 14 | 238 | 127314 | 668.61 | 805 | 811 | 189.2 |
| C | 0 | 10 | 45306 | 235.17 | 805 | 811 | 189.2 |
| C | 10 | 91 | 15603 | 78.18 | 805 | 811 | 189.2 |
| D | 1 | 52 | 209808 | 1057.83 | 810 | 788 | 197.6 |
| D | 2 | 120 | 79037 | 396.01 | 810 | 788 | 197.6 |
| D | 2 | 234 | 26274 | 128.98 | 810 | 788 | 197.6 |
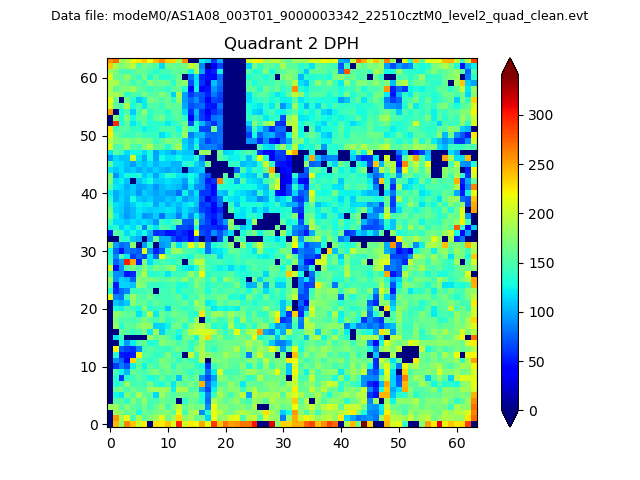
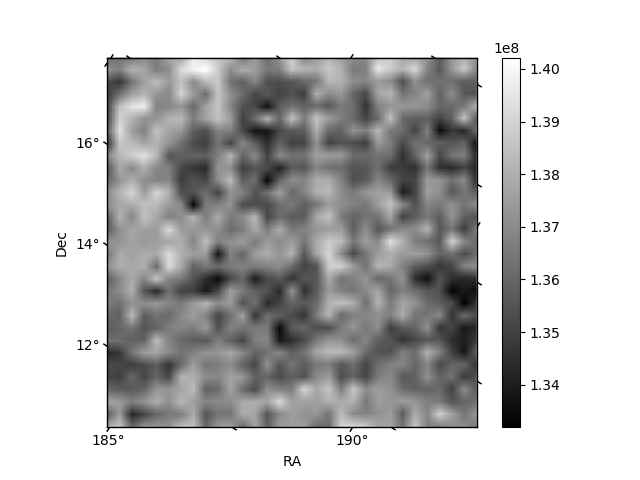
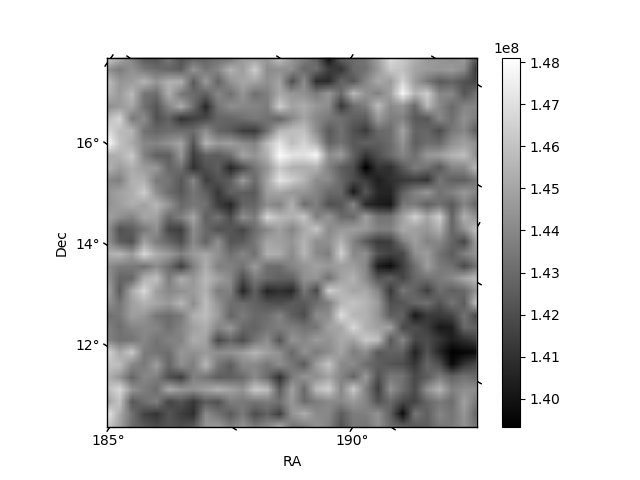
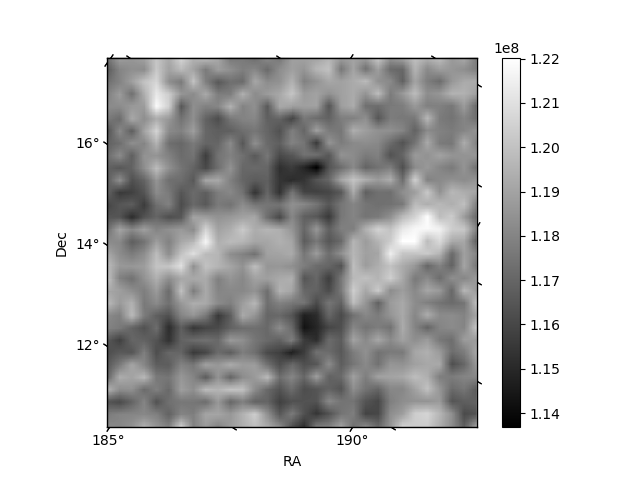
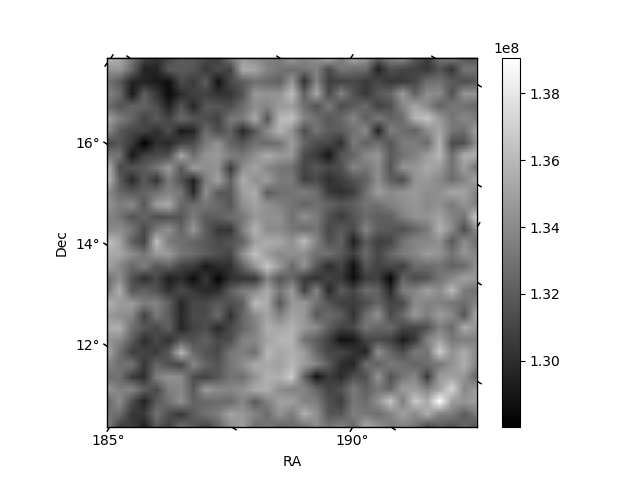
Histogram calculated using DETX and DETY for each event in the final _common_clean file
| Quadrant A |  |
 |
Quadrant B |
|---|---|---|---|
| Quadrant D | 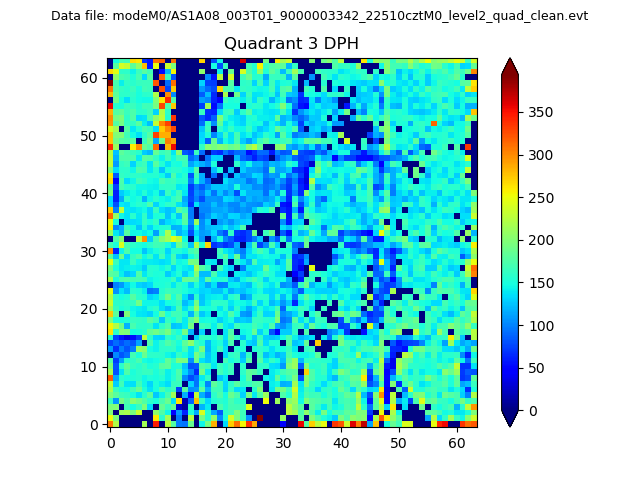 |
 |
Quadrant C |
| Plot type | Count rate plots | Images |
|---|---|---|
| Comparison with Poisson distribution Blue bars denote a histogram of data divided into 1 sec bins. Red curve is a Poisson curve with rate = median count rate of data. |
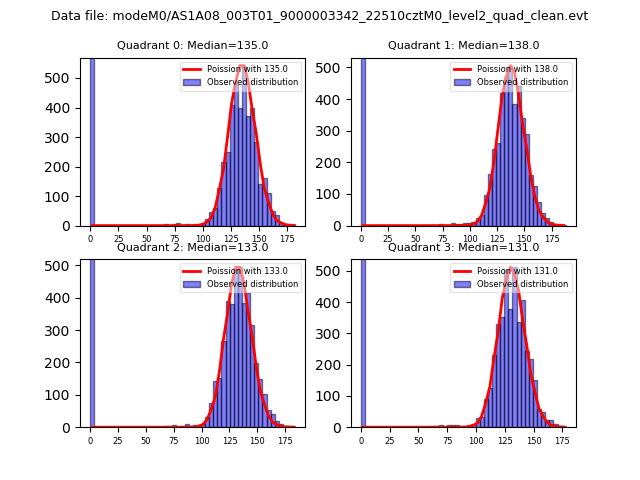 |
 |
| Quadrant-wise count rates Data is divided into 100 sec bins |
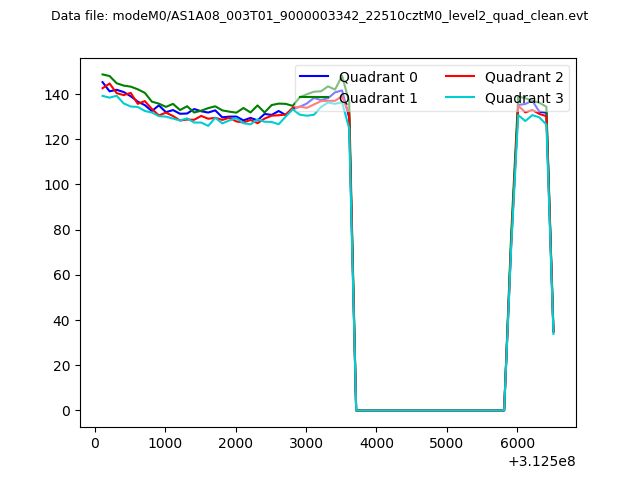 |
|
| Module-wise count rates for Quadrant A Data is divided into 100 sec bins |
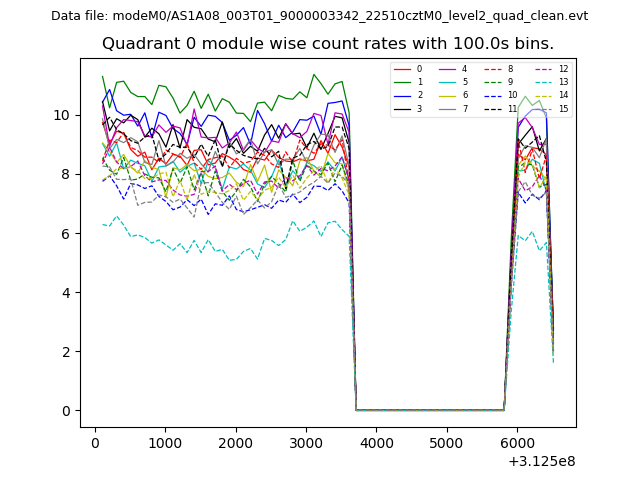 |
 |
| Module-wise count rates for Quadrant B Data is divided into 100 sec bins |
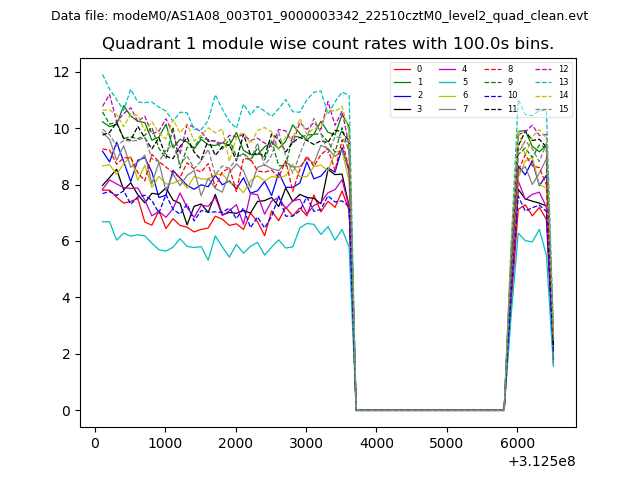 |
 |
| Module-wise count rates for Quadrant C Data is divided into 100 sec bins |
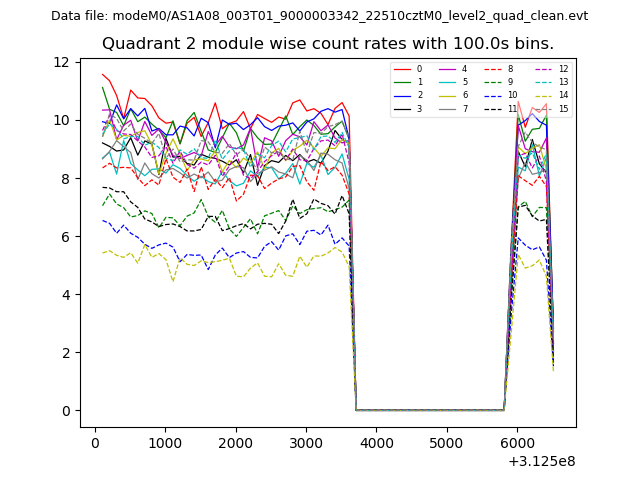 |
 |
| Module-wise count rates for Quadrant D Data is divided into 100 sec bins |
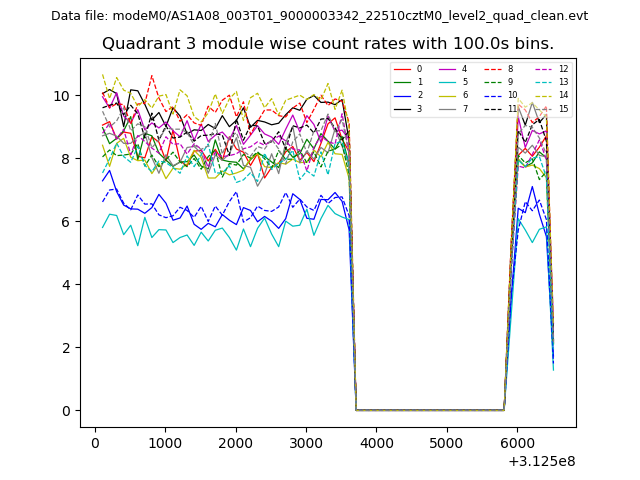 |
 |
| Parameter | Plot |
|---|---|
| CZT HV Monitor | 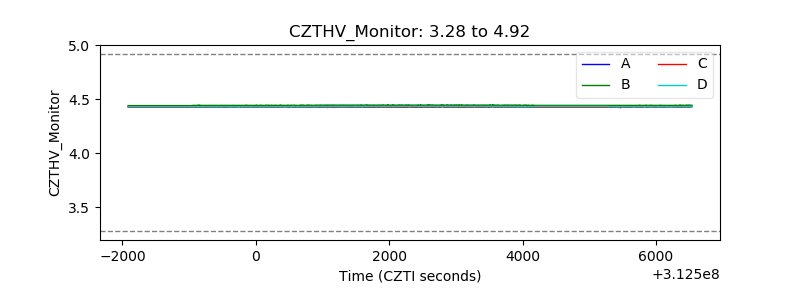 |
| D_VDD | 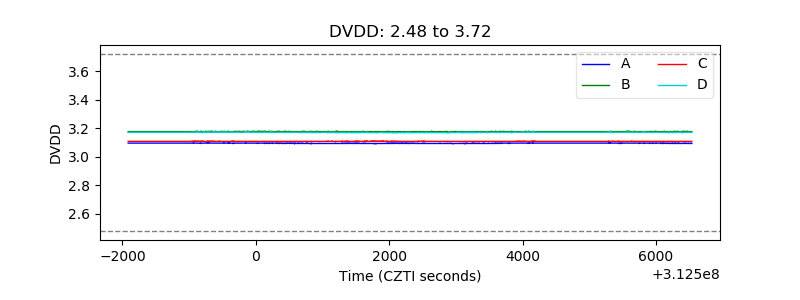 |
| Temperature 1 |  |
| Veto HV Monitor | 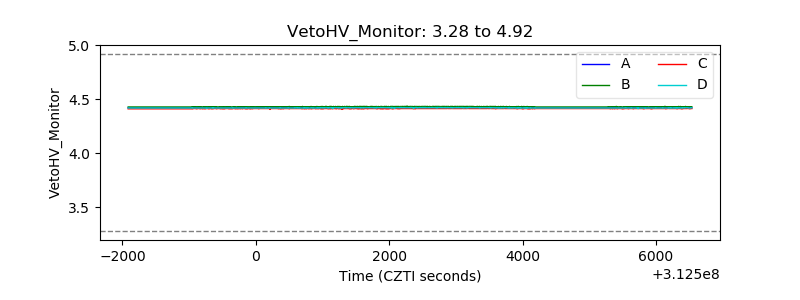 |
| Veto LLD |  |
| Alpha Counter | 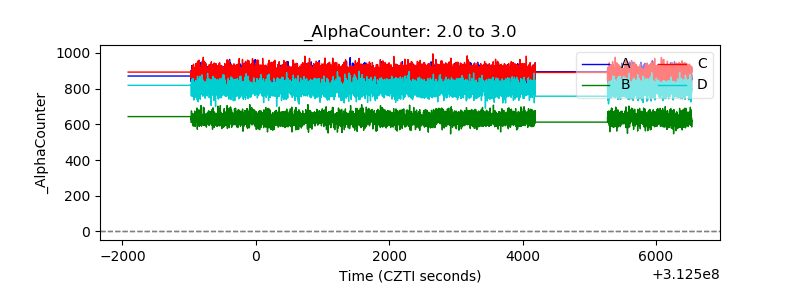 |
| _CPM_Rate | 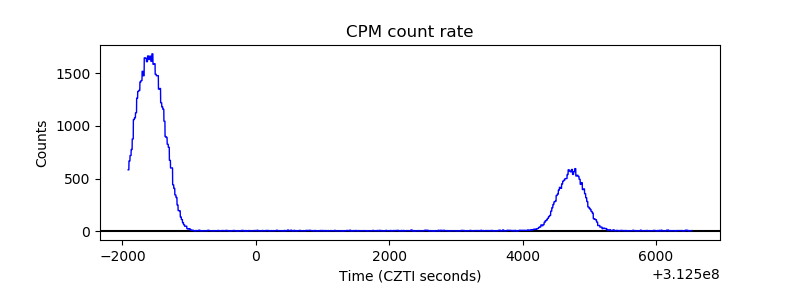 |
| CZT Counter | 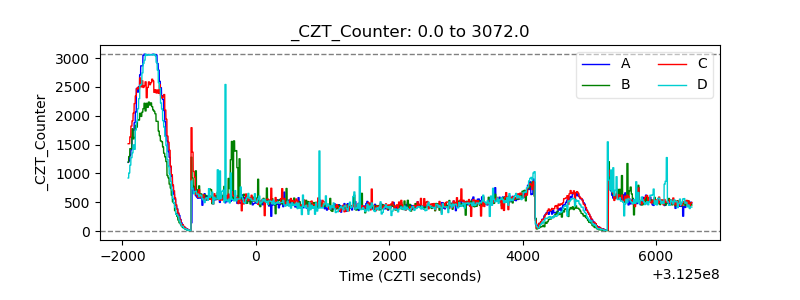 |
| +2.5 Volts monitor |  |
| +5 Volts monitor | 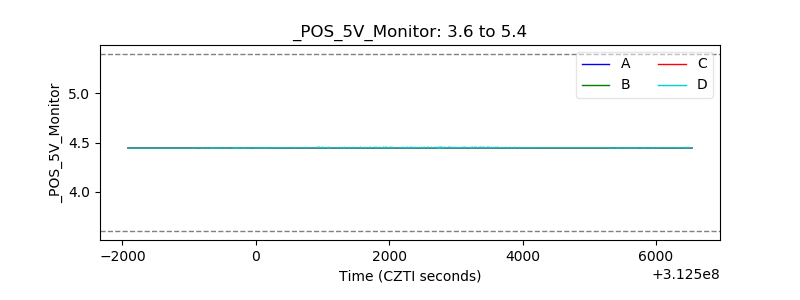 |
| _ROLL_ROT |  |
| _Roll_DEC | 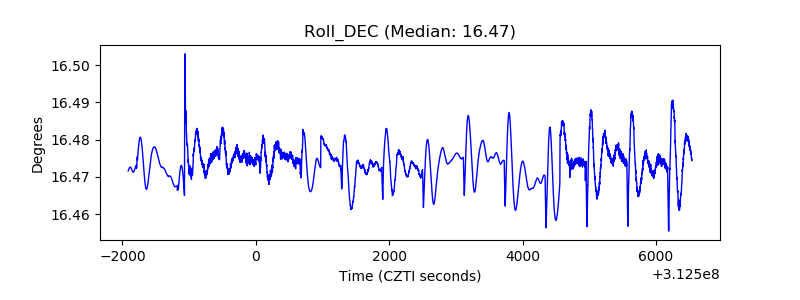 |
| _Roll_RA | 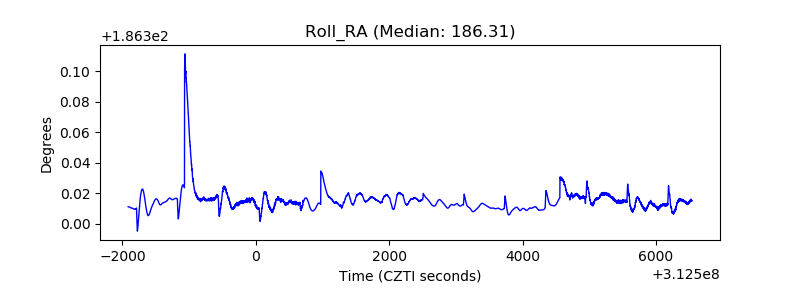 |
| Veto Counter |  |