| Param | Original file | Final file |
|---|---|---|
| Filename | modeM0/AS1A08_003T01_9000003342_22511cztM0_level2.evt | modeM0/AS1A08_003T01_9000003342_22511cztM0_level2_quad_clean.evt |
| Size (bytes) | 471,983,040 | 95,094,720 |
| Size | 450.1 MB | 90.7 MB |
| Events in quadrant A | 3,276,097 | 603,732 |
| Events in quadrant B | 3,488,235 | 615,939 |
| Events in quadrant C | 3,399,759 | 597,948 |
| Events in quadrant D | 3,663,721 | 584,178 |
| Mode M9 | |||
|---|---|---|---|
| Quadrant | BADHDUFLAG | Total packets | Discarded packets |
| A | 0 | 13 | 0 |
| B | 0 | 14 | 0 |
| C | 0 | 14 | 0 |
| D | 0 | 14 | 0 |
| Mode M0 | |||
|---|---|---|---|
| Quadrant | BADHDUFLAG | Total packets | Discarded packets |
| A | 0 | 14160 | 2 |
| B | 0 | 14732 | 2 |
| C | 0 | 14281 | 3 |
| D | 0 | 15714 | 2 |
| Mode SS | |||
|---|---|---|---|
| Quadrant | BADHDUFLAG | Total packets | Discarded packets |
| A | 0 | 140 | 0 |
| B | 0 | 140 | 0 |
| C | 0 | 140 | 0 |
| D | 0 | 140 | 0 |
| Quadrant | Total seconds | Saturated seconds | Saturation percentage |
|---|---|---|---|
| A | 6860 | 14 | 0.204082% |
| B | 6860 | 87 | 1.268222% |
| C | 6859 | 79 | 1.151771% |
| D | 6859 | 137 | 1.997376% |
Noise dominated data is calculated using 1-second bins in cleaned event files. If a bin has >2000 counts, and if more than 50% of those come from <1% of pixels, then it is considered to be noise-dominated and hence unusable.
| Quadrant | # 1 sec bins | Bins with >0 counts | Bins with >2000 counts | High rate bins dominated by noise | Noise dominated (total time) | Noise dominated (detector-on time) | Marked lightcurve |
|---|---|---|---|---|---|---|---|
| A | 7645 | 6861 | 0 | 0 | 0.00% | 0.00% | 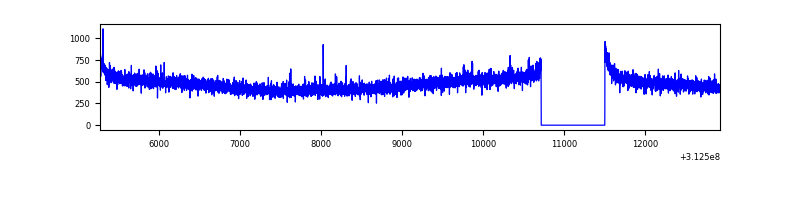 |
| B | 7645 | 6861 | 23 | 23 | 0.30% | 0.34% | 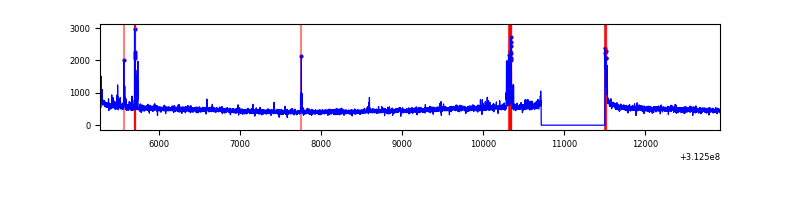 |
| C | 7644 | 6860 | 0 | 0 | 0.00% | 0.00% | 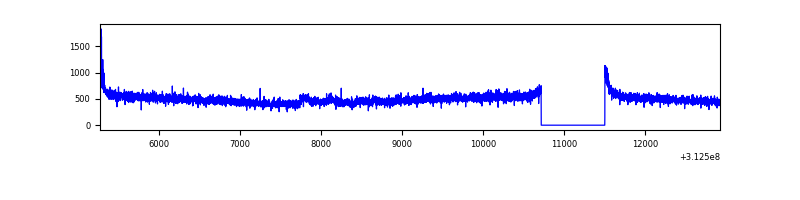 |
| D | 7644 | 6860 | 91 | 91 | 1.19% | 1.33% | 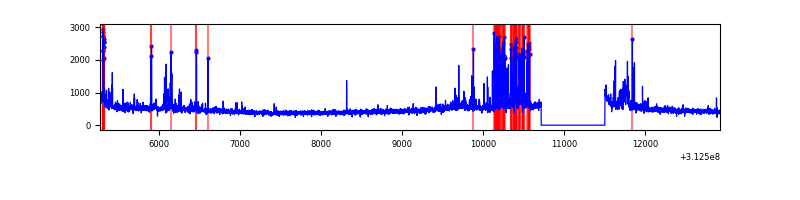 |
Top three noisy pixels from each quadrant. If the there are fewer than three noisy pixels in the level2.evt file, extra rows are filled as -1
| Pixel properties | Quadrant properties | ||||||
|---|---|---|---|---|---|---|---|
| Quadrant | DetID | PixID | Counts | Sigma | Mean | Median | Sigma |
| A | 13 | 254 | 11158 | 59.96 | 847 | 830 | 172.3 |
| A | 3 | 1 | 9049 | 47.71 | 847 | 830 | 172.3 |
| A | 0 | 226 | 7407 | 38.18 | 847 | 830 | 172.3 |
| B | 15 | 33 | 110537 | 677.18 | 844 | 821 | 162.0 |
| B | 0 | 228 | 37818 | 228.35 | 844 | 821 | 162.0 |
| B | 12 | 111 | 19773 | 116.97 | 844 | 821 | 162.0 |
| C | 14 | 238 | 129852 | 669.4 | 822 | 828 | 192.7 |
| C | 10 | 91 | 43066 | 219.14 | 822 | 828 | 192.7 |
| C | 0 | 10 | 24496 | 122.79 | 822 | 828 | 192.7 |
| D | 1 | 52 | 466959 | 2335.06 | 821 | 796 | 199.6 |
| D | 12 | 227 | 31764 | 155.12 | 821 | 796 | 199.6 |
| D | 2 | 234 | 29176 | 142.16 | 821 | 796 | 199.6 |
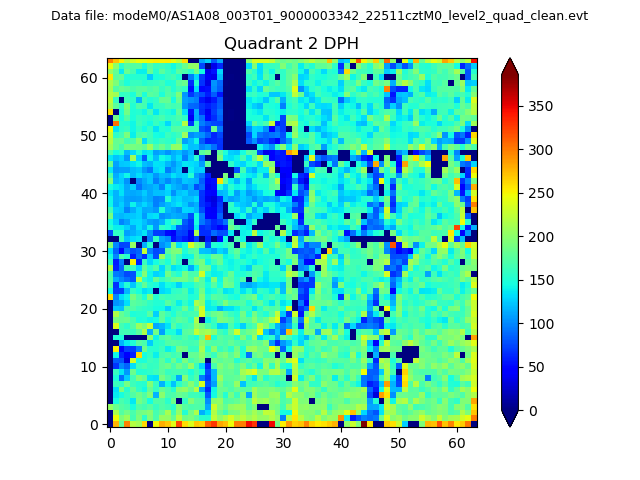
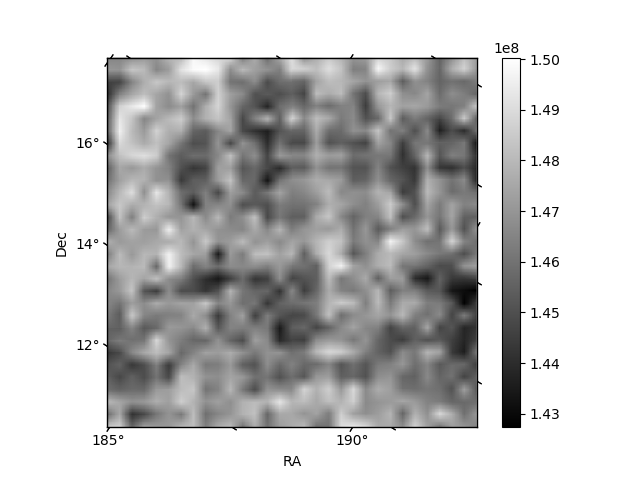
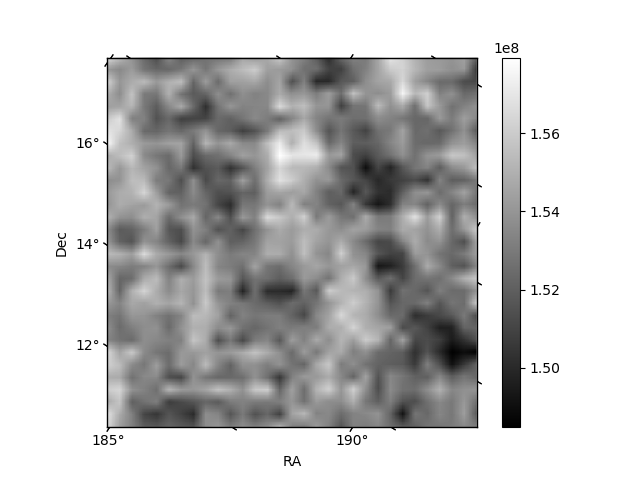
Histogram calculated using DETX and DETY for each event in the final _common_clean file
| Quadrant A |  |
 |
Quadrant B |
|---|---|---|---|
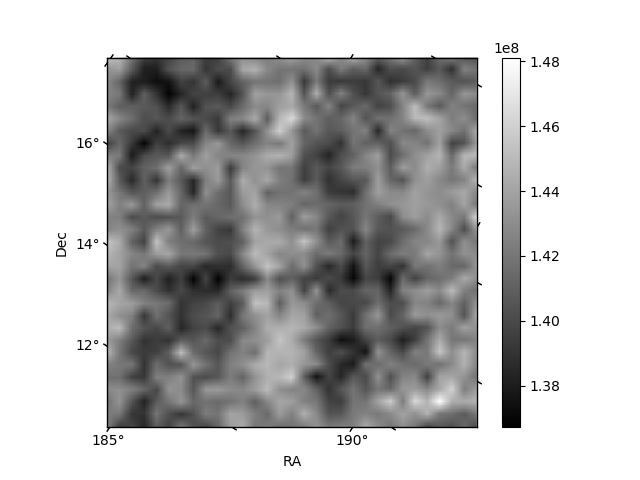
| Quadrant D |  |
 |
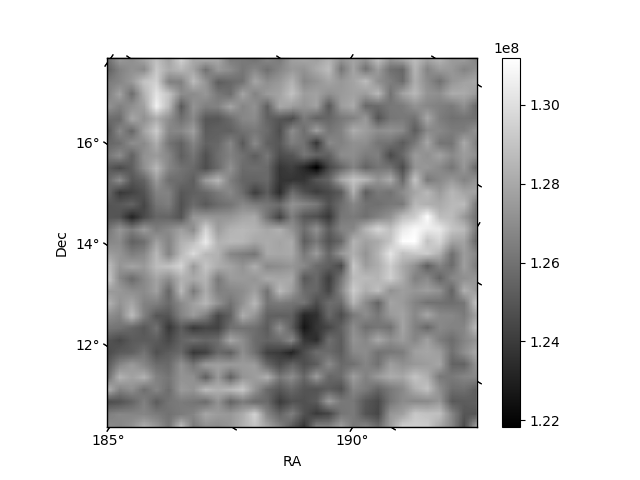
Quadrant C |
| Plot type | Count rate plots | Images |
|---|---|---|
| Comparison with Poisson distribution Blue bars denote a histogram of data divided into 1 sec bins. Red curve is a Poisson curve with rate = median count rate of data. |
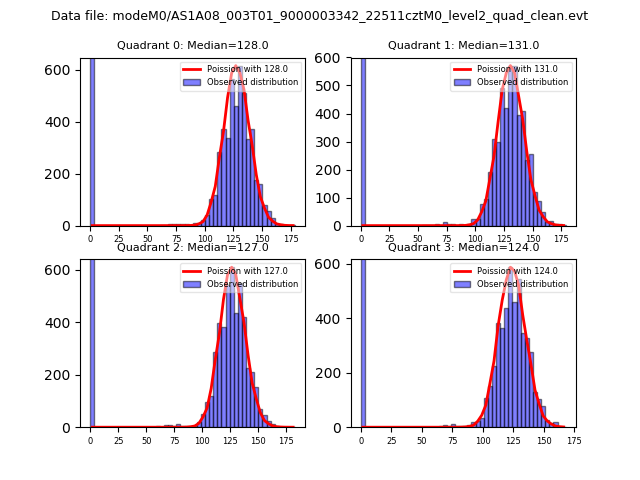 |
 |
| Quadrant-wise count rates Data is divided into 100 sec bins |
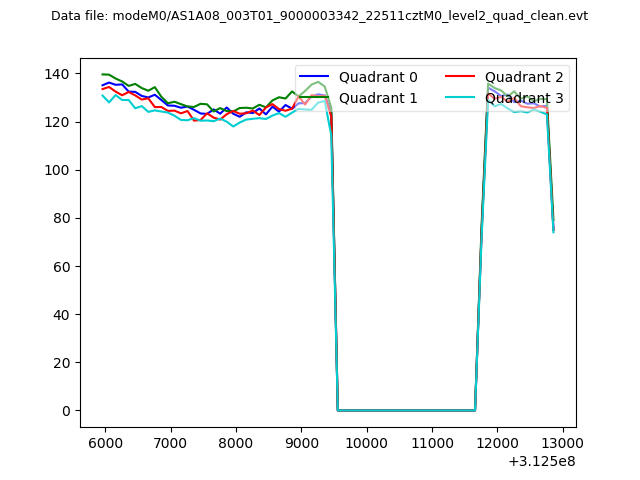 |
|
| Module-wise count rates for Quadrant A Data is divided into 100 sec bins |
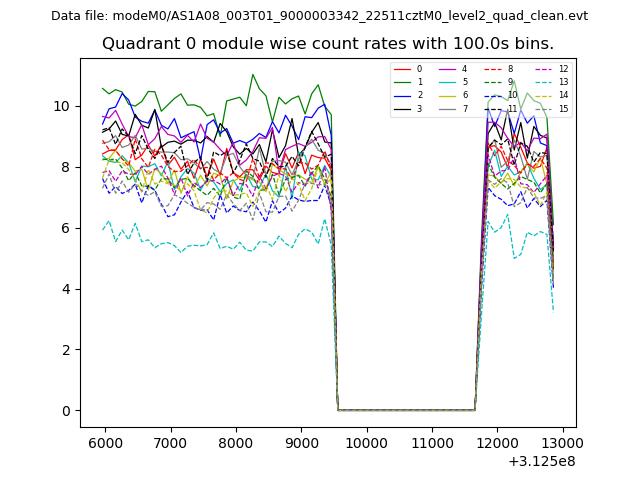 |
 |
| Module-wise count rates for Quadrant B Data is divided into 100 sec bins |
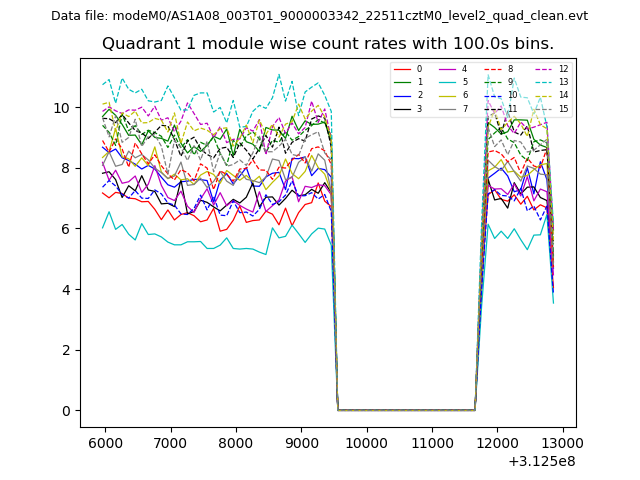 |
 |
| Module-wise count rates for Quadrant C Data is divided into 100 sec bins |
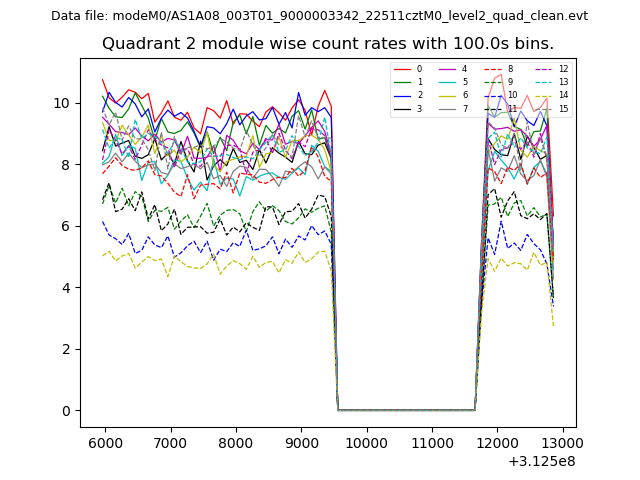 |
 |
| Module-wise count rates for Quadrant D Data is divided into 100 sec bins |
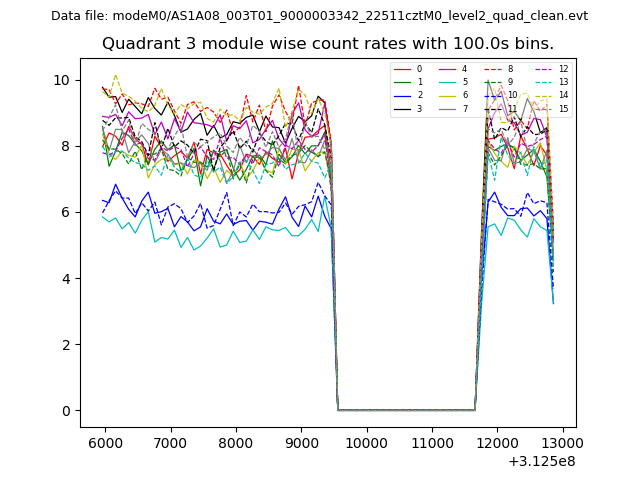 |
 |
| Parameter | Plot |
|---|---|
| CZT HV Monitor | 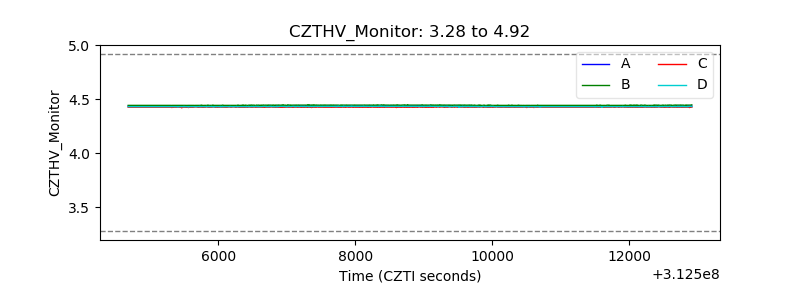 |
| D_VDD | 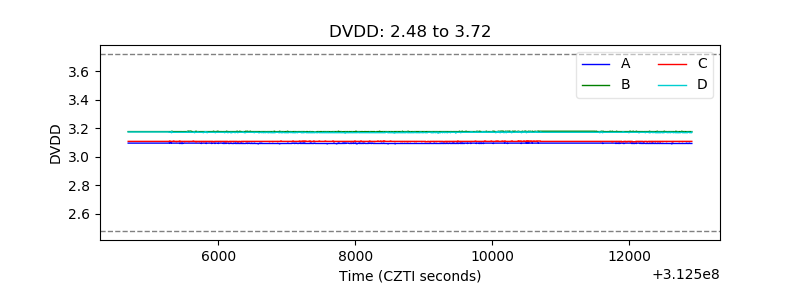 |
| Temperature 1 | 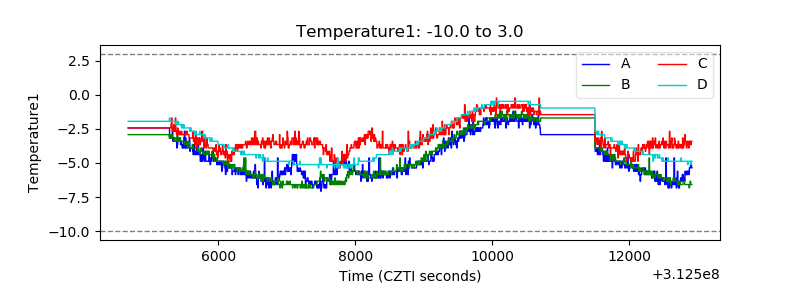 |
| Veto HV Monitor | 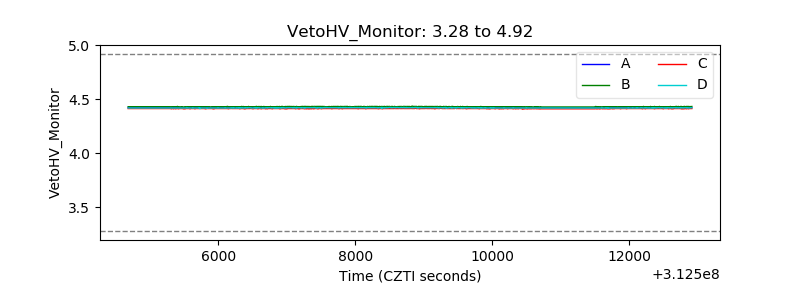 |
| Veto LLD |  |
| Alpha Counter | 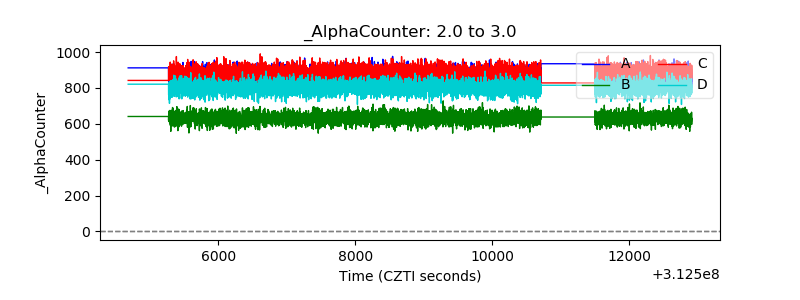 |
| _CPM_Rate | 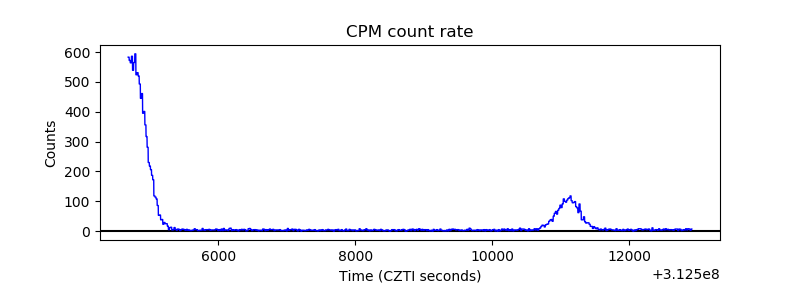 |
| CZT Counter | 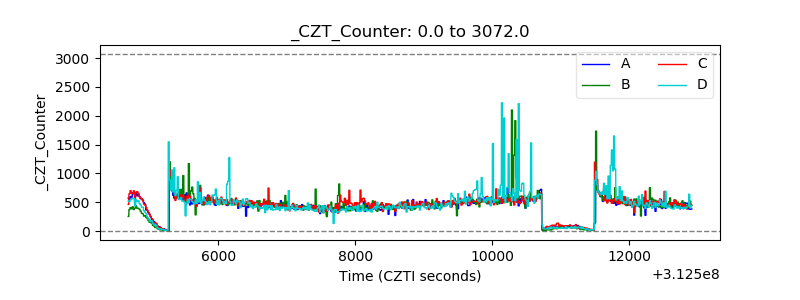 |
| +2.5 Volts monitor |  |
| +5 Volts monitor | 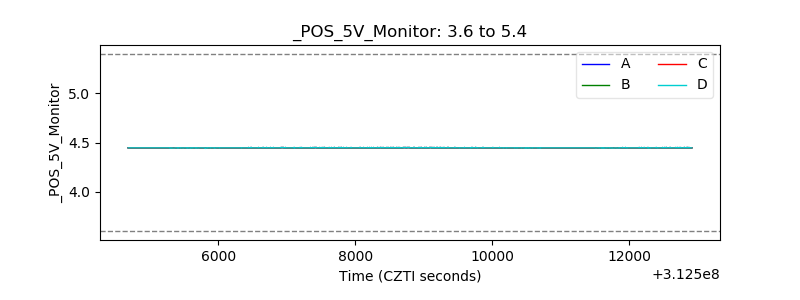 |
| _ROLL_ROT | 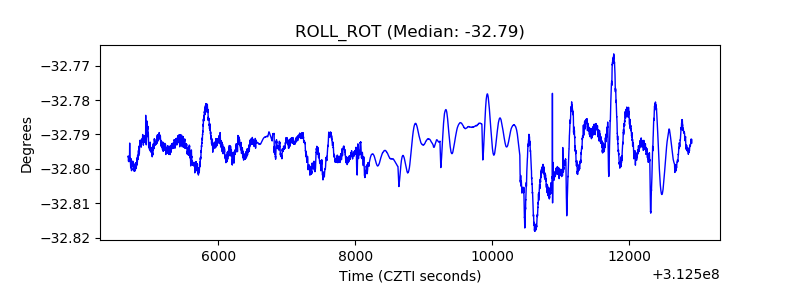 |
| _Roll_DEC | 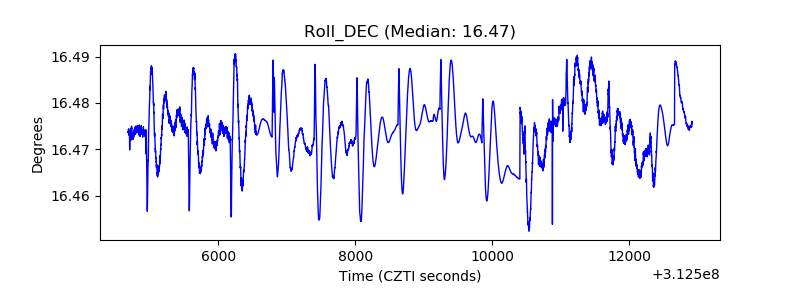 |
| _Roll_RA | 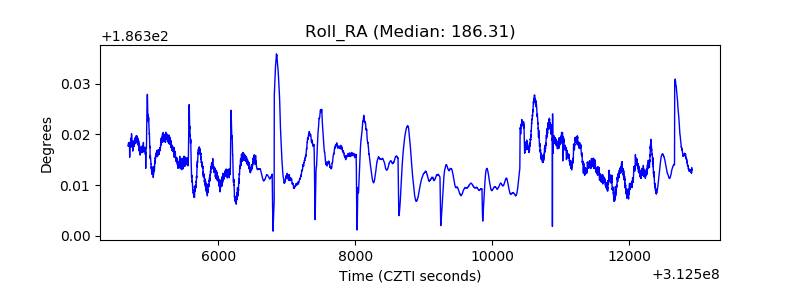 |
| Veto Counter | 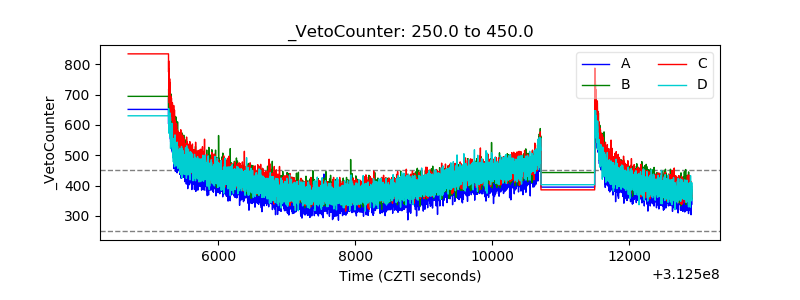 |