| Param | Original file | Final file |
|---|---|---|
| Filename | modeM0/AS1A08_003T01_9000003342_22512cztM0_level2.evt | modeM0/AS1A08_003T01_9000003342_22512cztM0_level2_quad_clean.evt |
| Size (bytes) | 565,125,120 | 105,897,600 |
| Size | 538.9 MB | 101.0 MB |
| Events in quadrant A | 3,660,781 | 676,139 |
| Events in quadrant B | 3,898,123 | 689,642 |
| Events in quadrant C | 3,726,210 | 668,437 |
| Events in quadrant D | 5,309,772 | 639,723 |
| Mode M9 | |||
|---|---|---|---|
| Quadrant | BADHDUFLAG | Total packets | Discarded packets |
| A | 0 | 7 | 0 |
| B | 0 | 8 | 0 |
| C | 0 | 8 | 0 |
| D | 0 | 8 | 0 |
| Mode M0 | |||
|---|---|---|---|
| Quadrant | BADHDUFLAG | Total packets | Discarded packets |
| A | 0 | 16023 | 1 |
| B | 0 | 16621 | 1 |
| C | 0 | 16051 | 1 |
| D | 0 | 21377 | 1 |
| Mode SS | |||
|---|---|---|---|
| Quadrant | BADHDUFLAG | Total packets | Discarded packets |
| A | 0 | 154 | 0 |
| B | 0 | 154 | 0 |
| C | 0 | 154 | 0 |
| D | 0 | 154 | 0 |
| Quadrant | Total seconds | Saturated seconds | Saturation percentage |
|---|---|---|---|
| A | 7668 | 63 | 0.821596% |
| B | 7667 | 173 | 2.256424% |
| C | 7667 | 162 | 2.112952% |
| D | 7667 | 380 | 4.956306% |
Noise dominated data is calculated using 1-second bins in cleaned event files. If a bin has >2000 counts, and if more than 50% of those come from <1% of pixels, then it is considered to be noise-dominated and hence unusable.
| Quadrant | # 1 sec bins | Bins with >0 counts | Bins with >2000 counts | High rate bins dominated by noise | Noise dominated (total time) | Noise dominated (detector-on time) | Marked lightcurve |
|---|---|---|---|---|---|---|---|
| A | 7998 | 7668 | 0 | 0 | 0.00% | 0.00% | 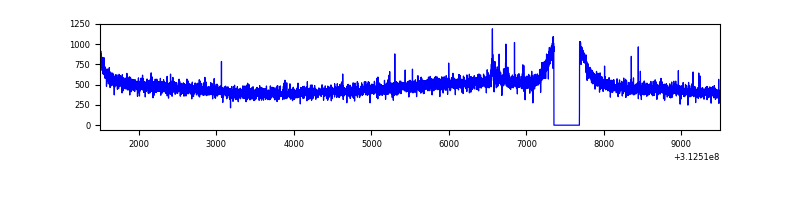 |
| B | 7997 | 7667 | 15 | 15 | 0.19% | 0.20% | 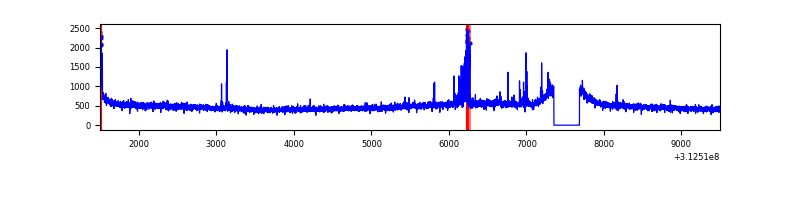 |
| C | 7997 | 7667 | 0 | 0 | 0.00% | 0.00% | 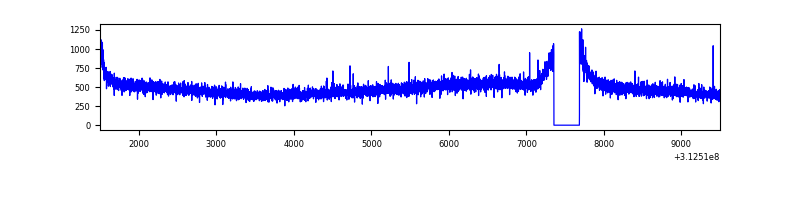 |
| D | 7997 | 7668 | 308 | 308 | 3.85% | 4.02% | 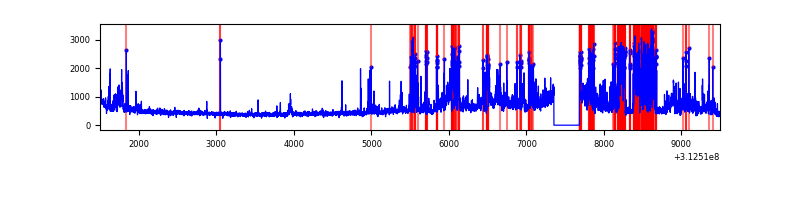 |
Top three noisy pixels from each quadrant. If the there are fewer than three noisy pixels in the level2.evt file, extra rows are filled as -1
| Pixel properties | Quadrant properties | ||||||
|---|---|---|---|---|---|---|---|
| Quadrant | DetID | PixID | Counts | Sigma | Mean | Median | Sigma |
| A | 3 | 1 | 18559 | 92.3 | 945 | 925 | 191.1 |
| A | 13 | 254 | 11932 | 57.61 | 945 | 925 | 191.1 |
| A | 3 | 137 | 8310 | 38.65 | 945 | 925 | 191.1 |
| B | 15 | 33 | 158739 | 862.17 | 941 | 914 | 183.1 |
| B | 12 | 111 | 22301 | 116.83 | 941 | 914 | 183.1 |
| B | 11 | 111 | 19653 | 102.37 | 941 | 914 | 183.1 |
| C | 14 | 238 | 145116 | 667.21 | 911 | 917 | 216.1 |
| C | 0 | 10 | 25179 | 112.26 | 911 | 917 | 216.1 |
| C | 13 | 61 | 6395 | 25.35 | 911 | 917 | 216.1 |
| D | 1 | 52 | 1780228 | 8023.06 | 903 | 875 | 221.8 |
| D | 13 | 172 | 36178 | 159.18 | 903 | 875 | 221.8 |
| D | 2 | 234 | 31223 | 136.84 | 903 | 875 | 221.8 |
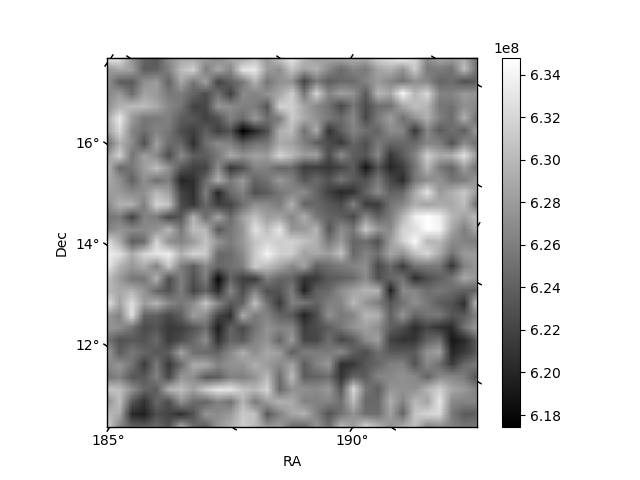
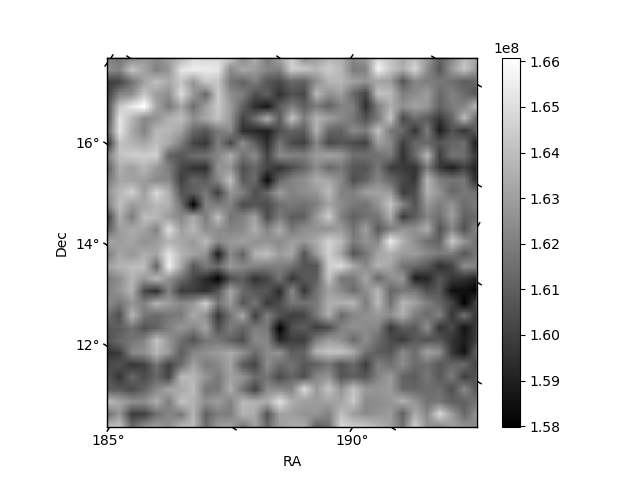
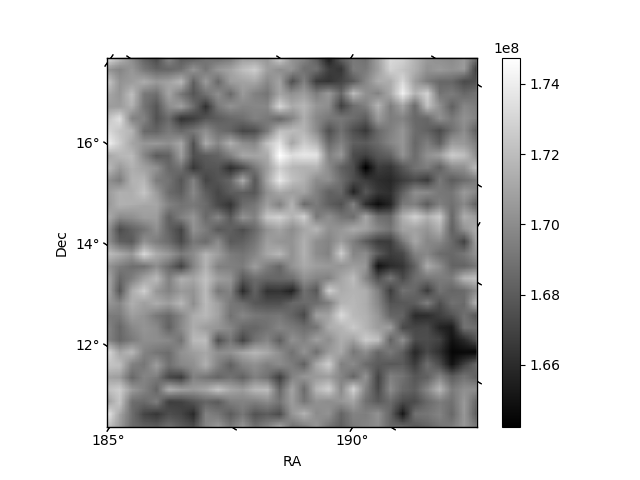
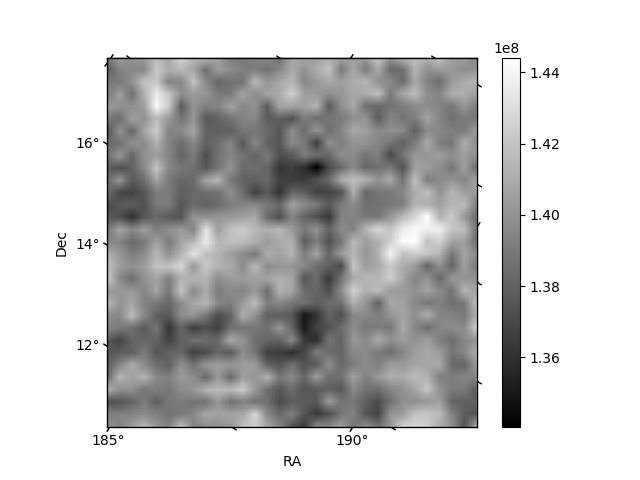
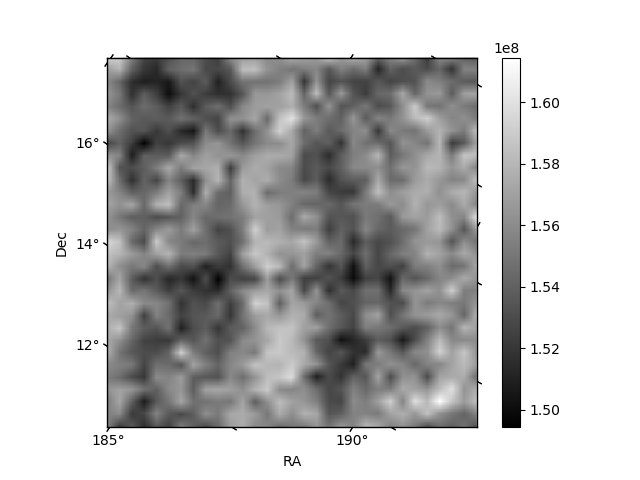
Histogram calculated using DETX and DETY for each event in the final _common_clean file
| Quadrant A | 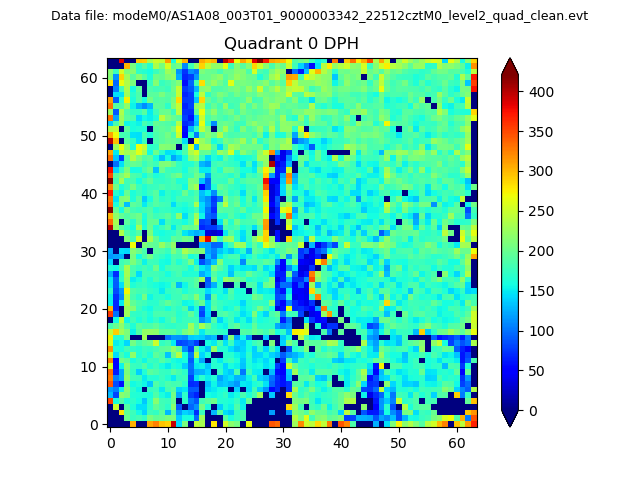 |
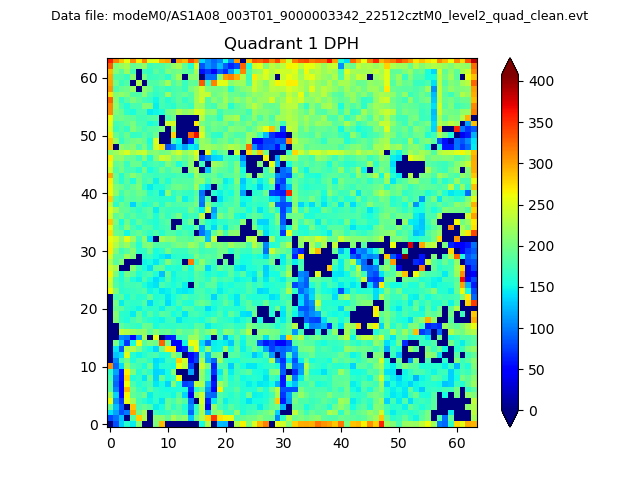 |
Quadrant B |
|---|---|---|---|
| Quadrant D |  |
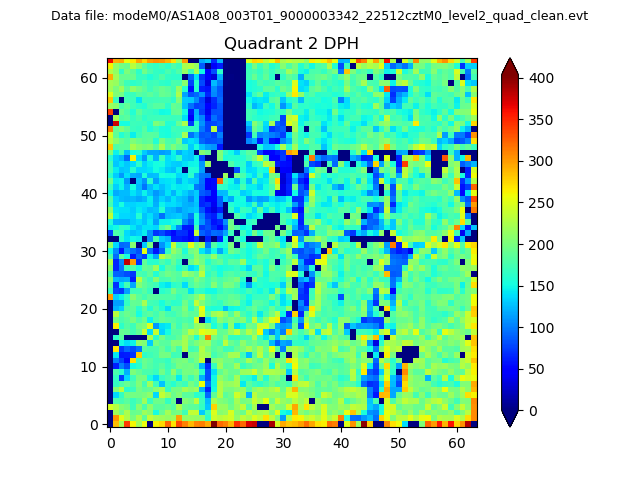 |
Quadrant C |
| Plot type | Count rate plots | Images |
|---|---|---|
| Comparison with Poisson distribution Blue bars denote a histogram of data divided into 1 sec bins. Red curve is a Poisson curve with rate = median count rate of data. |
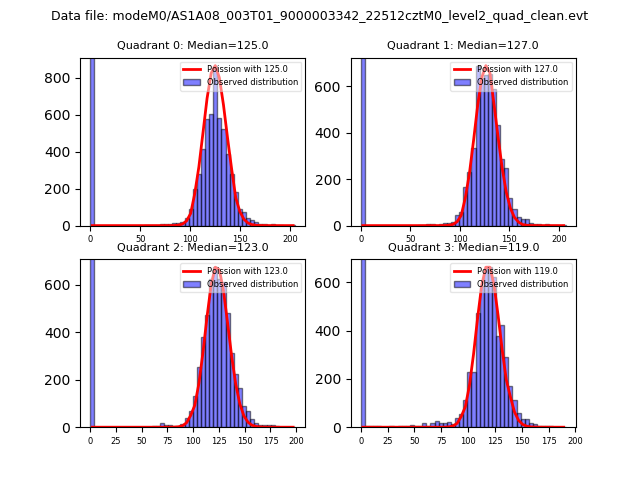 |
 |
| Quadrant-wise count rates Data is divided into 100 sec bins |
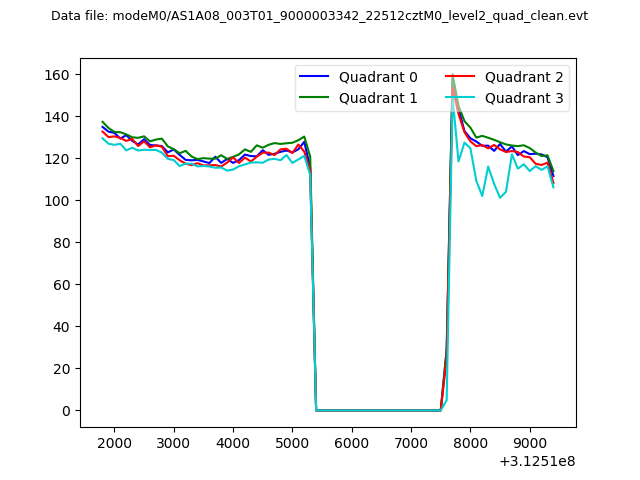 |
|
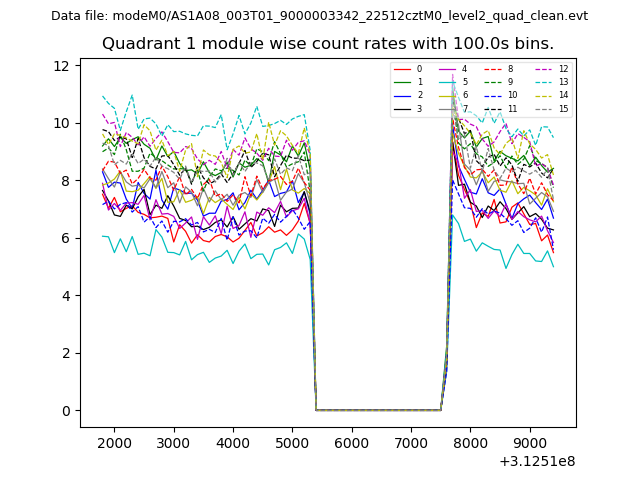
| Module-wise count rates for Quadrant A Data is divided into 100 sec bins |
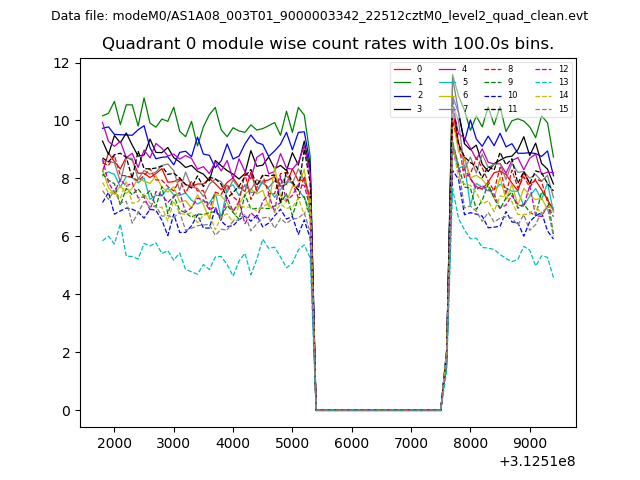 |
 |
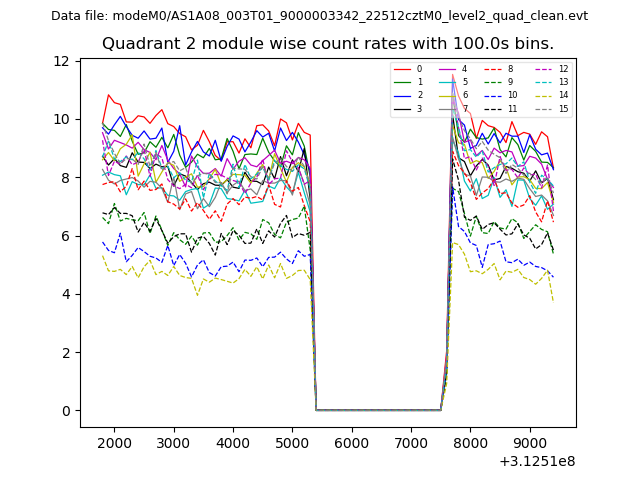
| Module-wise count rates for Quadrant B Data is divided into 100 sec bins |
 |
 |
| Module-wise count rates for Quadrant C Data is divided into 100 sec bins |
 |
 |
| Module-wise count rates for Quadrant D Data is divided into 100 sec bins |
 |
 |
| Parameter | Plot |
|---|---|
| CZT HV Monitor | 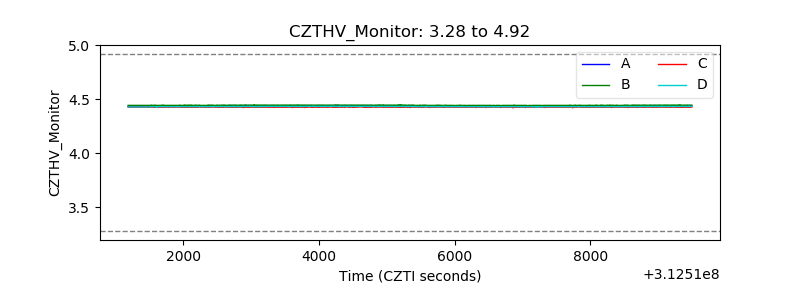 |
| D_VDD | 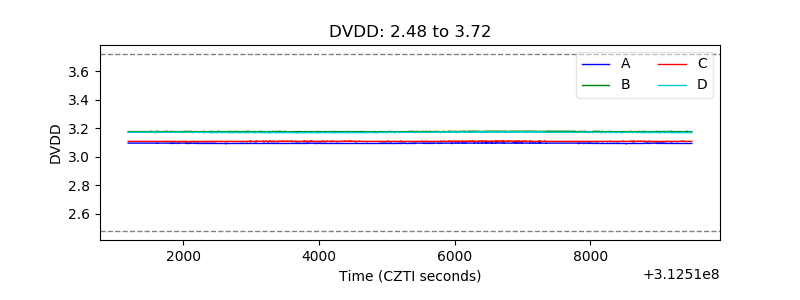 |
| Temperature 1 | 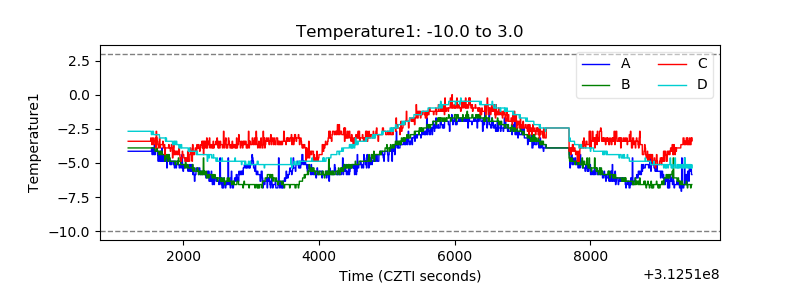 |
| Veto HV Monitor | 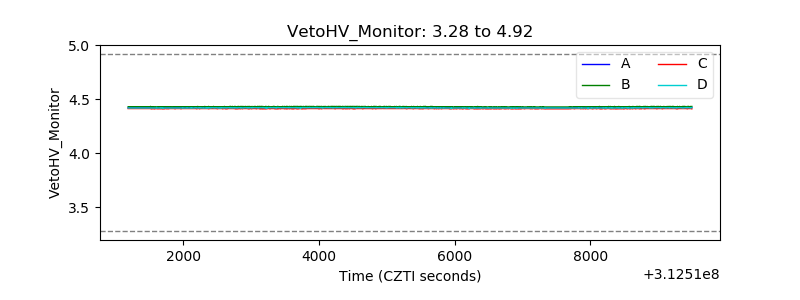 |
| Veto LLD |  |
| Alpha Counter |  |
| _CPM_Rate | 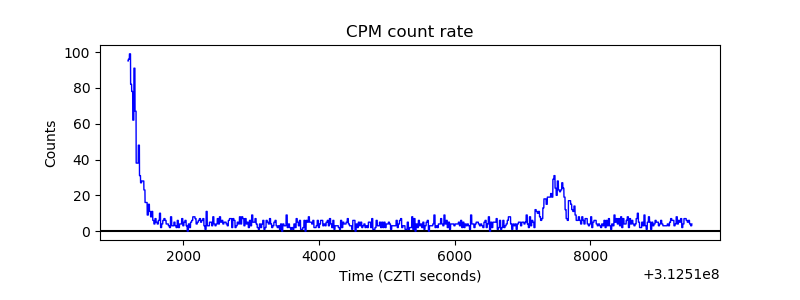 |
| CZT Counter | 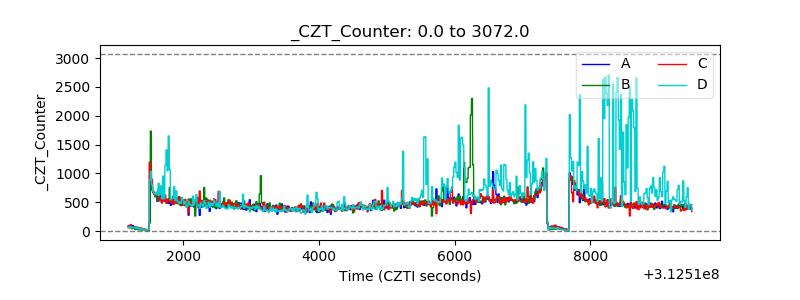 |
| +2.5 Volts monitor |  |
| +5 Volts monitor | 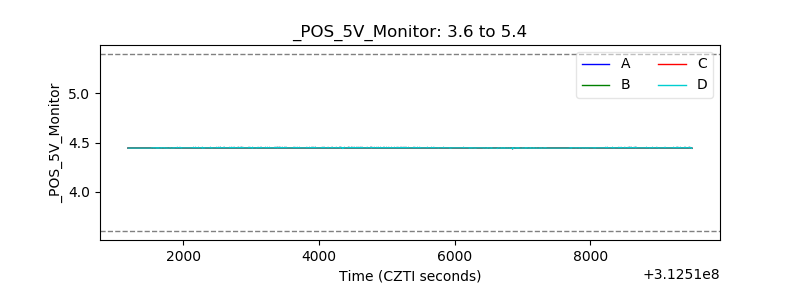 |
| _ROLL_ROT |  |
| _Roll_DEC |  |
| _Roll_RA | 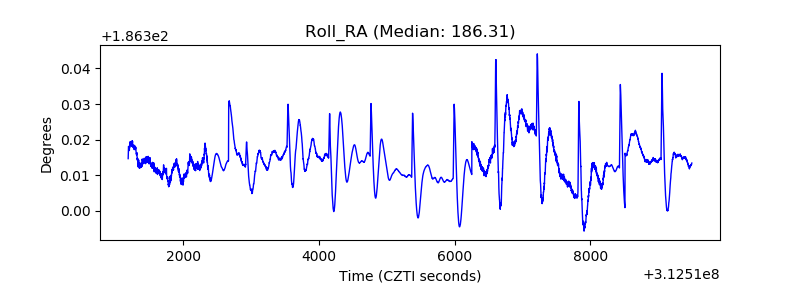 |
| Veto Counter | 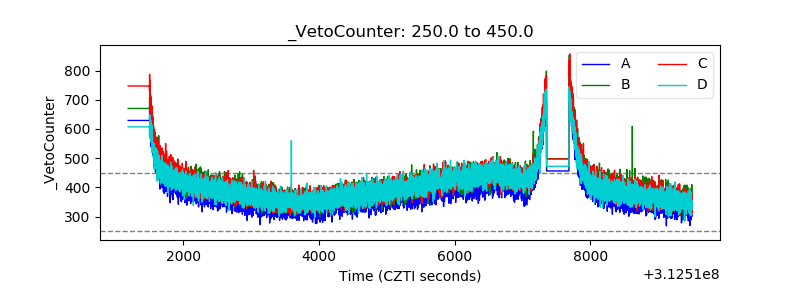 |