| Param | Original file | Final file |
|---|---|---|
| Filename | modeM0/AS1A08_003T01_9000003342_22516cztM0_level2.evt | modeM0/AS1A08_003T01_9000003342_22516cztM0_level2_quad_clean.evt |
| Size (bytes) | 1,824,168,960 | 312,937,920 |
| Size | 1.7 GB | 298.4 MB |
| Events in quadrant A | 11,690,972 | 1,966,505 |
| Events in quadrant B | 12,823,186 | 2,009,931 |
| Events in quadrant C | 11,858,482 | 1,937,907 |
| Events in quadrant D | 17,193,412 | 1,852,975 |
| Mode M9 | |||
|---|---|---|---|
| Quadrant | BADHDUFLAG | Total packets | Discarded packets |
| A | 0 | 20 | 0 |
| B | 0 | 21 | 0 |
| C | 0 | 21 | 0 |
| D | 0 | 21 | 0 |
| Mode M0 | |||
|---|---|---|---|
| Quadrant | BADHDUFLAG | Total packets | Discarded packets |
| A | 0 | 51188 | 5 |
| B | 0 | 54509 | 5 |
| C | 0 | 51311 | 5 |
| D | 0 | 67811 | 5 |
| Mode SS | |||
|---|---|---|---|
| Quadrant | BADHDUFLAG | Total packets | Discarded packets |
| A | 0 | 506 | 0 |
| B | 0 | 506 | 0 |
| C | 0 | 506 | 0 |
| D | 0 | 506 | 0 |
| Quadrant | Total seconds | Saturated seconds | Saturation percentage |
|---|---|---|---|
| A | 24860 | 272 | 1.094127% |
| B | 24860 | 635 | 2.554304% |
| C | 24860 | 443 | 1.781979% |
| D | 24859 | 1402 | 5.639809% |
Noise dominated data is calculated using 1-second bins in cleaned event files. If a bin has >2000 counts, and if more than 50% of those come from <1% of pixels, then it is considered to be noise-dominated and hence unusable.
| Quadrant | # 1 sec bins | Bins with >0 counts | Bins with >2000 counts | High rate bins dominated by noise | Noise dominated (total time) | Noise dominated (detector-on time) | Marked lightcurve |
|---|---|---|---|---|---|---|---|
| A | 26821 | 24863 | 0 | 0 | 0.00% | 0.00% | 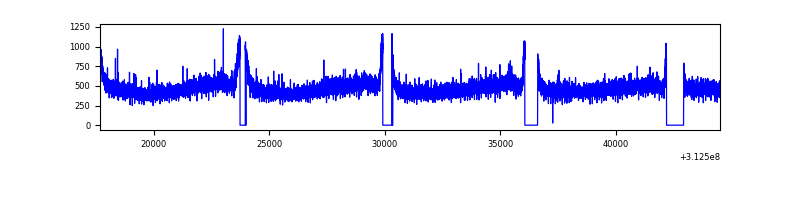 |
| B | 26821 | 24861 | 103 | 103 | 0.38% | 0.41% | 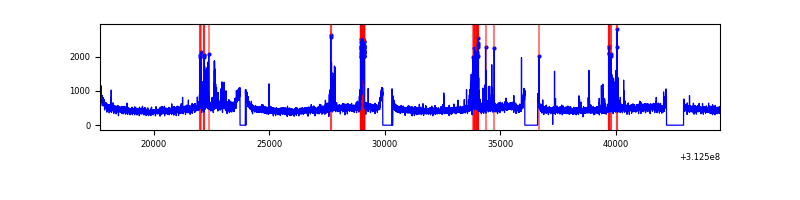 |
| C | 26821 | 24863 | 0 | 0 | 0.00% | 0.00% | 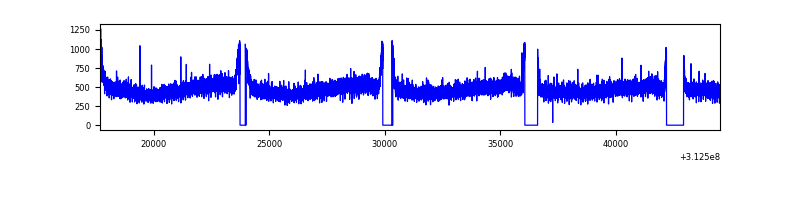 |
| D | 26820 | 24862 | 1206 | 1206 | 4.50% | 4.85% | 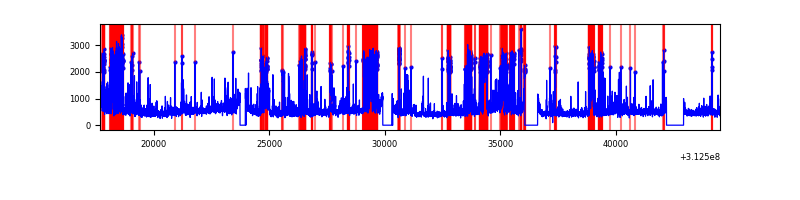 |
Top three noisy pixels from each quadrant. If the there are fewer than three noisy pixels in the level2.evt file, extra rows are filled as -1
| Pixel properties | Quadrant properties | ||||||
|---|---|---|---|---|---|---|---|
| Quadrant | DetID | PixID | Counts | Sigma | Mean | Median | Sigma |
| A | 13 | 254 | 38959 | 59.03 | 3030 | 2963 | 609.8 |
| A | 3 | 137 | 26725 | 38.97 | 3030 | 2963 | 609.8 |
| A | 0 | 226 | 26162 | 38.05 | 3030 | 2963 | 609.8 |
| B | 15 | 33 | 931963 | 1606.56 | 3009 | 2925 | 578.3 |
| B | 12 | 111 | 72141 | 119.69 | 3009 | 2925 | 578.3 |
| B | 11 | 111 | 63586 | 104.9 | 3009 | 2925 | 578.3 |
| C | 14 | 238 | 458252 | 662.92 | 2915 | 2933 | 686.8 |
| C | 0 | 10 | 27260 | 35.42 | 2915 | 2933 | 686.8 |
| C | 13 | 61 | 20143 | 25.06 | 2915 | 2933 | 686.8 |
| D | 1 | 52 | 5850235 | 8237.26 | 2901 | 2812 | 709.9 |
| D | 12 | 227 | 154528 | 213.72 | 2901 | 2812 | 709.9 |
| D | 2 | 234 | 104373 | 143.07 | 2901 | 2812 | 709.9 |
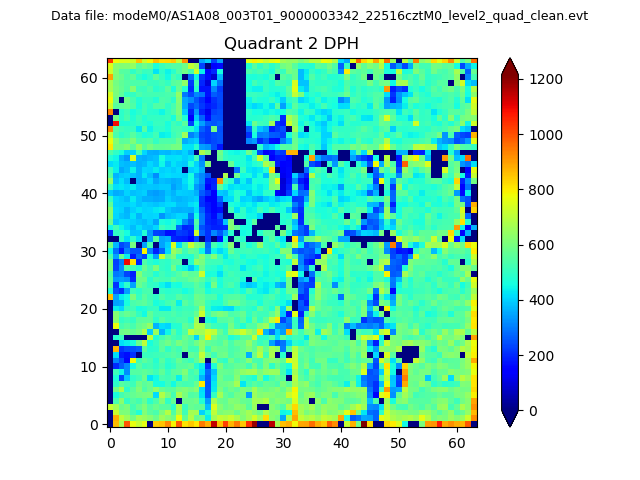
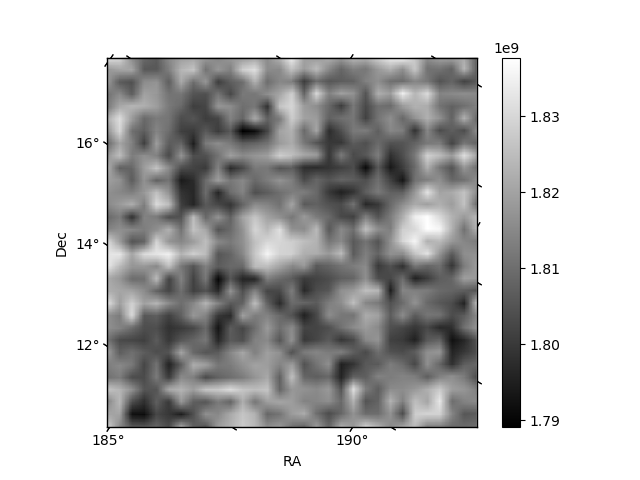
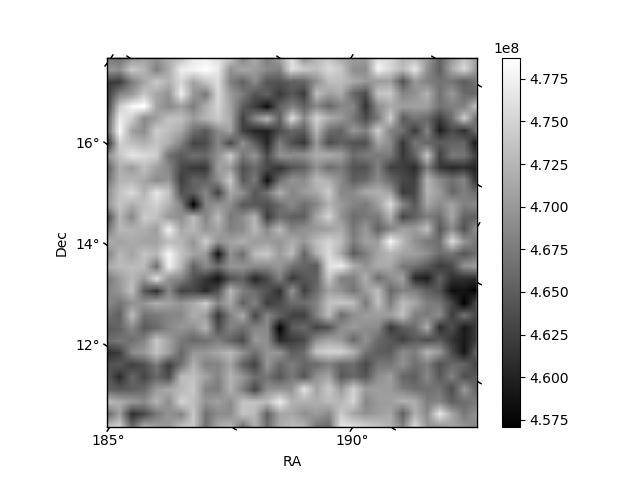
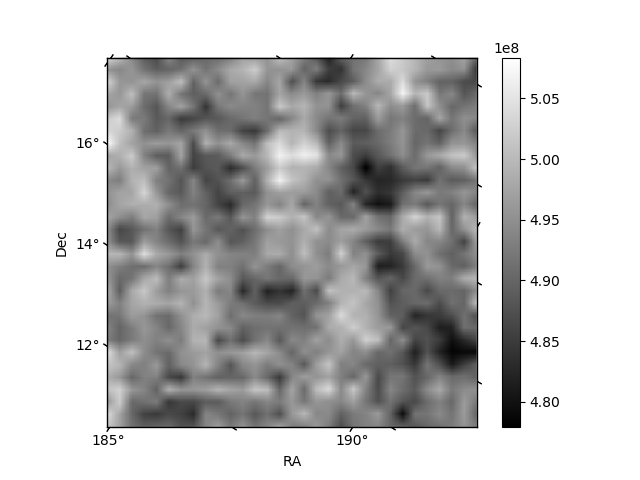
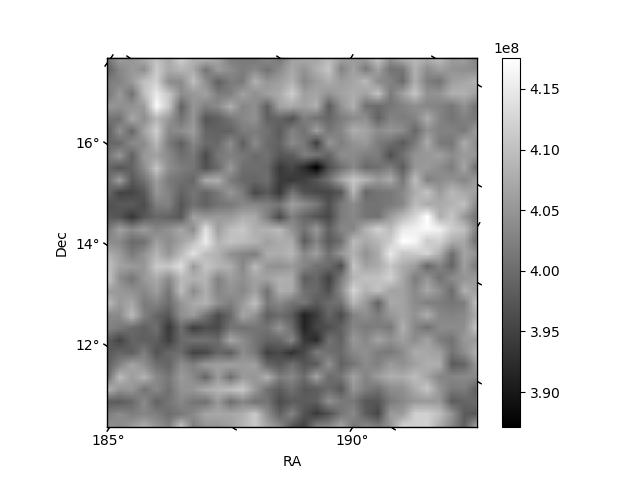
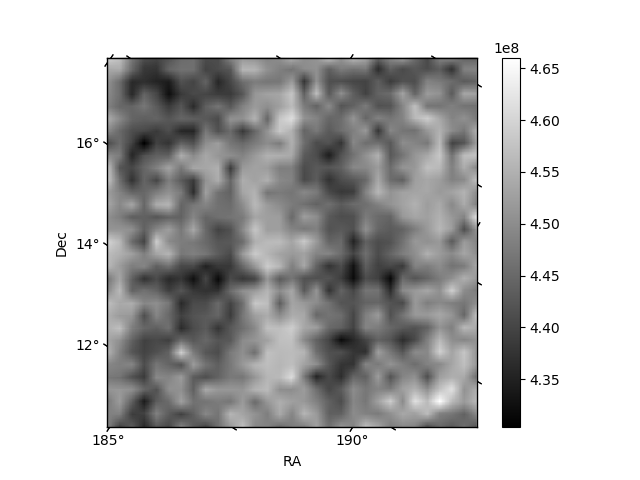
Histogram calculated using DETX and DETY for each event in the final _common_clean file
| Quadrant A | 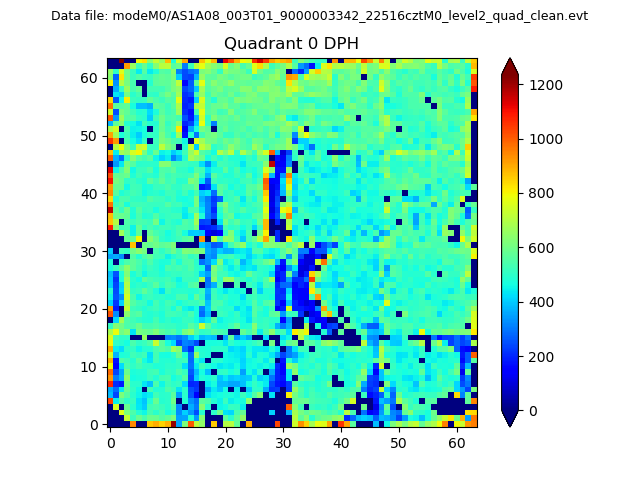 |
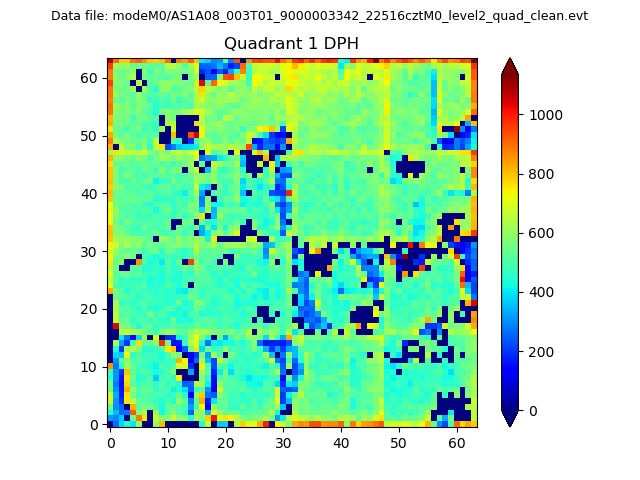 |
Quadrant B |
|---|---|---|---|
| Quadrant D | 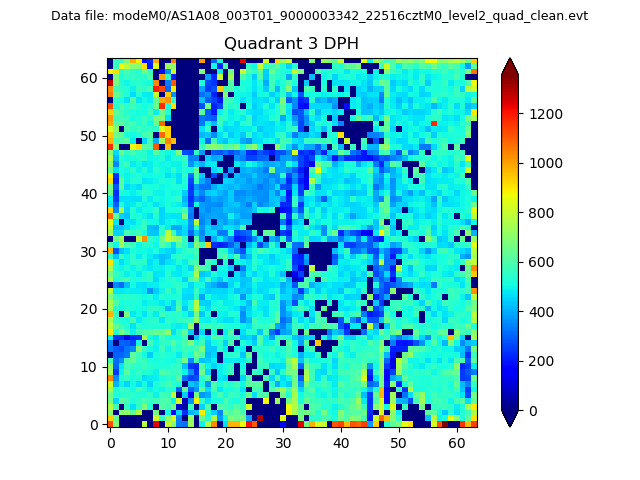 |
 |
Quadrant C |
| Plot type | Count rate plots | Images |
|---|---|---|
| Comparison with Poisson distribution Blue bars denote a histogram of data divided into 1 sec bins. Red curve is a Poisson curve with rate = median count rate of data. |
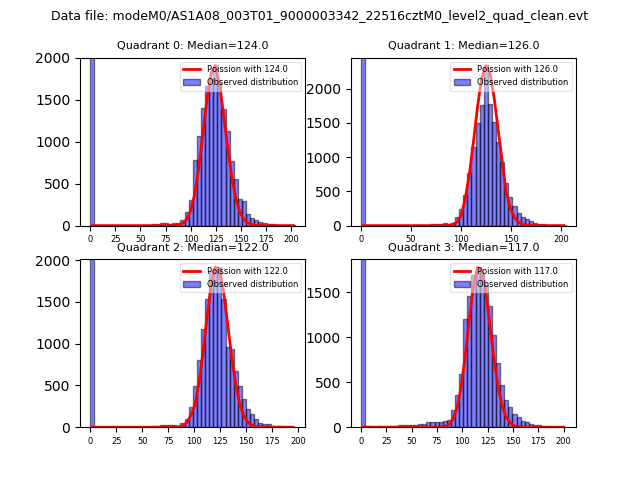 |
 |
| Quadrant-wise count rates Data is divided into 100 sec bins |
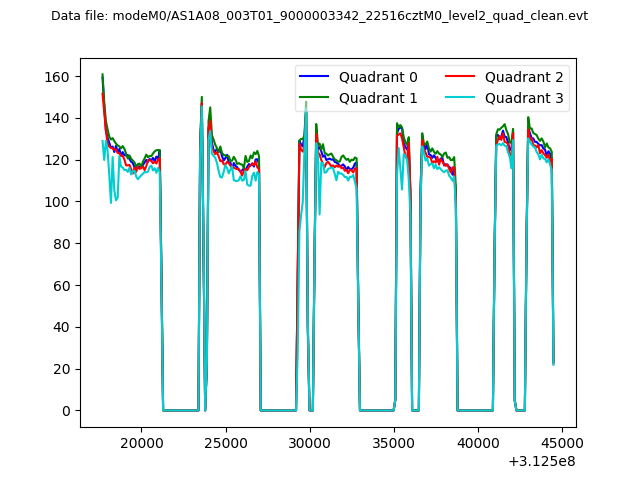 |
|
| Module-wise count rates for Quadrant A Data is divided into 100 sec bins |
 |
 |
| Module-wise count rates for Quadrant B Data is divided into 100 sec bins |
 |
 |
| Module-wise count rates for Quadrant C Data is divided into 100 sec bins |
 |
 |
| Module-wise count rates for Quadrant D Data is divided into 100 sec bins |
 |
 |
| Parameter | Plot |
|---|---|
| CZT HV Monitor |  |
| D_VDD |  |
| Temperature 1 | 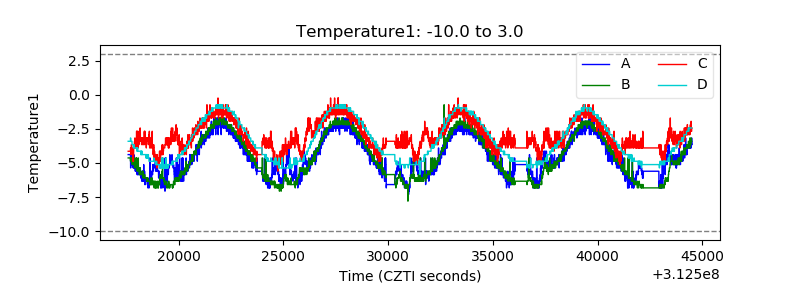 |
| Veto HV Monitor | 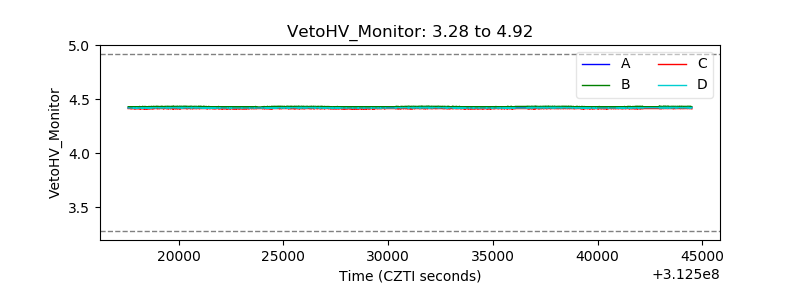 |
| Veto LLD |  |
| Alpha Counter | 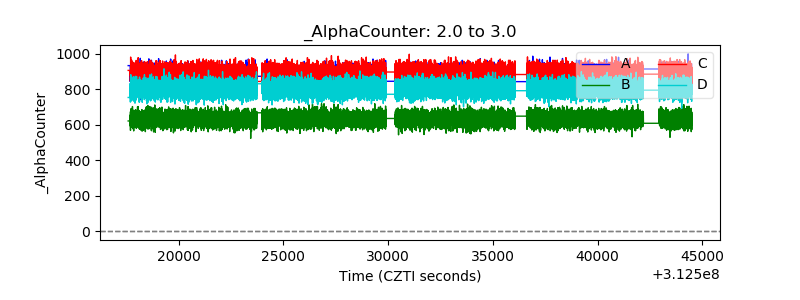 |
| _CPM_Rate | 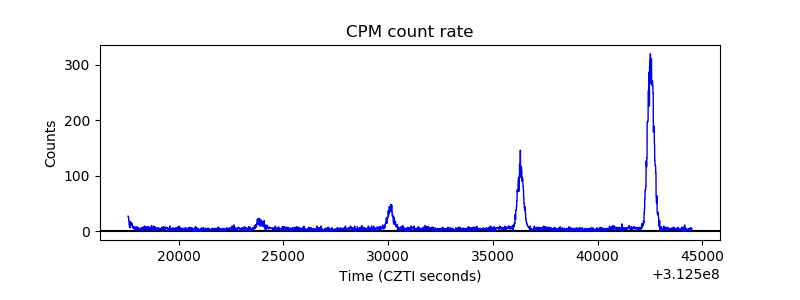 |
| CZT Counter | 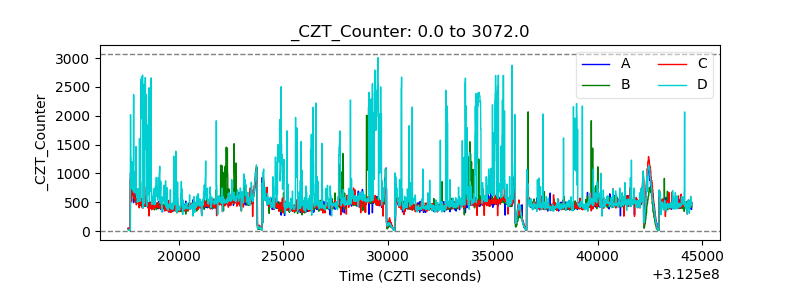 |
| +2.5 Volts monitor |  |
| +5 Volts monitor | 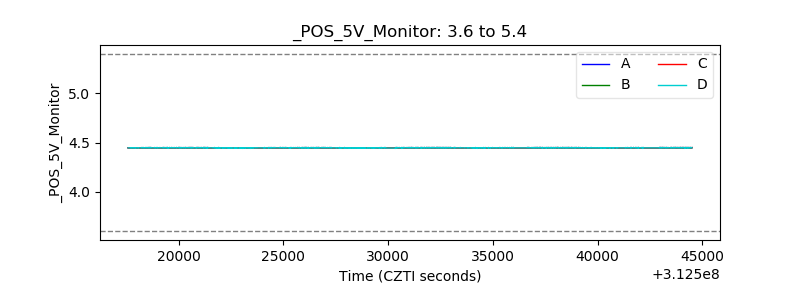 |
| _ROLL_ROT |  |
| _Roll_DEC | 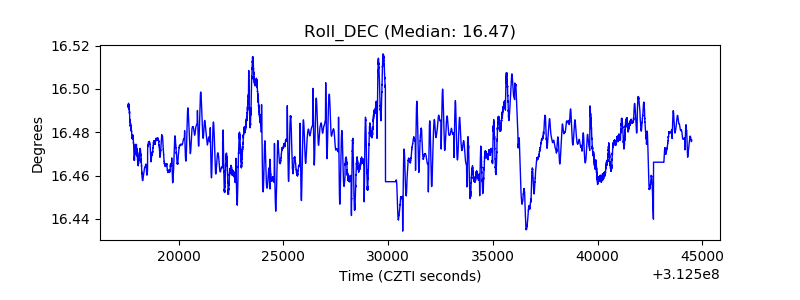 |
| _Roll_RA | 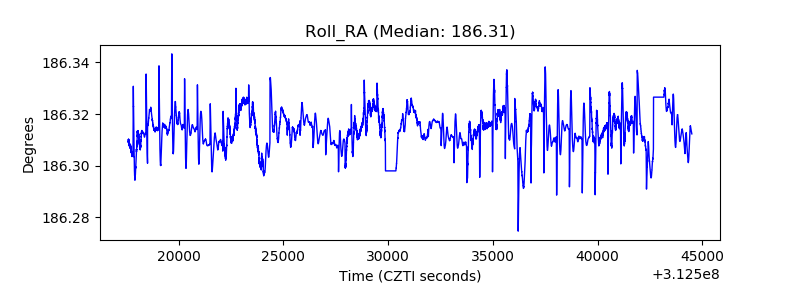 |
| Veto Counter |  |