| Param | Original file | Final file |
|---|---|---|
| Filename | modeM0/AS1A08_003T01_9000003342_22522cztM0_level2.evt | modeM0/AS1A08_003T01_9000003342_22522cztM0_level2_quad_clean.evt |
| Size (bytes) | 498,905,280 | 66,726,720 |
| Size | 475.8 MB | 63.6 MB |
| Events in quadrant A | 3,500,080 | 396,094 |
| Events in quadrant B | 3,788,063 | 402,991 |
| Events in quadrant C | 3,620,485 | 393,210 |
| Events in quadrant D | 3,771,251 | 386,193 |
| Mode M9 | |||
|---|---|---|---|
| Quadrant | BADHDUFLAG | Total packets | Discarded packets |
| A | 0 | 17 | 0 |
| B | 0 | 18 | 0 |
| C | 0 | 18 | 0 |
| D | 0 | 18 | 0 |
| Mode M0 | |||
|---|---|---|---|
| Quadrant | BADHDUFLAG | Total packets | Discarded packets |
| A | 0 | 14494 | 2 |
| B | 0 | 15308 | 2 |
| C | 0 | 14875 | 2 |
| D | 0 | 15481 | 2 |
| Mode SS | |||
|---|---|---|---|
| Quadrant | BADHDUFLAG | Total packets | Discarded packets |
| A | 0 | 128 | 0 |
| B | 0 | 128 | 0 |
| C | 0 | 128 | 0 |
| D | 0 | 128 | 0 |
| Quadrant | Total seconds | Saturated seconds | Saturation percentage |
|---|---|---|---|
| A | 6333 | 94 | 1.484289% |
| B | 6333 | 176 | 2.779094% |
| C | 6333 | 169 | 2.668562% |
| D | 6333 | 109 | 1.721143% |
Noise dominated data is calculated using 1-second bins in cleaned event files. If a bin has >2000 counts, and if more than 50% of those come from <1% of pixels, then it is considered to be noise-dominated and hence unusable.
| Quadrant | # 1 sec bins | Bins with >0 counts | Bins with >2000 counts | High rate bins dominated by noise | Noise dominated (total time) | Noise dominated (detector-on time) | Marked lightcurve |
|---|---|---|---|---|---|---|---|
| A | 7633 | 6333 | 0 | 0 | 0.00% | 0.00% | 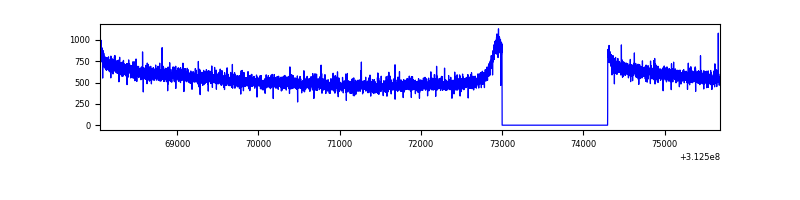 |
| B | 7633 | 6333 | 23 | 23 | 0.30% | 0.36% | 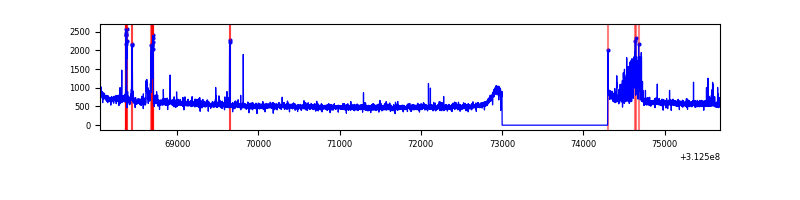 |
| C | 7633 | 6333 | 0 | 0 | 0.00% | 0.00% | 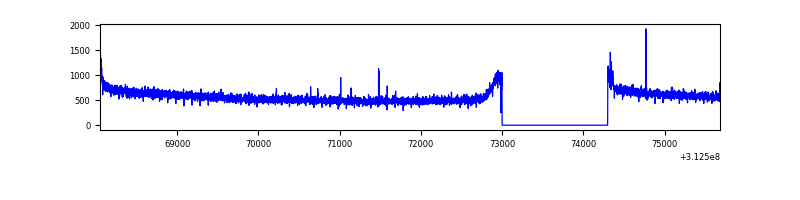 |
| D | 7633 | 6333 | 18 | 18 | 0.24% | 0.28% | 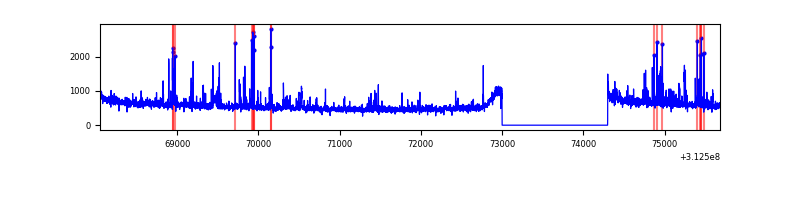 |
Top three noisy pixels from each quadrant. If the there are fewer than three noisy pixels in the level2.evt file, extra rows are filled as -1
| Pixel properties | Quadrant properties | ||||||
|---|---|---|---|---|---|---|---|
| Quadrant | DetID | PixID | Counts | Sigma | Mean | Median | Sigma |
| A | 13 | 254 | 9547 | 48.15 | 908 | 893 | 179.7 |
| A | 0 | 226 | 8120 | 40.21 | 908 | 893 | 179.7 |
| A | 3 | 137 | 7047 | 34.24 | 908 | 893 | 179.7 |
| B | 15 | 33 | 216297 | 1283.7 | 900 | 883 | 167.8 |
| B | 4 | 171 | 21192 | 121.03 | 900 | 883 | 167.8 |
| B | 12 | 111 | 18780 | 106.65 | 900 | 883 | 167.8 |
| C | 14 | 238 | 140189 | 683.48 | 886 | 897 | 203.8 |
| C | 0 | 10 | 15131 | 69.84 | 886 | 897 | 203.8 |
| C | 0 | 239 | 10259 | 45.94 | 886 | 897 | 203.8 |
| D | 1 | 52 | 312619 | 1432.45 | 898 | 875 | 217.6 |
| D | 13 | 249 | 27840 | 123.9 | 898 | 875 | 217.6 |
| D | 2 | 234 | 26158 | 116.17 | 898 | 875 | 217.6 |
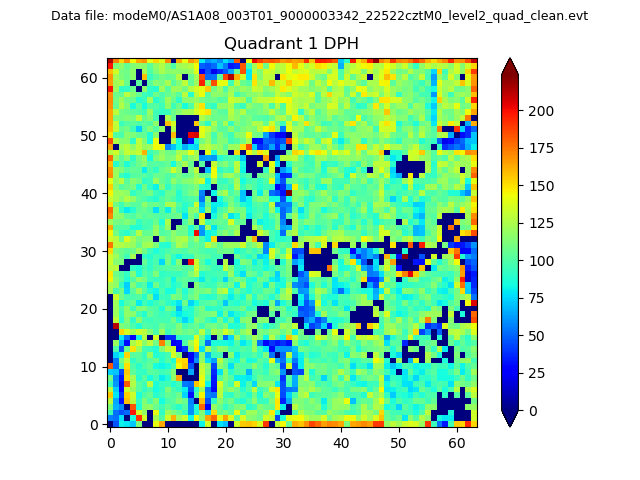
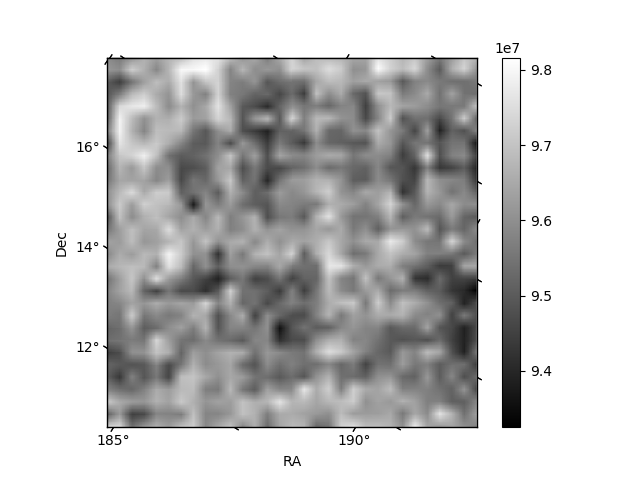
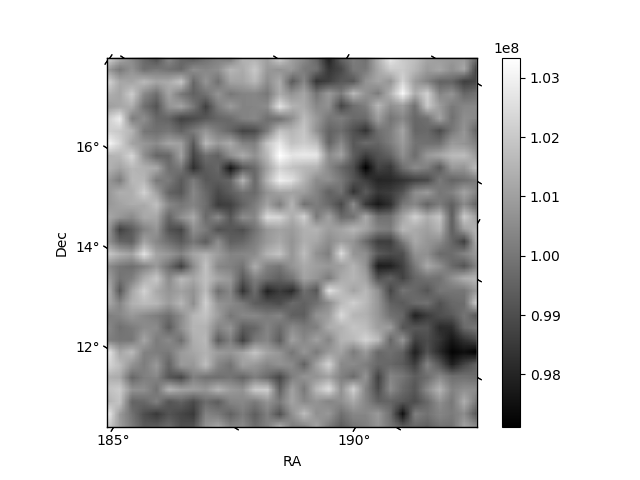
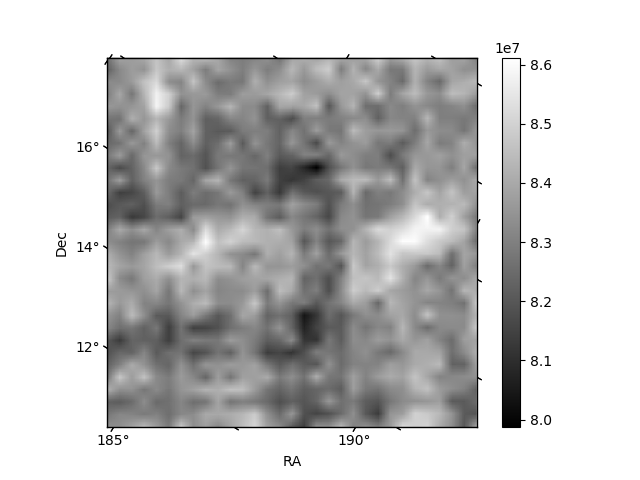
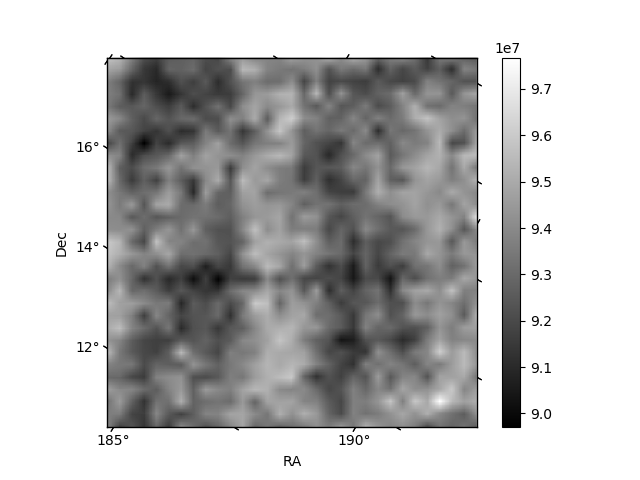
Histogram calculated using DETX and DETY for each event in the final _common_clean file
| Quadrant A |  |
 |
Quadrant B |
|---|---|---|---|
| Quadrant D | 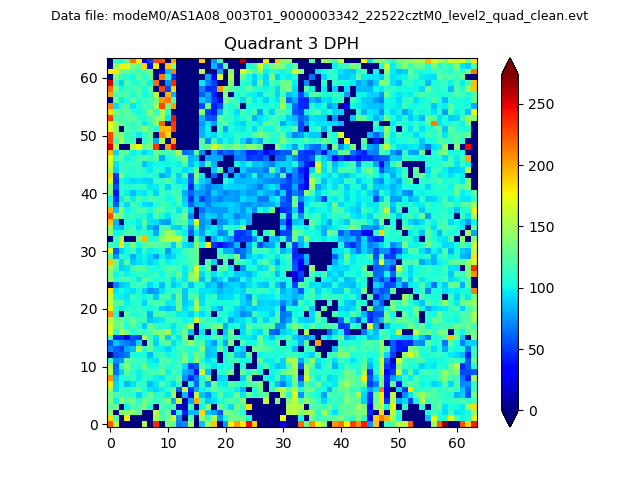 |
 |
Quadrant C |
| Plot type | Count rate plots | Images |
|---|---|---|
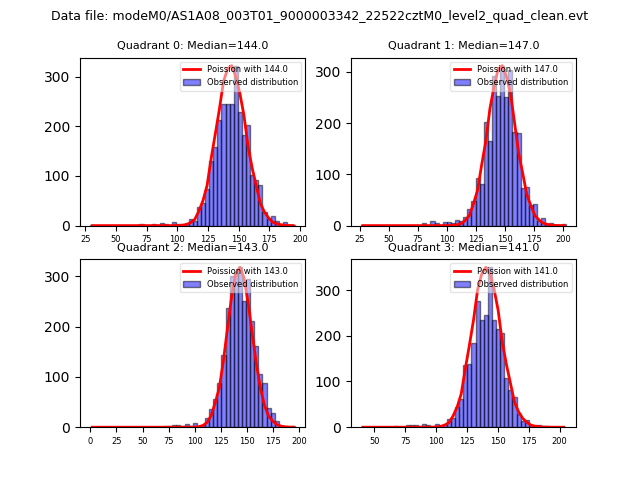
| Comparison with Poisson distribution Blue bars denote a histogram of data divided into 1 sec bins. Red curve is a Poisson curve with rate = median count rate of data. |
 |
 |
| Quadrant-wise count rates Data is divided into 100 sec bins |
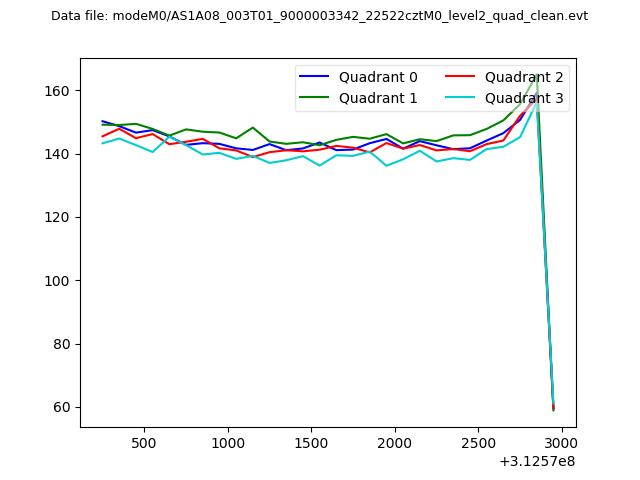 |
|
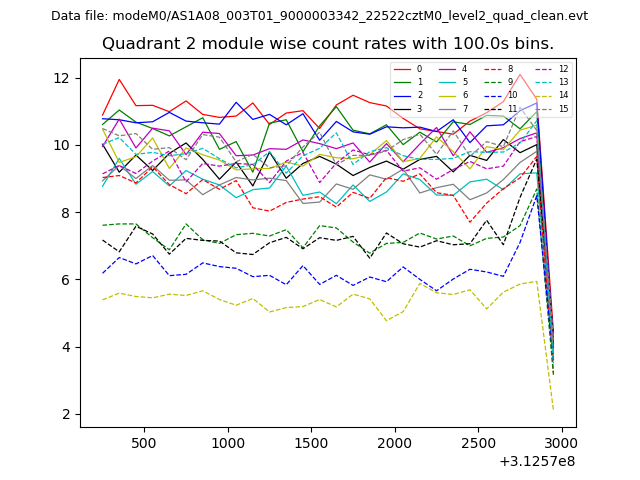
| Module-wise count rates for Quadrant A Data is divided into 100 sec bins |
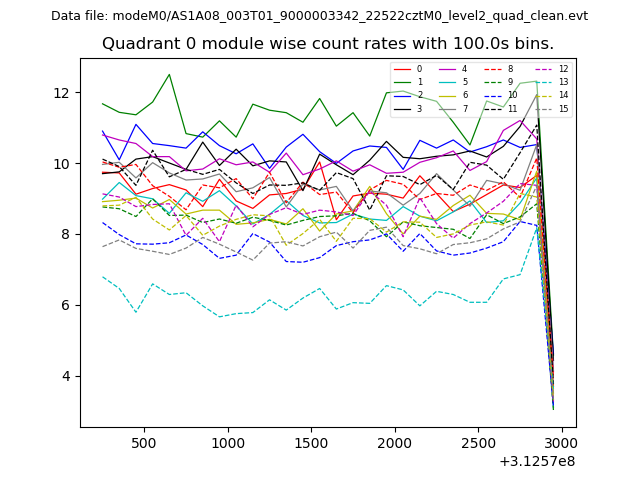 |
 |
| Module-wise count rates for Quadrant B Data is divided into 100 sec bins |
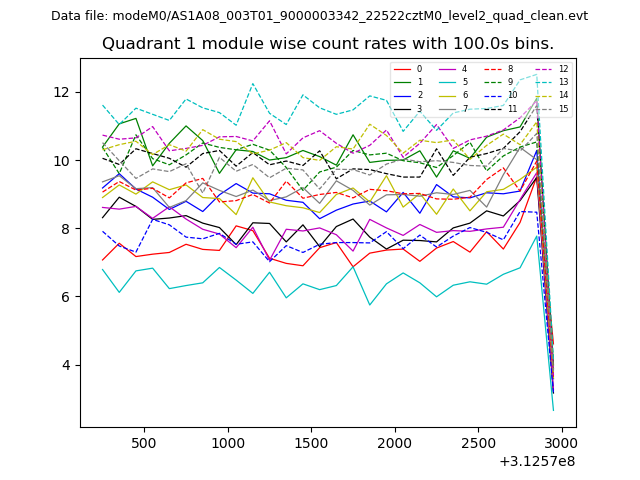 |
 |
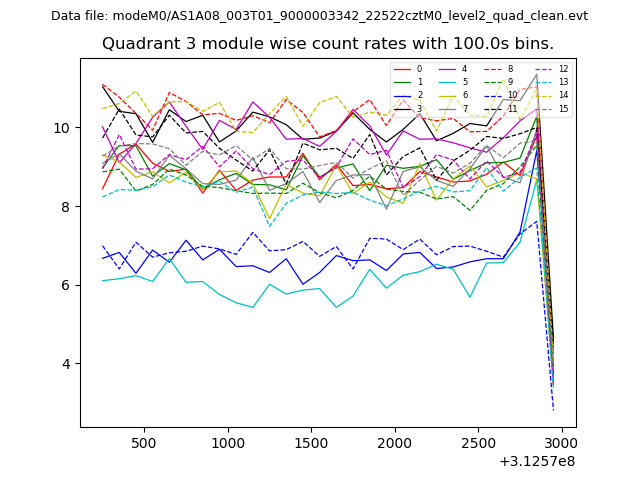
| Module-wise count rates for Quadrant C Data is divided into 100 sec bins |
 |
 |
| Module-wise count rates for Quadrant D Data is divided into 100 sec bins |
 |
 |
| Parameter | Plot |
|---|---|
| CZT HV Monitor | 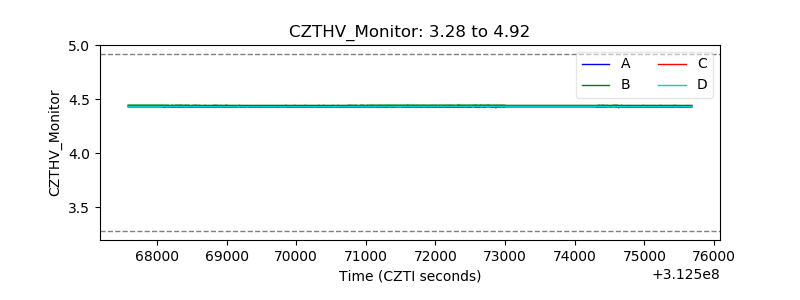 |
| D_VDD | 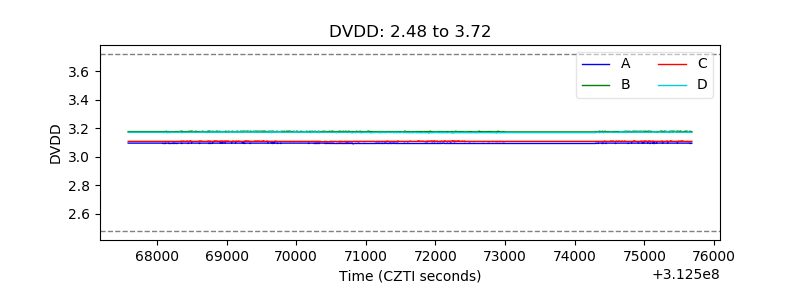 |
| Temperature 1 | 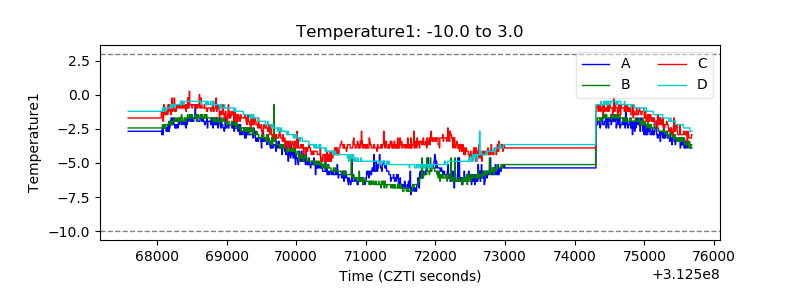 |
| Veto HV Monitor | 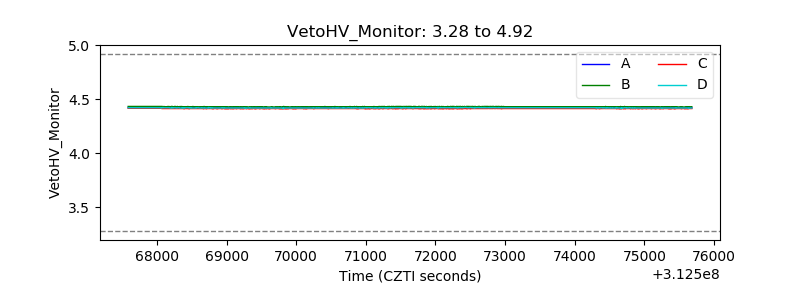 |
| Veto LLD | 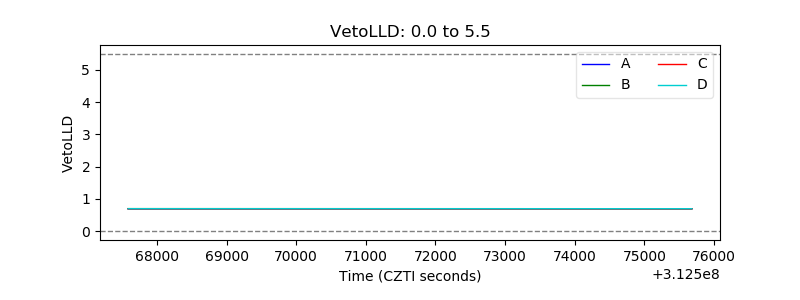 |
| Alpha Counter | 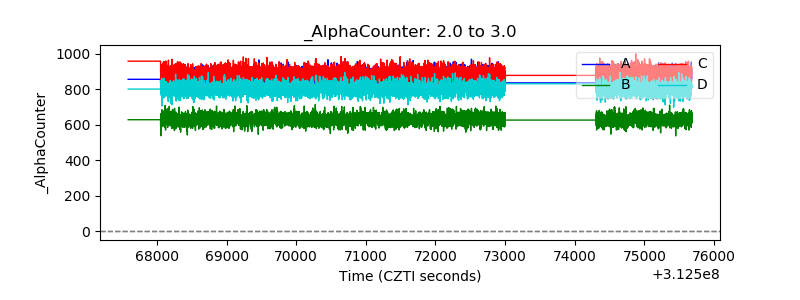 |
| _CPM_Rate | 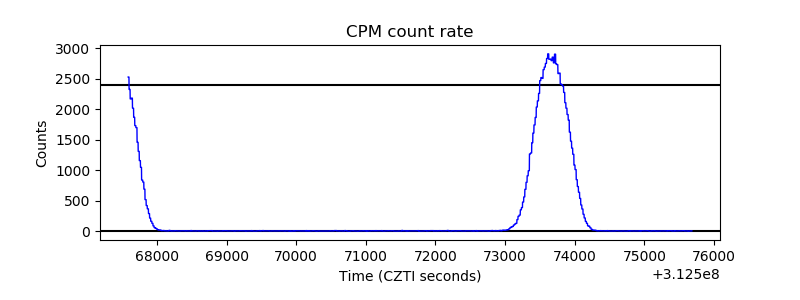 |
| CZT Counter | 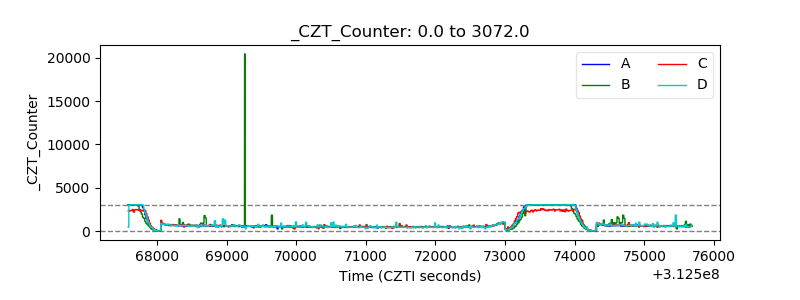 |
| +2.5 Volts monitor |  |
| +5 Volts monitor | 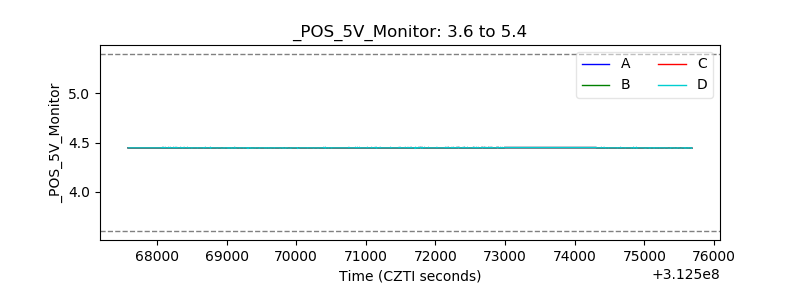 |
| _ROLL_ROT | 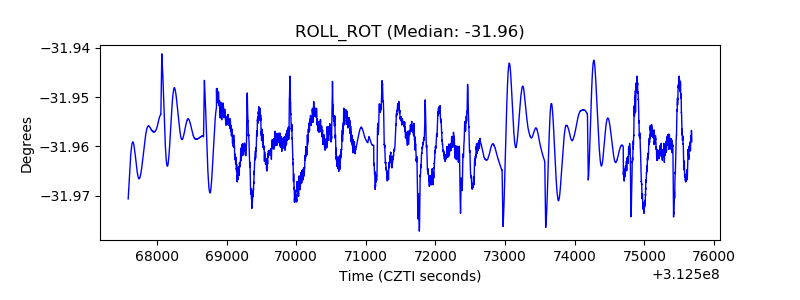 |
| _Roll_DEC | 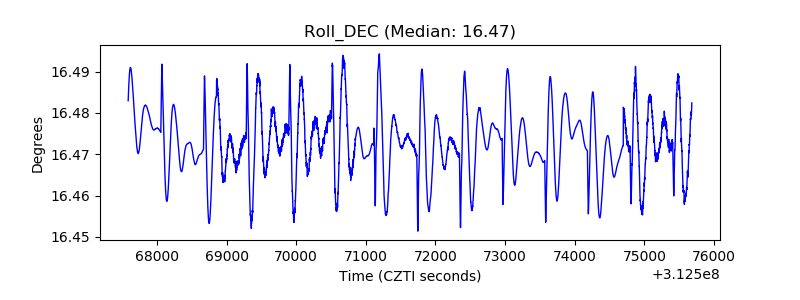 |
| _Roll_RA | 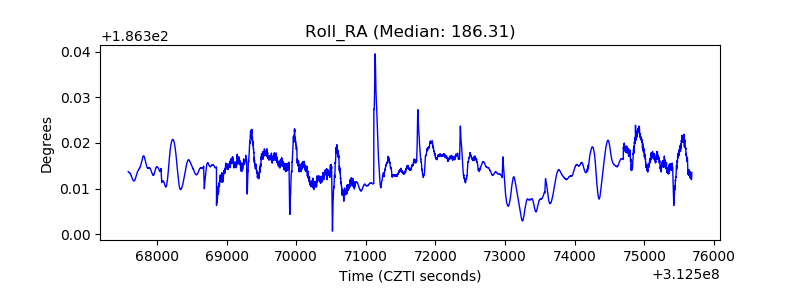 |
| Veto Counter | 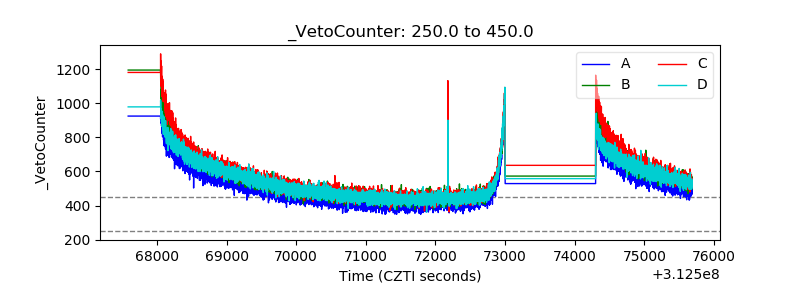 |