| Param | Original file | Final file |
|---|---|---|
| Filename | modeM0/AS1A08_003T01_9000003342_22524cztM0_level2.evt | modeM0/AS1A08_003T01_9000003342_22524cztM0_level2_quad_clean.evt |
| Size (bytes) | 477,679,680 | 88,079,040 |
| Size | 455.6 MB | 84.0 MB |
| Events in quadrant A | 3,337,157 | 557,322 |
| Events in quadrant B | 3,481,463 | 569,321 |
| Events in quadrant C | 3,453,519 | 552,864 |
| Events in quadrant D | 3,756,772 | 538,388 |
| Mode M9 | |||
|---|---|---|---|
| Quadrant | BADHDUFLAG | Total packets | Discarded packets |
| A | 0 | 26 | 0 |
| B | 0 | 26 | 0 |
| C | 0 | 26 | 0 |
| D | 0 | 26 | 0 |
| Mode M0 | |||
|---|---|---|---|
| Quadrant | BADHDUFLAG | Total packets | Discarded packets |
| A | 0 | 13916 | 3 |
| B | 0 | 14429 | 2 |
| C | 0 | 14261 | 2 |
| D | 0 | 15409 | 2 |
| Mode SS | |||
|---|---|---|---|
| Quadrant | BADHDUFLAG | Total packets | Discarded packets |
| A | 0 | 132 | 0 |
| B | 0 | 132 | 0 |
| C | 0 | 132 | 0 |
| D | 0 | 132 | 0 |
| Quadrant | Total seconds | Saturated seconds | Saturation percentage |
|---|---|---|---|
| A | 6445 | 107 | 1.660202% |
| B | 6445 | 140 | 2.172227% |
| C | 6445 | 171 | 2.653220% |
| D | 6445 | 153 | 2.373933% |
Noise dominated data is calculated using 1-second bins in cleaned event files. If a bin has >2000 counts, and if more than 50% of those come from <1% of pixels, then it is considered to be noise-dominated and hence unusable.
| Quadrant | # 1 sec bins | Bins with >0 counts | Bins with >2000 counts | High rate bins dominated by noise | Noise dominated (total time) | Noise dominated (detector-on time) | Marked lightcurve |
|---|---|---|---|---|---|---|---|
| A | 8965 | 6445 | 0 | 0 | 0.00% | 0.00% | 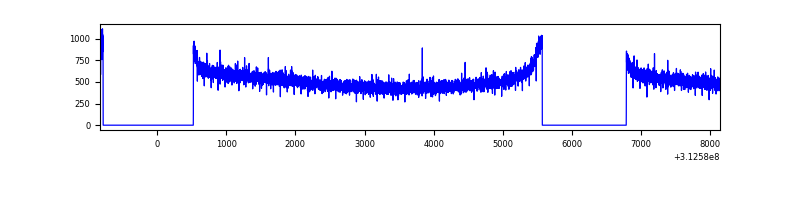 |
| B | 8965 | 6445 | 3 | 3 | 0.03% | 0.05% | 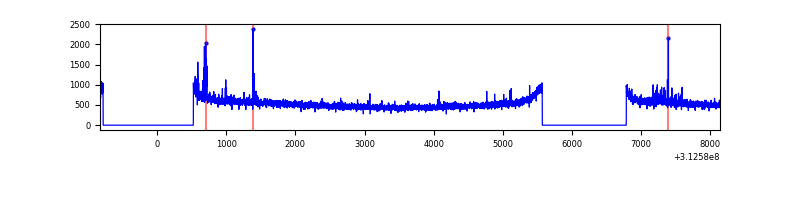 |
| C | 8965 | 6445 | 0 | 0 | 0.00% | 0.00% | 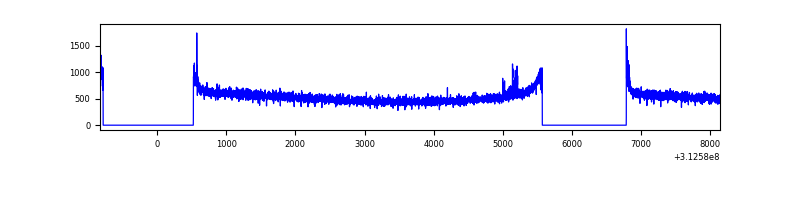 |
| D | 8965 | 6445 | 61 | 61 | 0.68% | 0.95% | 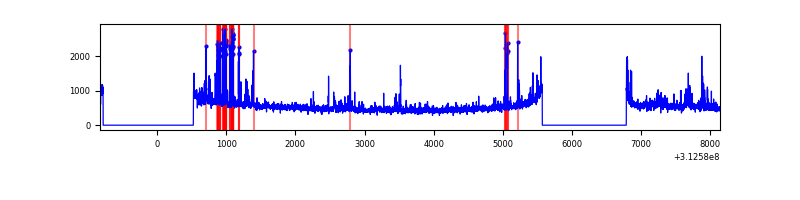 |
Top three noisy pixels from each quadrant. If the there are fewer than three noisy pixels in the level2.evt file, extra rows are filled as -1
| Pixel properties | Quadrant properties | ||||||
|---|---|---|---|---|---|---|---|
| Quadrant | DetID | PixID | Counts | Sigma | Mean | Median | Sigma |
| A | 13 | 254 | 11315 | 60.28 | 865 | 848 | 173.7 |
| A | 0 | 226 | 7692 | 39.41 | 865 | 848 | 173.7 |
| A | 3 | 137 | 7177 | 36.45 | 865 | 848 | 173.7 |
| B | 15 | 33 | 72657 | 442.01 | 865 | 845 | 162.5 |
| B | 12 | 111 | 19324 | 113.74 | 865 | 845 | 162.5 |
| B | 11 | 111 | 17077 | 99.91 | 865 | 845 | 162.5 |
| C | 14 | 238 | 133533 | 679.7 | 840 | 848 | 195.2 |
| C | 0 | 239 | 22895 | 112.94 | 840 | 848 | 195.2 |
| C | 0 | 10 | 17070 | 83.1 | 840 | 848 | 195.2 |
| D | 1 | 52 | 273390 | 1324.53 | 847 | 825 | 205.8 |
| D | 13 | 172 | 199408 | 965.01 | 847 | 825 | 205.8 |
| D | 15 | 145 | 47737 | 227.97 | 847 | 825 | 205.8 |
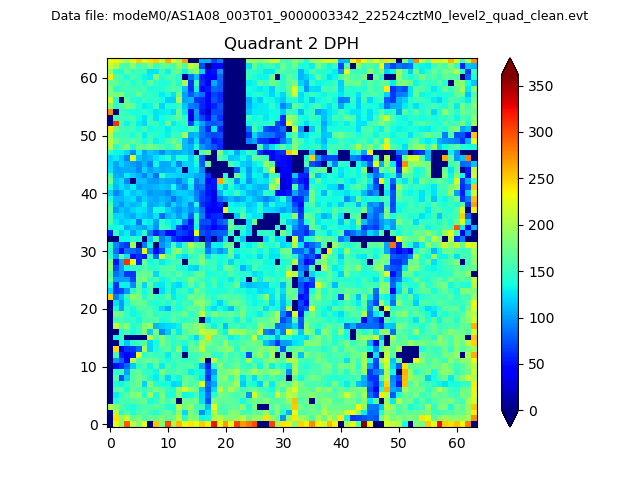
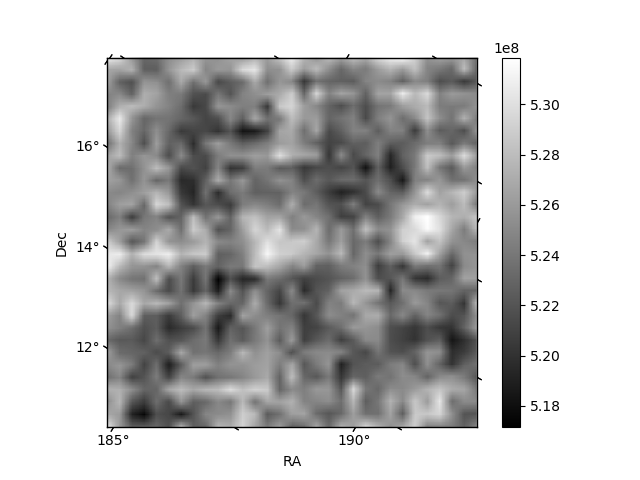
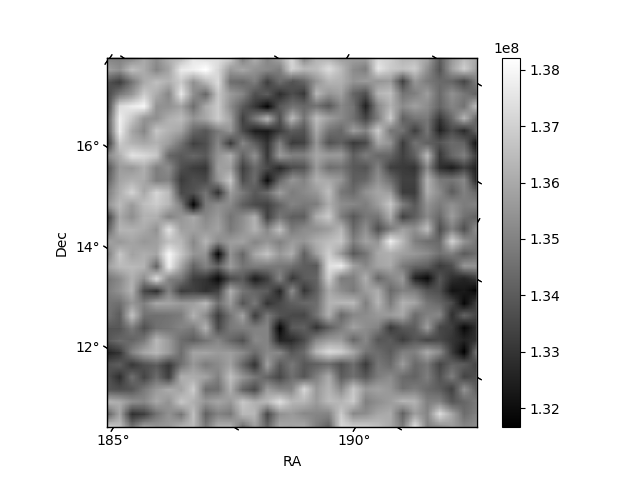
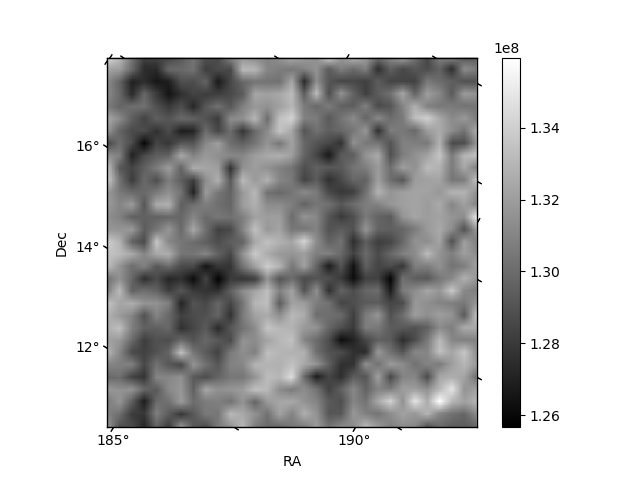
Histogram calculated using DETX and DETY for each event in the final _common_clean file
| Quadrant A | 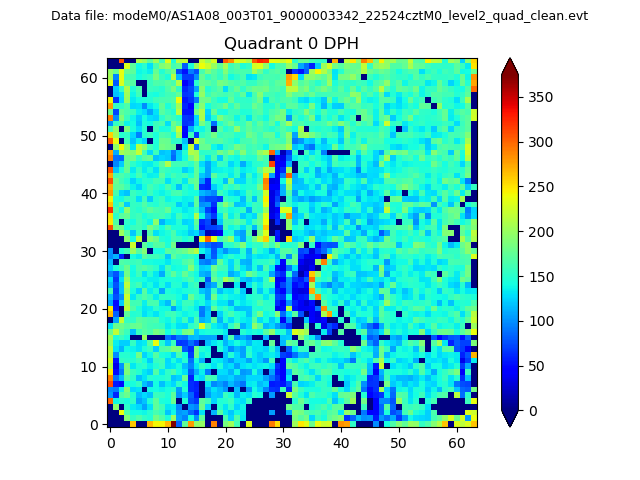 |
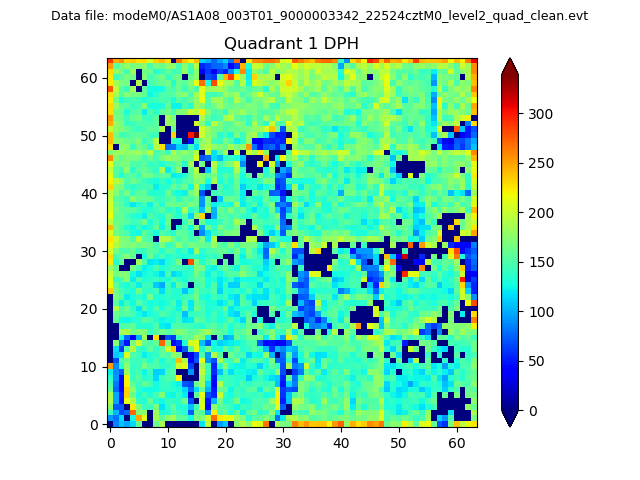 |
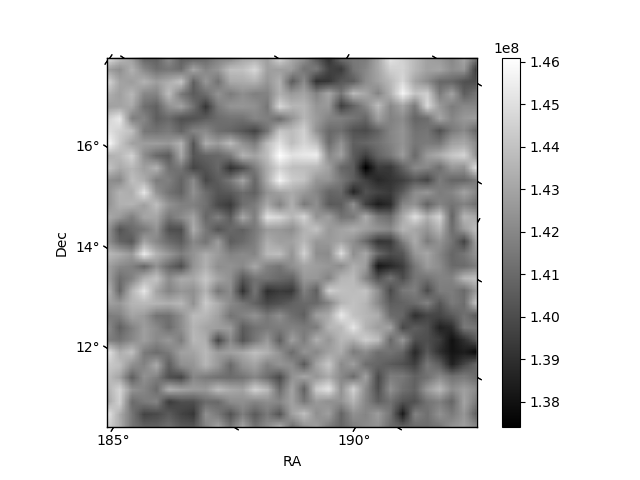
Quadrant B |
|---|---|---|---|
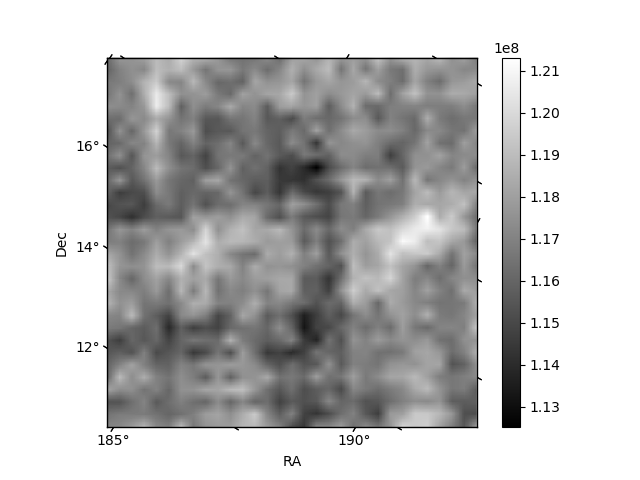
| Quadrant D | 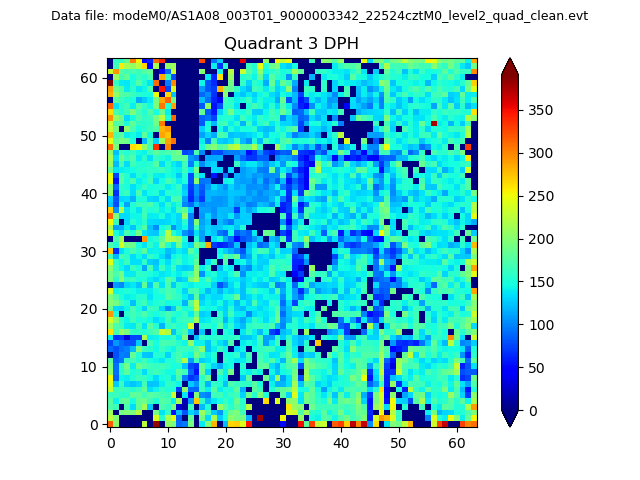 |
 |
Quadrant C |
| Plot type | Count rate plots | Images |
|---|---|---|
| Comparison with Poisson distribution Blue bars denote a histogram of data divided into 1 sec bins. Red curve is a Poisson curve with rate = median count rate of data. |
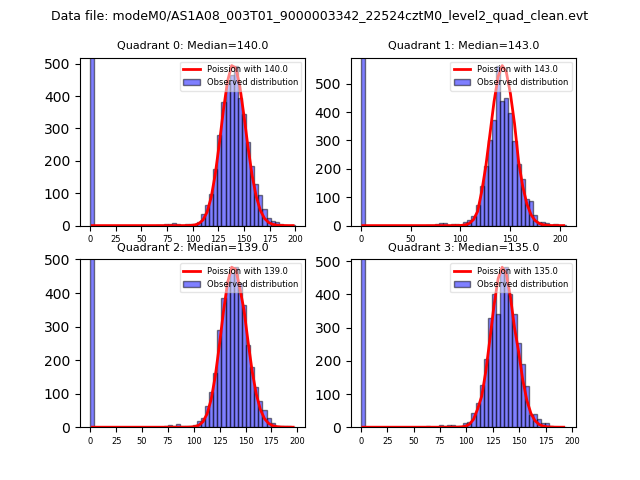 |
 |
| Quadrant-wise count rates Data is divided into 100 sec bins |
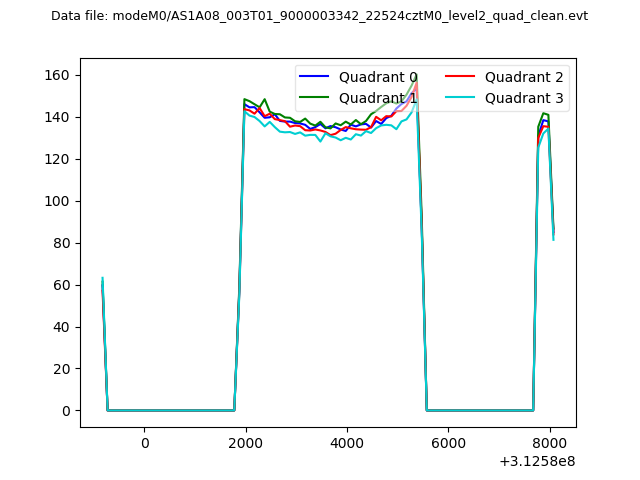 |
|
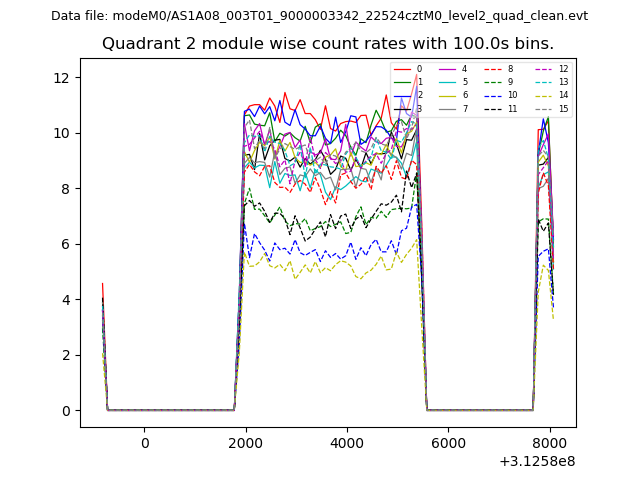
| Module-wise count rates for Quadrant A Data is divided into 100 sec bins |
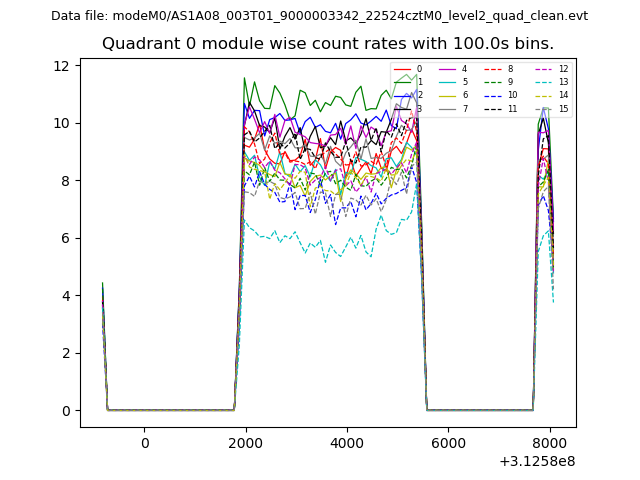 |
 |
| Module-wise count rates for Quadrant B Data is divided into 100 sec bins |
 |
 |
| Module-wise count rates for Quadrant C Data is divided into 100 sec bins |
 |
 |
| Module-wise count rates for Quadrant D Data is divided into 100 sec bins |
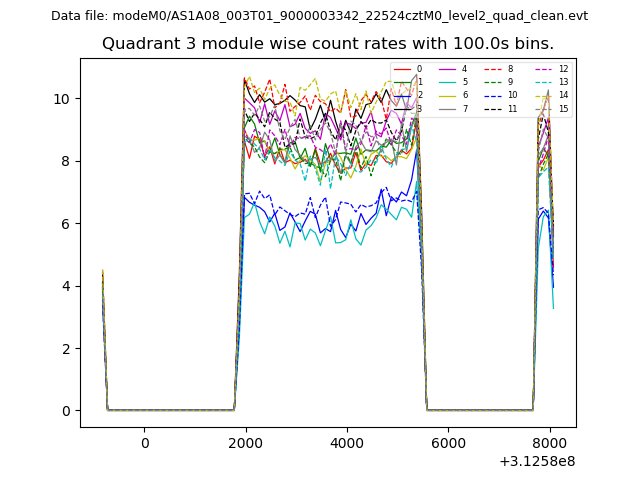 |
 |
| Parameter | Plot |
|---|---|
| CZT HV Monitor | 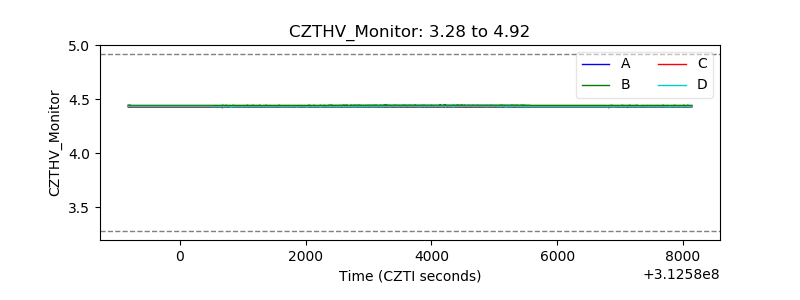 |
| D_VDD | 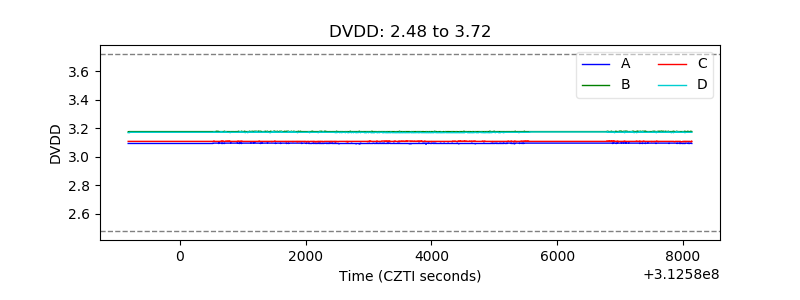 |
| Temperature 1 | 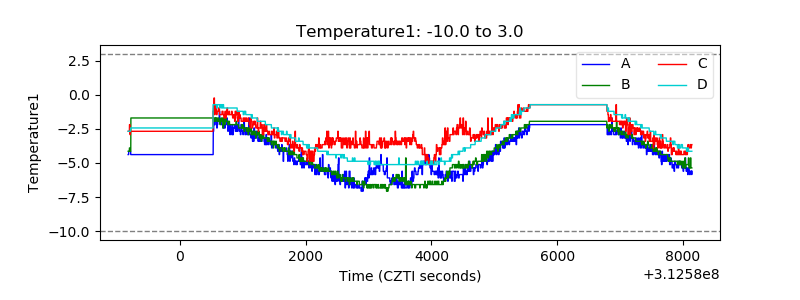 |
| Veto HV Monitor | 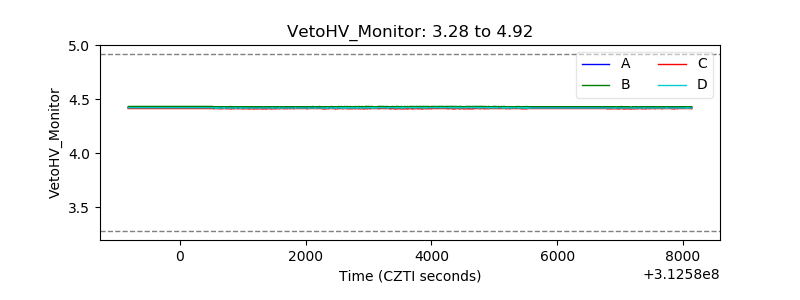 |
| Veto LLD | 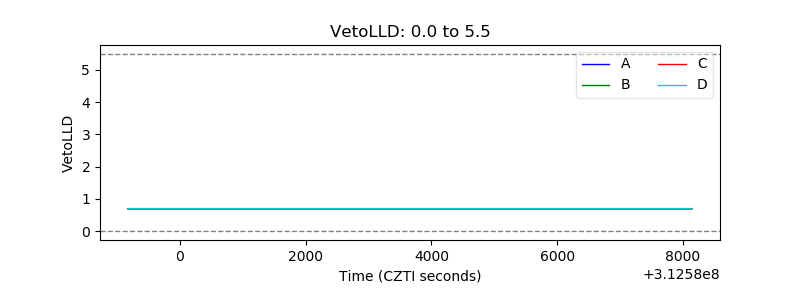 |
| Alpha Counter | 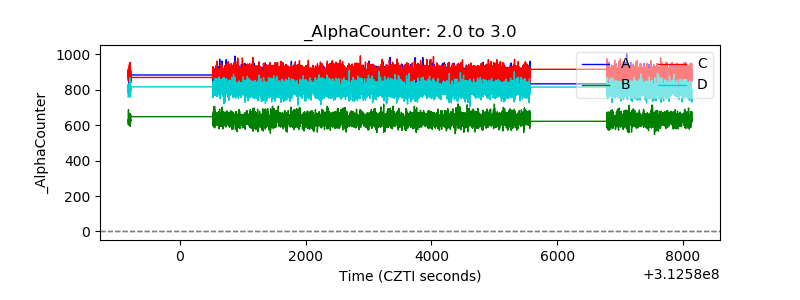 |
| _CPM_Rate | 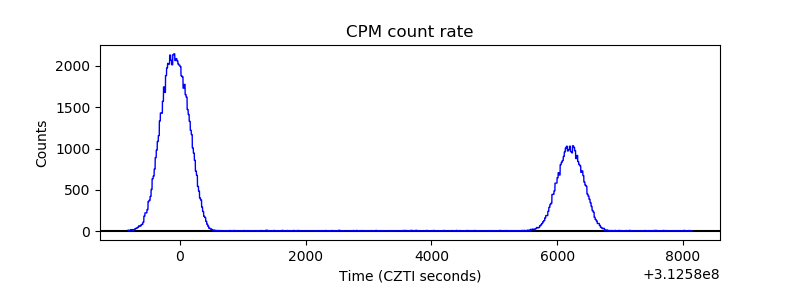 |
| CZT Counter | 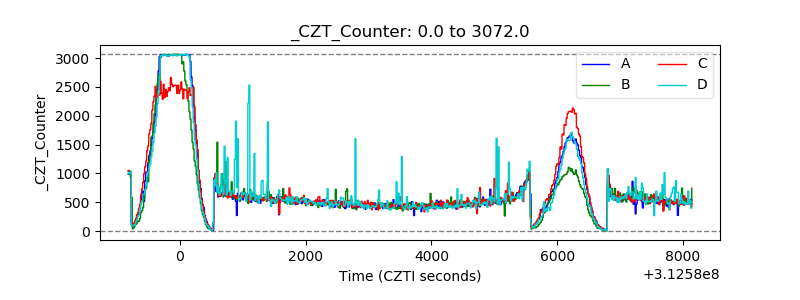 |
| +2.5 Volts monitor |  |
| +5 Volts monitor |  |
| _ROLL_ROT | 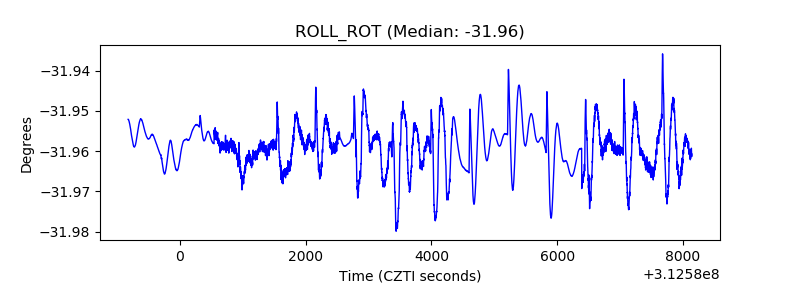 |
| _Roll_DEC | 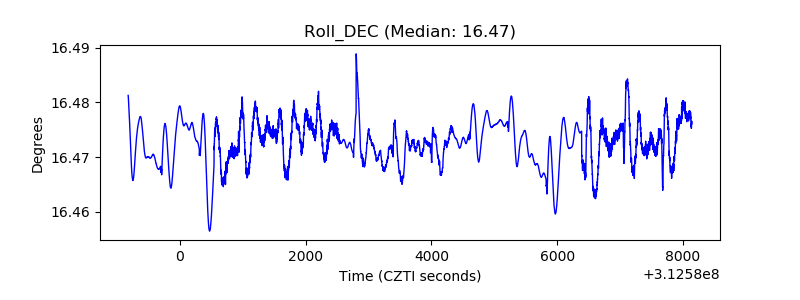 |
| _Roll_RA | 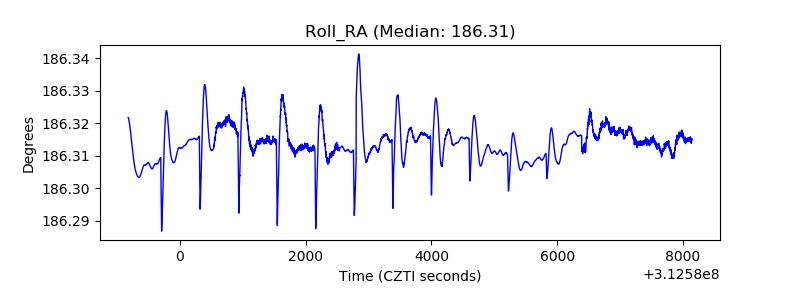 |
| Veto Counter | 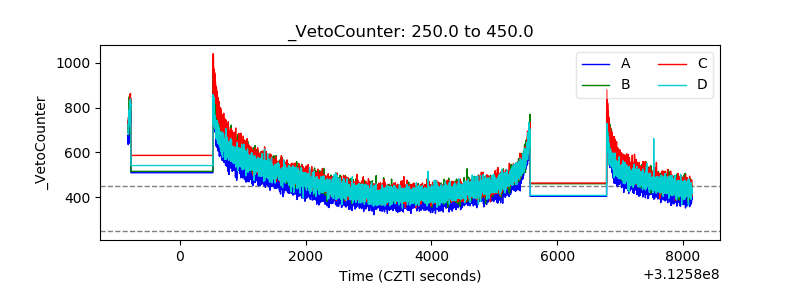 |