| Param | Original file | Final file |
|---|---|---|
| Filename | modeM0/AS1A08_003T01_9000003342_22525cztM0_level2.evt | modeM0/AS1A08_003T01_9000003342_22525cztM0_level2_quad_clean.evt |
| Size (bytes) | 486,204,480 | 92,085,120 |
| Size | 463.7 MB | 87.8 MB |
| Events in quadrant A | 3,352,443 | 580,956 |
| Events in quadrant B | 3,582,534 | 595,402 |
| Events in quadrant C | 3,452,936 | 575,963 |
| Events in quadrant D | 3,874,753 | 562,234 |
| Mode M9 | |||
|---|---|---|---|
| Quadrant | BADHDUFLAG | Total packets | Discarded packets |
| A | 0 | 22 | 0 |
| B | 0 | 22 | 0 |
| C | 0 | 22 | 0 |
| D | 0 | 22 | 0 |
| Mode M0 | |||
|---|---|---|---|
| Quadrant | BADHDUFLAG | Total packets | Discarded packets |
| A | 0 | 14273 | 2 |
| B | 0 | 15011 | 2 |
| C | 0 | 14474 | 2 |
| D | 0 | 15970 | 2 |
| Mode SS | |||
|---|---|---|---|
| Quadrant | BADHDUFLAG | Total packets | Discarded packets |
| A | 0 | 140 | 0 |
| B | 0 | 140 | 0 |
| C | 0 | 140 | 0 |
| D | 0 | 140 | 0 |
| Quadrant | Total seconds | Saturated seconds | Saturation percentage |
|---|---|---|---|
| A | 6802 | 87 | 1.279036% |
| B | 6803 | 139 | 2.043216% |
| C | 6803 | 158 | 2.322505% |
| D | 6803 | 101 | 1.484639% |
Noise dominated data is calculated using 1-second bins in cleaned event files. If a bin has >2000 counts, and if more than 50% of those come from <1% of pixels, then it is considered to be noise-dominated and hence unusable.
| Quadrant | # 1 sec bins | Bins with >0 counts | Bins with >2000 counts | High rate bins dominated by noise | Noise dominated (total time) | Noise dominated (detector-on time) | Marked lightcurve |
|---|---|---|---|---|---|---|---|
| A | 8922 | 6802 | 0 | 0 | 0.00% | 0.00% | 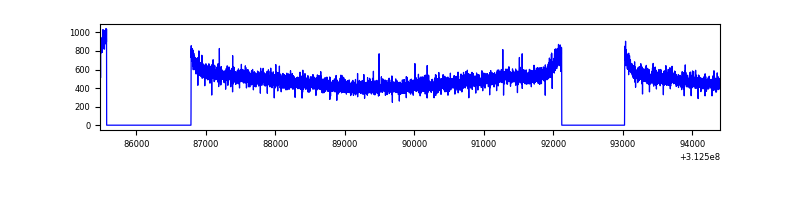 |
| B | 8923 | 6803 | 9 | 9 | 0.10% | 0.13% | 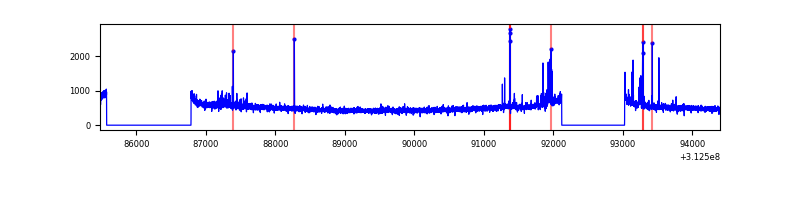 |
| C | 8923 | 6804 | 0 | 0 | 0.00% | 0.00% | 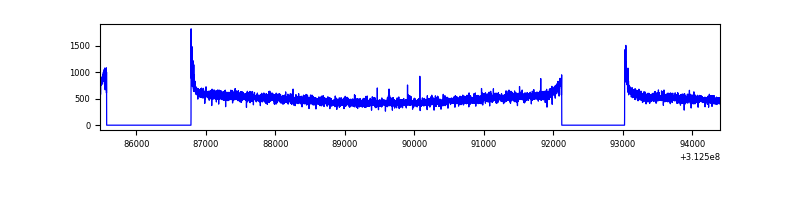 |
| D | 8923 | 6803 | 33 | 33 | 0.37% | 0.49% | 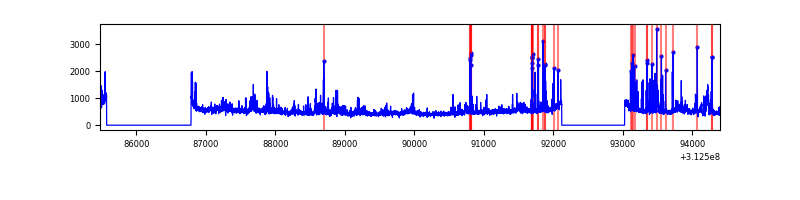 |
Top three noisy pixels from each quadrant. If the there are fewer than three noisy pixels in the level2.evt file, extra rows are filled as -1
| Pixel properties | Quadrant properties | ||||||
|---|---|---|---|---|---|---|---|
| Quadrant | DetID | PixID | Counts | Sigma | Mean | Median | Sigma |
| A | 13 | 254 | 11354 | 59.55 | 869 | 850 | 176.4 |
| A | 0 | 226 | 7712 | 38.9 | 869 | 850 | 176.4 |
| A | 3 | 137 | 7490 | 37.64 | 869 | 850 | 176.4 |
| B | 15 | 33 | 138043 | 821.5 | 869 | 847 | 167.0 |
| B | 12 | 111 | 19855 | 113.82 | 869 | 847 | 167.0 |
| B | 11 | 111 | 17694 | 100.88 | 869 | 847 | 167.0 |
| C | 14 | 238 | 133191 | 667.11 | 842 | 848 | 198.4 |
| C | 0 | 10 | 29018 | 142.0 | 842 | 848 | 198.4 |
| C | 10 | 22 | 6424 | 28.1 | 842 | 848 | 198.4 |
| D | 1 | 52 | 390281 | 1896.58 | 847 | 825 | 205.3 |
| D | 15 | 145 | 76446 | 368.26 | 847 | 825 | 205.3 |
| D | 13 | 172 | 73526 | 354.04 | 847 | 825 | 205.3 |
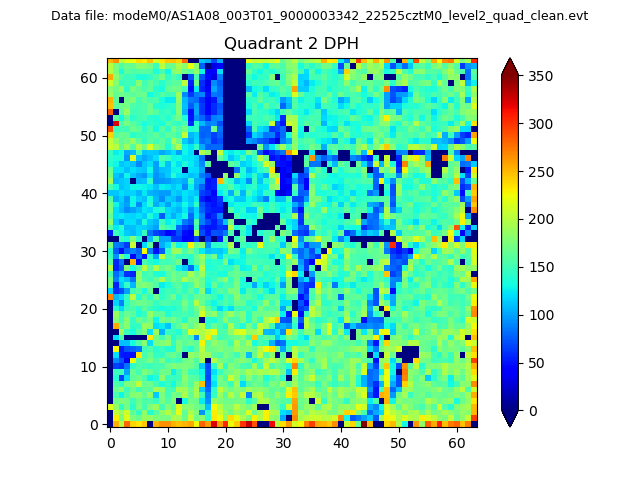
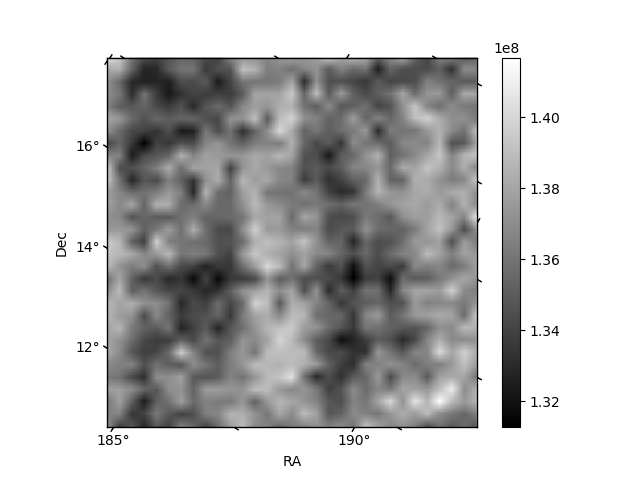
Histogram calculated using DETX and DETY for each event in the final _common_clean file
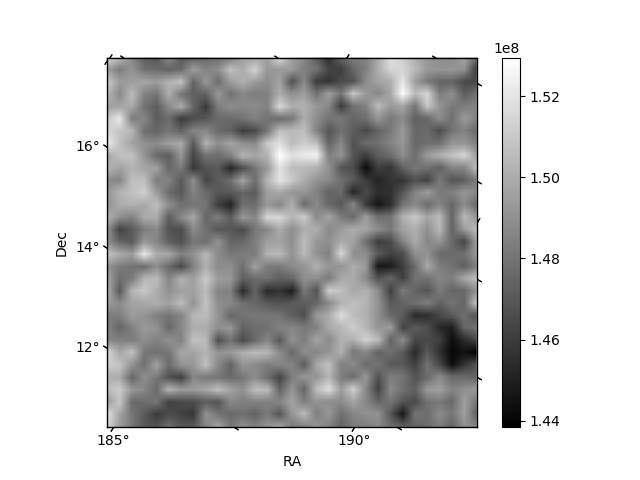
| Quadrant A | 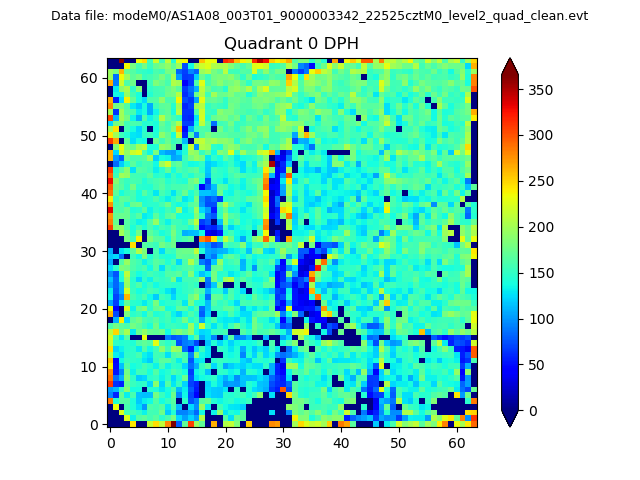 |
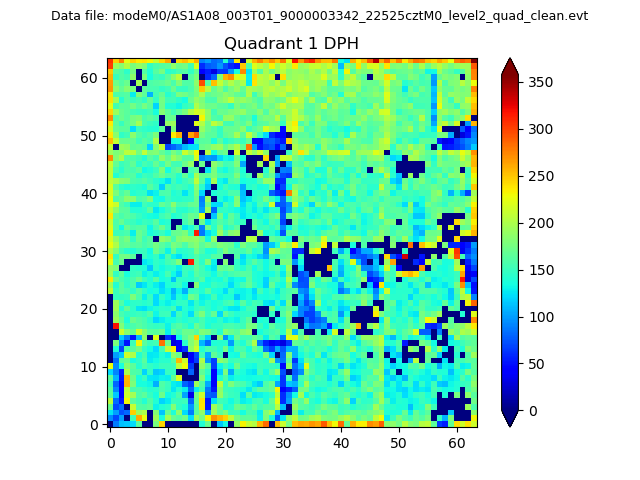 |
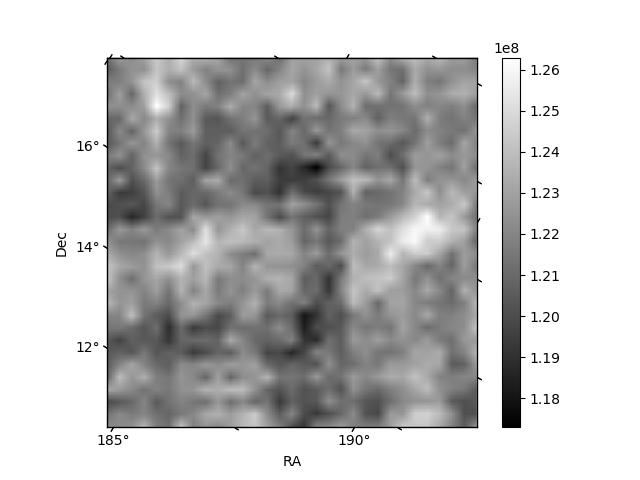
Quadrant B |
|---|---|---|---|
| Quadrant D | 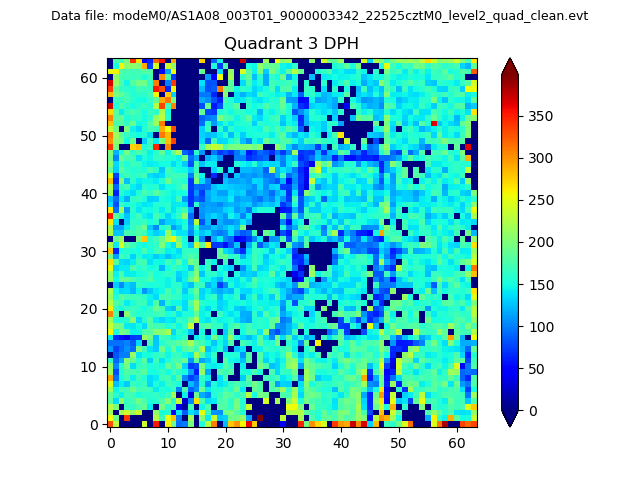 |
 |
Quadrant C |
| Plot type | Count rate plots | Images |
|---|---|---|
| Comparison with Poisson distribution Blue bars denote a histogram of data divided into 1 sec bins. Red curve is a Poisson curve with rate = median count rate of data. |
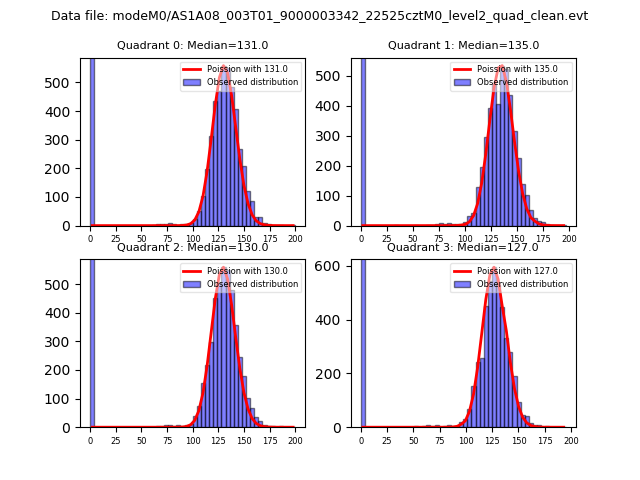 |
 |
| Quadrant-wise count rates Data is divided into 100 sec bins |
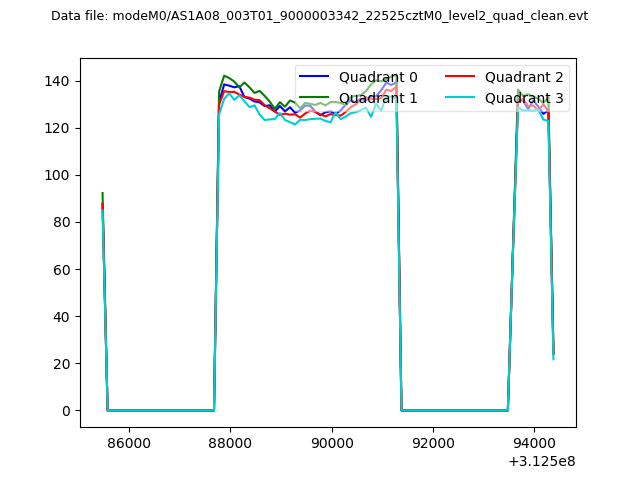 |
|
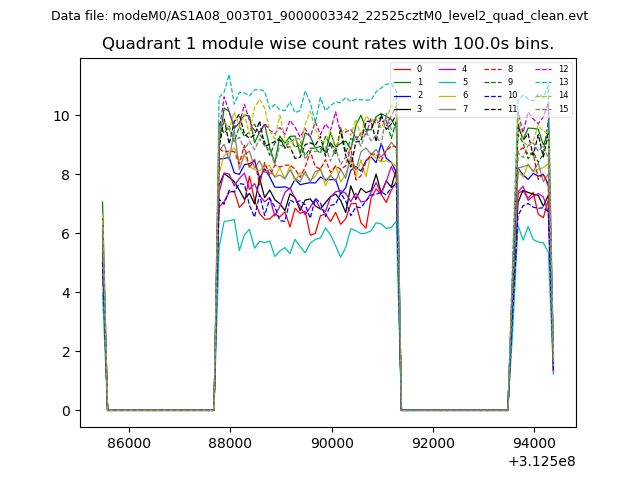
| Module-wise count rates for Quadrant A Data is divided into 100 sec bins |
 |
 |
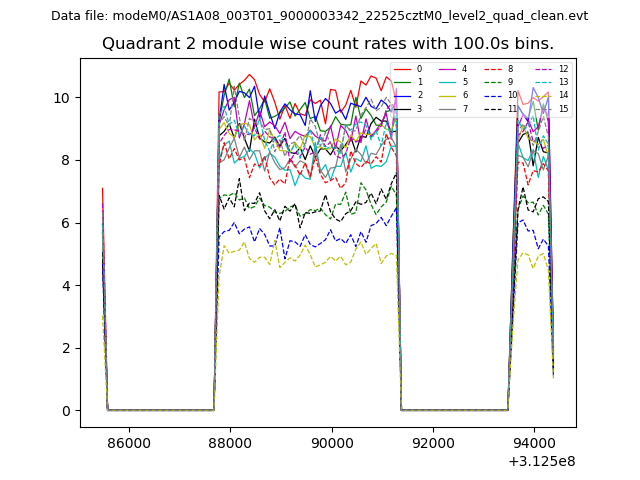
| Module-wise count rates for Quadrant B Data is divided into 100 sec bins |
 |
 |
| Module-wise count rates for Quadrant C Data is divided into 100 sec bins |
 |
 |
| Module-wise count rates for Quadrant D Data is divided into 100 sec bins |
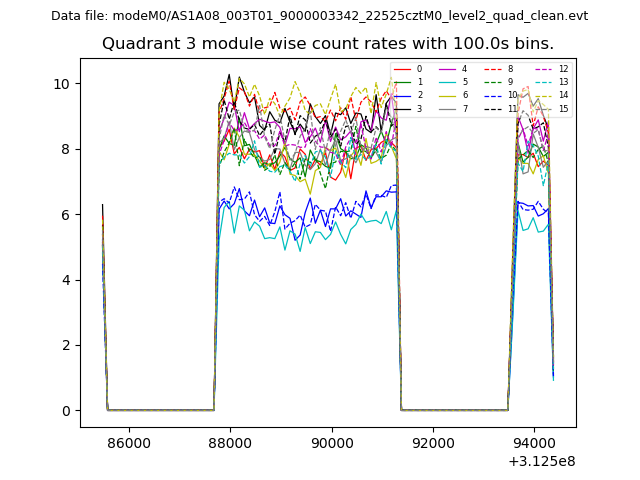 |
 |
| Parameter | Plot |
|---|---|
| CZT HV Monitor | 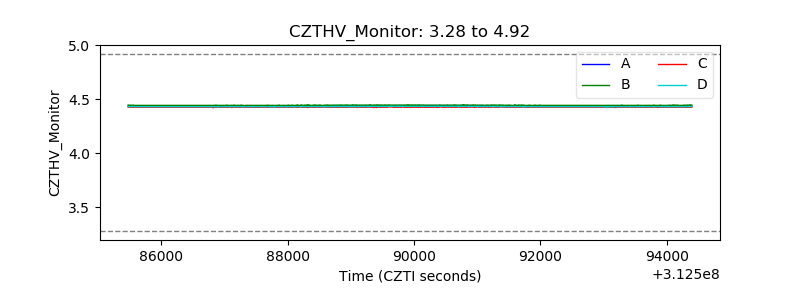 |
| D_VDD | 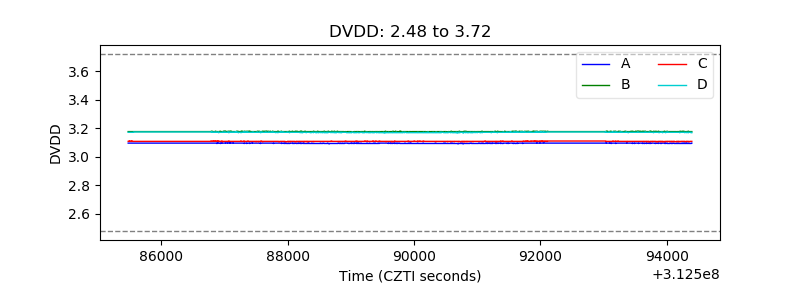 |
| Temperature 1 | 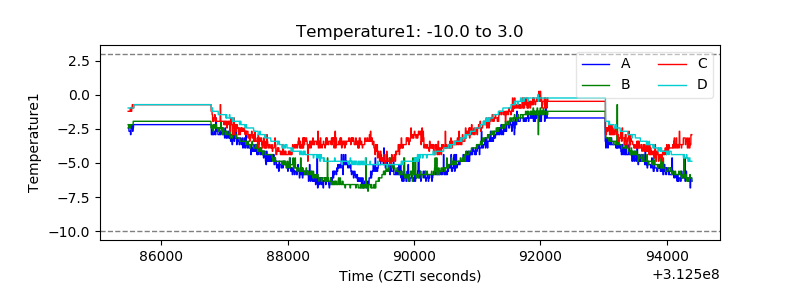 |
| Veto HV Monitor | 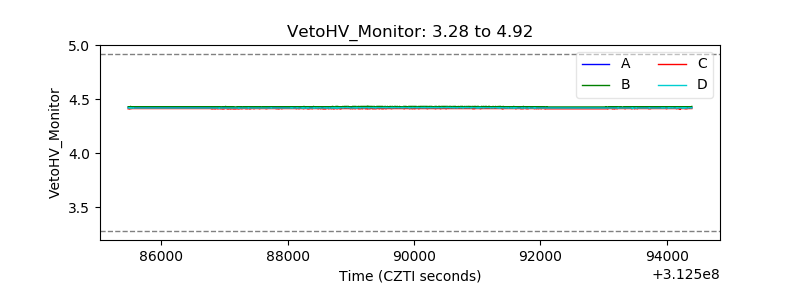 |
| Veto LLD |  |
| Alpha Counter | 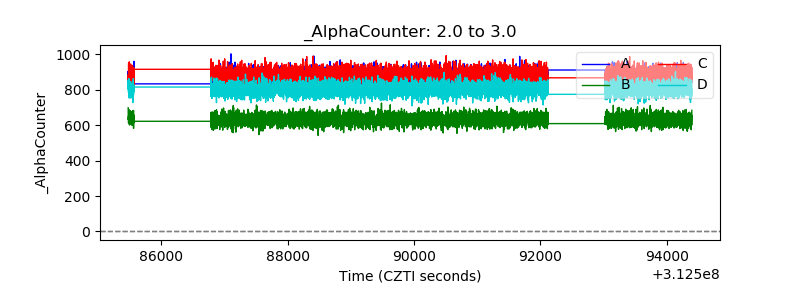 |
| _CPM_Rate | 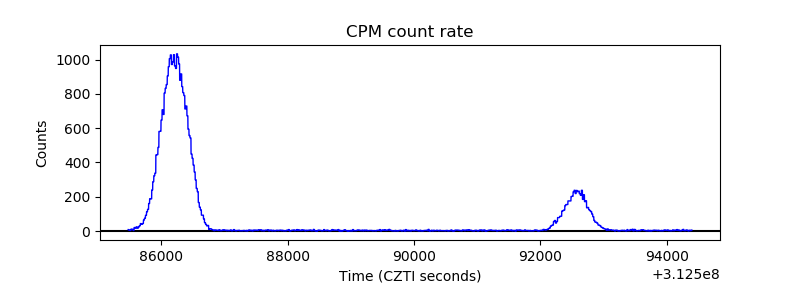 |
| CZT Counter | 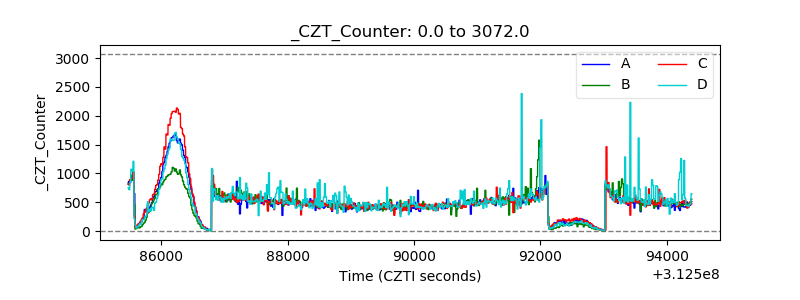 |
| +2.5 Volts monitor |  |
| +5 Volts monitor | 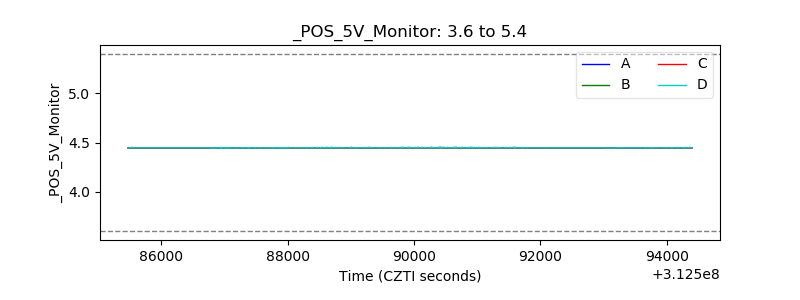 |
| _ROLL_ROT | 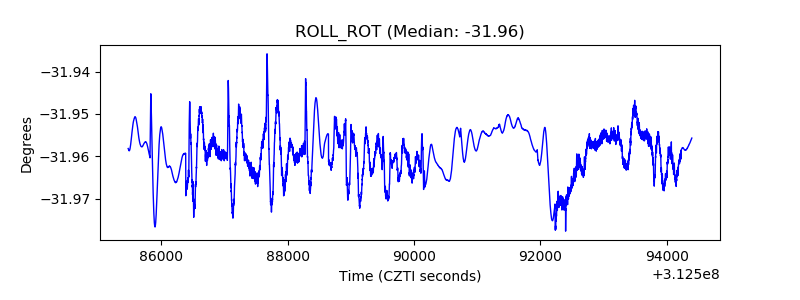 |
| _Roll_DEC | 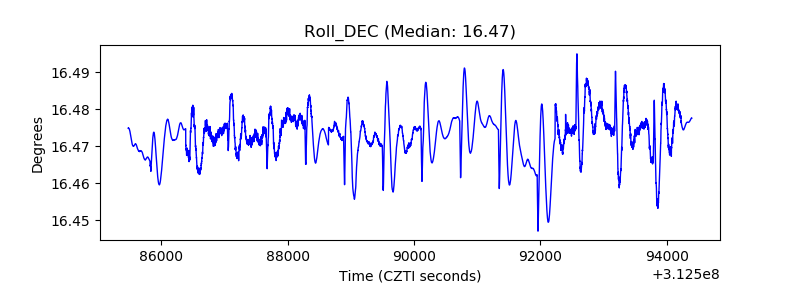 |
| _Roll_RA | 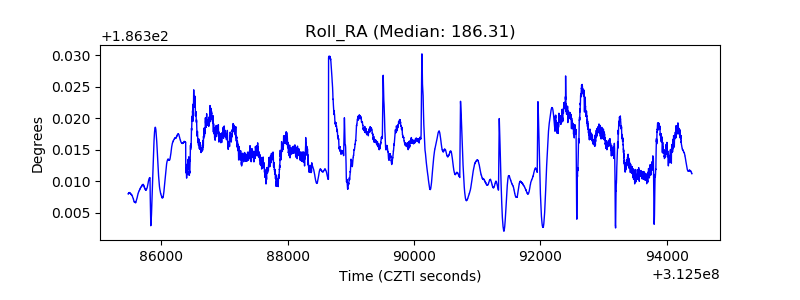 |
| Veto Counter |  |