| Param | Original file | Final file |
|---|---|---|
| Filename | modeM0/AS1A08_003T01_9000003342_22526cztM0_level2.evt | modeM0/AS1A08_003T01_9000003342_22526cztM0_level2_quad_clean.evt |
| Size (bytes) | 503,449,920 | 95,725,440 |
| Size | 480.1 MB | 91.3 MB |
| Events in quadrant A | 3,413,303 | 604,140 |
| Events in quadrant B | 3,803,784 | 615,689 |
| Events in quadrant C | 3,500,970 | 598,169 |
| Events in quadrant D | 4,043,848 | 583,626 |
| Mode M9 | |||
|---|---|---|---|
| Quadrant | BADHDUFLAG | Total packets | Discarded packets |
| A | 0 | 14 | 0 |
| B | 0 | 14 | 0 |
| C | 0 | 14 | 0 |
| D | 0 | 14 | 0 |
| Mode M0 | |||
|---|---|---|---|
| Quadrant | BADHDUFLAG | Total packets | Discarded packets |
| A | 0 | 14822 | 2 |
| B | 0 | 16025 | 2 |
| C | 0 | 14950 | 2 |
| D | 0 | 16903 | 2 |
| Mode SS | |||
|---|---|---|---|
| Quadrant | BADHDUFLAG | Total packets | Discarded packets |
| A | 0 | 146 | 0 |
| B | 0 | 146 | 0 |
| C | 0 | 146 | 0 |
| D | 0 | 146 | 0 |
| Quadrant | Total seconds | Saturated seconds | Saturation percentage |
|---|---|---|---|
| A | 7144 | 47 | 0.657895% |
| B | 7144 | 199 | 2.785554% |
| C | 7145 | 134 | 1.875437% |
| D | 7145 | 121 | 1.693492% |
Noise dominated data is calculated using 1-second bins in cleaned event files. If a bin has >2000 counts, and if more than 50% of those come from <1% of pixels, then it is considered to be noise-dominated and hence unusable.
| Quadrant | # 1 sec bins | Bins with >0 counts | Bins with >2000 counts | High rate bins dominated by noise | Noise dominated (total time) | Noise dominated (detector-on time) | Marked lightcurve |
|---|---|---|---|---|---|---|---|
| A | 8574 | 7145 | 0 | 0 | 0.00% | 0.00% | 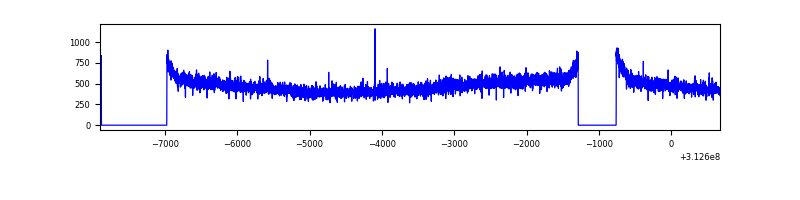 |
| B | 8574 | 7144 | 19 | 19 | 0.22% | 0.27% | 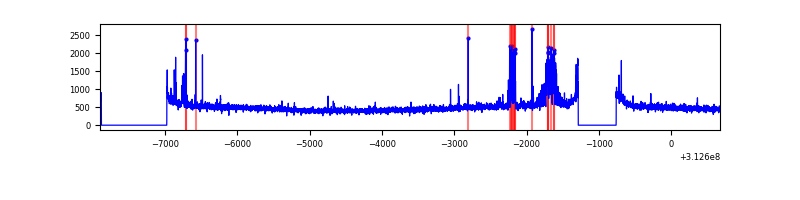 |
| C | 8575 | 7146 | 0 | 0 | 0.00% | 0.00% | 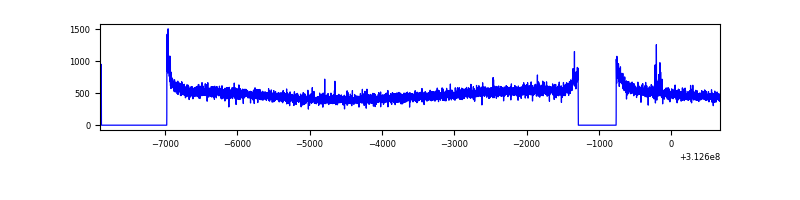 |
| D | 8575 | 7146 | 101 | 101 | 1.18% | 1.41% | 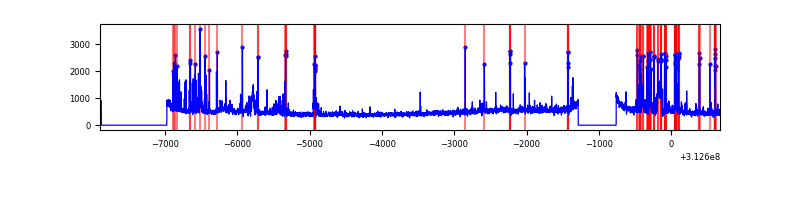 |
Top three noisy pixels from each quadrant. If the there are fewer than three noisy pixels in the level2.evt file, extra rows are filled as -1
| Pixel properties | Quadrant properties | ||||||
|---|---|---|---|---|---|---|---|
| Quadrant | DetID | PixID | Counts | Sigma | Mean | Median | Sigma |
| A | 13 | 254 | 11926 | 61.43 | 885 | 865 | 180.1 |
| A | 3 | 137 | 7862 | 38.86 | 885 | 865 | 180.1 |
| A | 0 | 226 | 7781 | 38.41 | 885 | 865 | 180.1 |
| B | 15 | 33 | 318497 | 1855.04 | 882 | 860 | 171.2 |
| B | 12 | 111 | 20508 | 114.75 | 882 | 860 | 171.2 |
| B | 11 | 111 | 18052 | 100.4 | 882 | 860 | 171.2 |
| C | 14 | 238 | 135394 | 670.11 | 856 | 862 | 200.8 |
| C | 0 | 10 | 17977 | 85.25 | 856 | 862 | 200.8 |
| C | 10 | 22 | 9858 | 44.81 | 856 | 862 | 200.8 |
| D | 1 | 52 | 541974 | 2578.19 | 859 | 835 | 209.9 |
| D | 15 | 145 | 100722 | 475.9 | 859 | 835 | 209.9 |
| D | 13 | 172 | 82635 | 389.73 | 859 | 835 | 209.9 |
Histogram calculated using DETX and DETY for each event in the final _common_clean file
| Quadrant A | 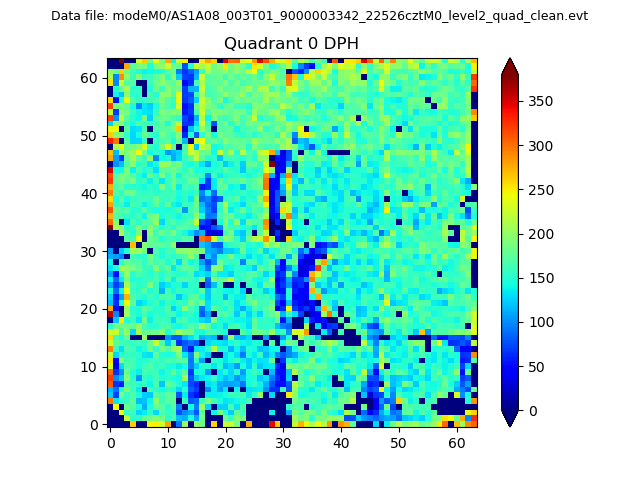 |
 |
Quadrant B |
|---|---|---|---|
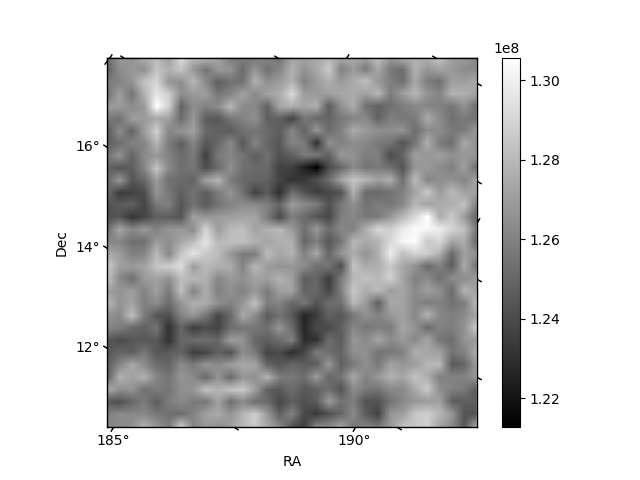
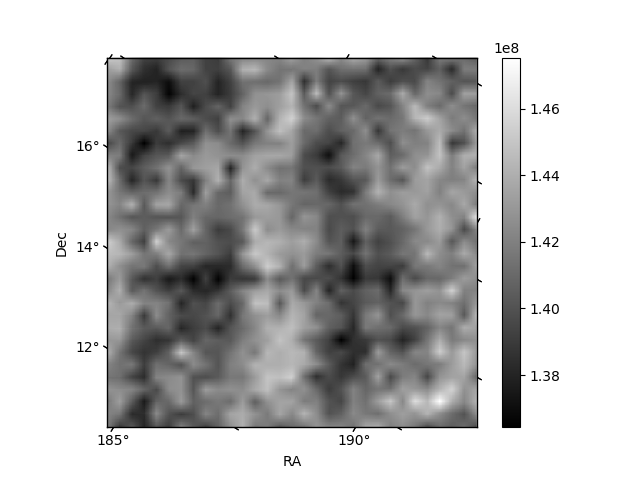
| Quadrant D | 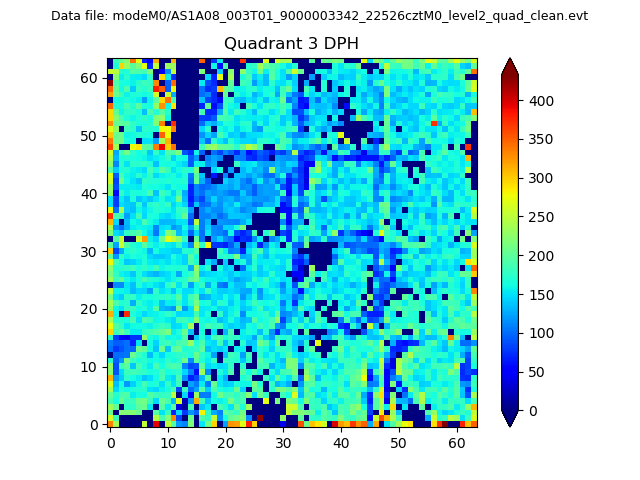 |
 |
Quadrant C |
| Plot type | Count rate plots | Images |
|---|---|---|
| Comparison with Poisson distribution Blue bars denote a histogram of data divided into 1 sec bins. Red curve is a Poisson curve with rate = median count rate of data. |
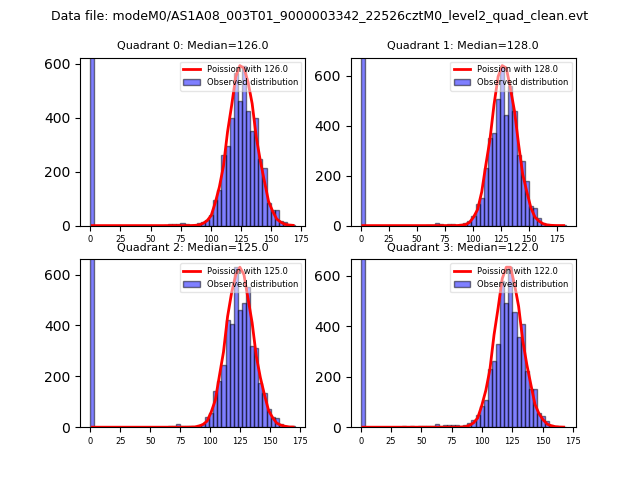 |
 |
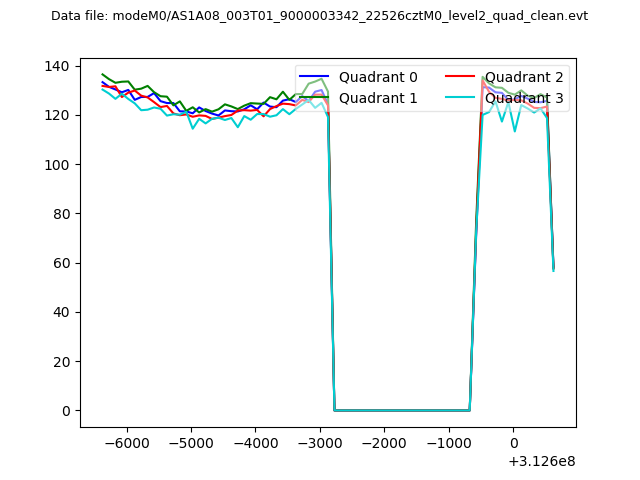
| Quadrant-wise count rates Data is divided into 100 sec bins |
 |
|
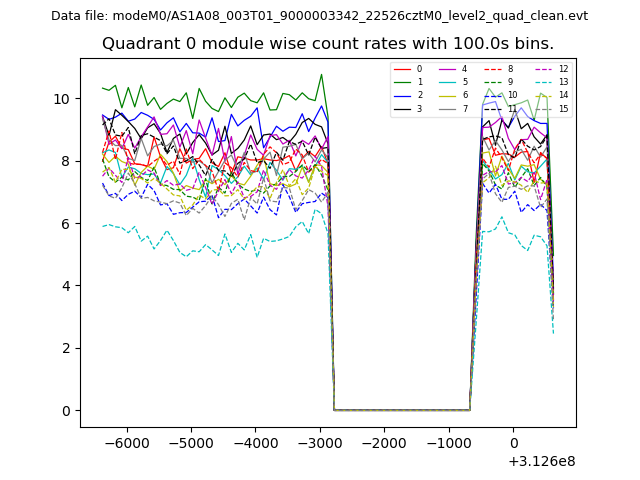
| Module-wise count rates for Quadrant A Data is divided into 100 sec bins |
 |
 |
| Module-wise count rates for Quadrant B Data is divided into 100 sec bins |
 |
 |
| Module-wise count rates for Quadrant C Data is divided into 100 sec bins |
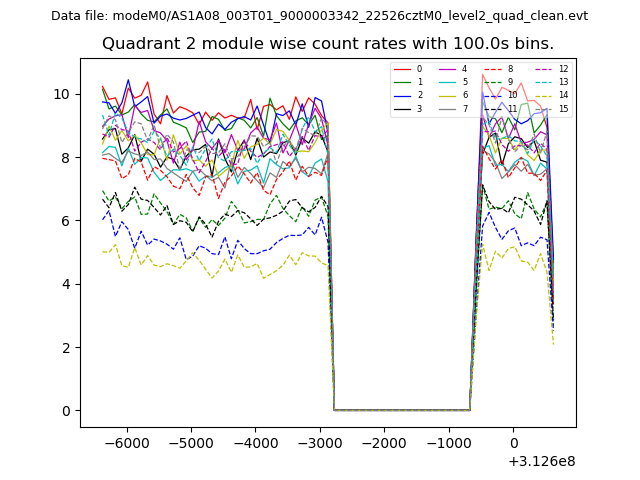 |
 |
| Module-wise count rates for Quadrant D Data is divided into 100 sec bins |
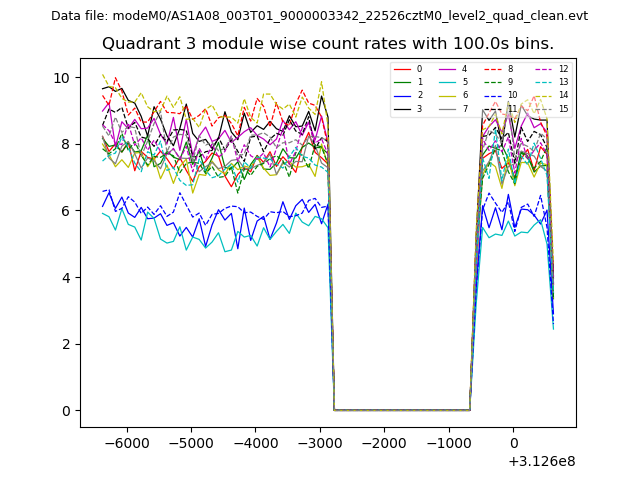 |
 |
| Parameter | Plot |
|---|---|
| CZT HV Monitor |  |
| D_VDD | 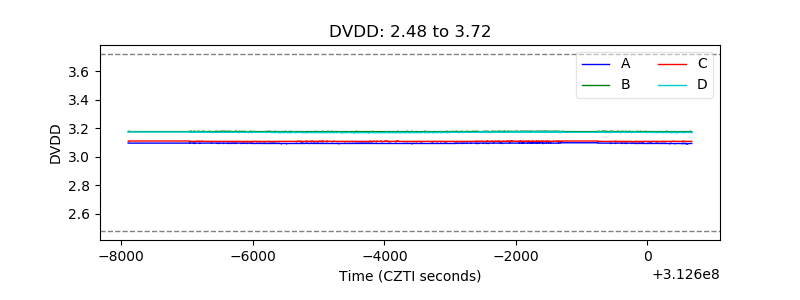 |
| Temperature 1 | 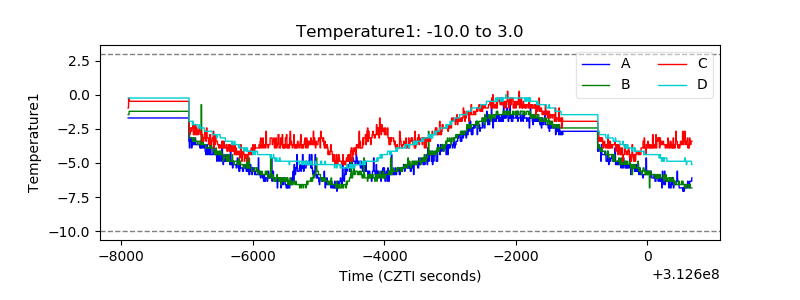 |
| Veto HV Monitor | 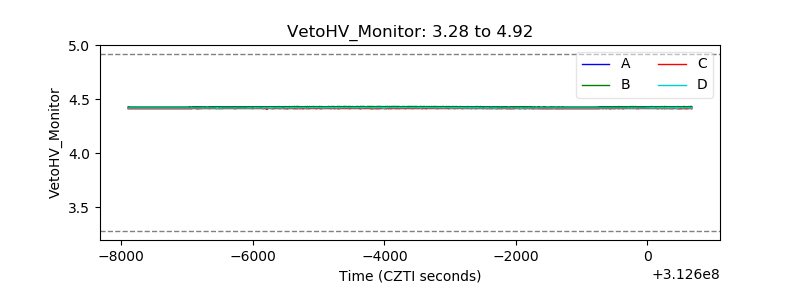 |
| Veto LLD | 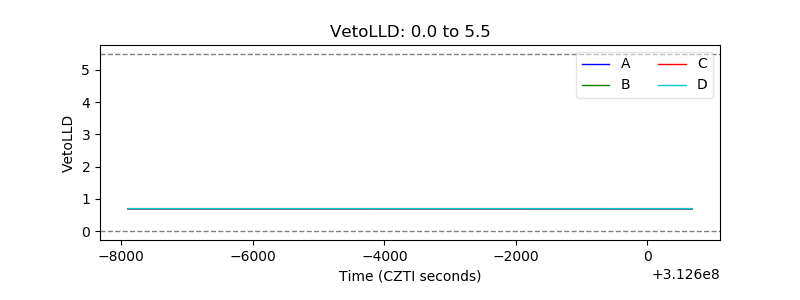 |
| Alpha Counter |  |
| _CPM_Rate | 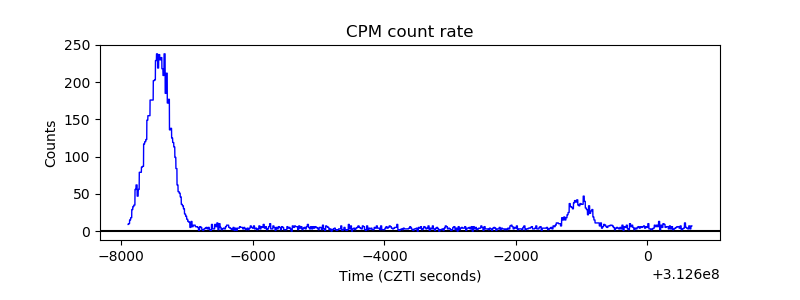 |
| CZT Counter |  |
| +2.5 Volts monitor |  |
| +5 Volts monitor |  |
| _ROLL_ROT | 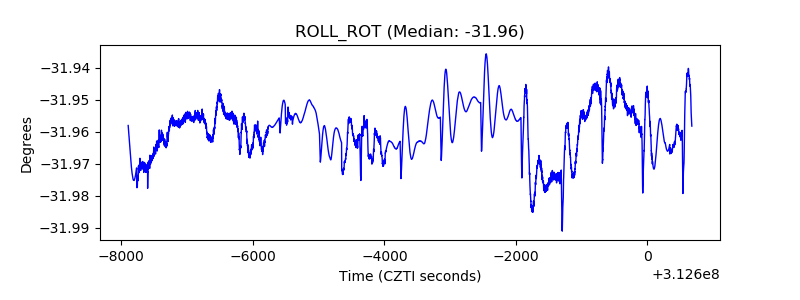 |
| _Roll_DEC | 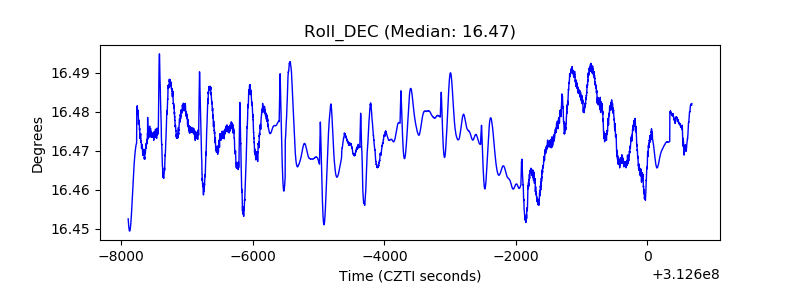 |
| _Roll_RA | 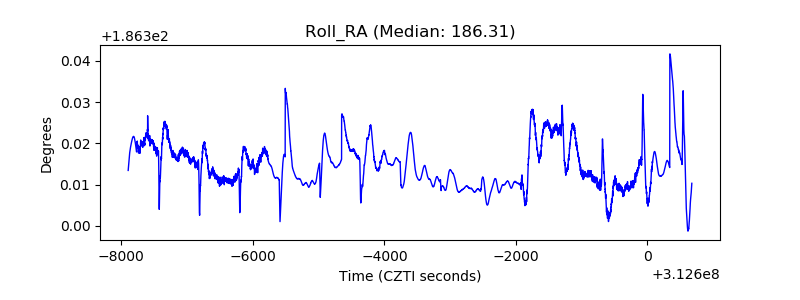 |
| Veto Counter | 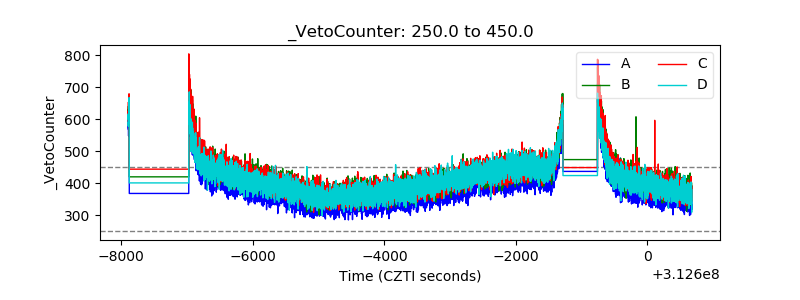 |