| Param | Original file | Final file |
|---|---|---|
| Filename | modeM0/AS1A08_003T01_9000003342_22528cztM0_level2.evt | modeM0/AS1A08_003T01_9000003342_22528cztM0_level2_quad_clean.evt |
| Size (bytes) | 547,842,240 | 89,648,640 |
| Size | 522.5 MB | 85.5 MB |
| Events in quadrant A | 3,172,314 | 566,197 |
| Events in quadrant B | 3,336,452 | 577,283 |
| Events in quadrant C | 3,231,467 | 559,675 |
| Events in quadrant D | 6,382,778 | 530,804 |
| Mode M9 | |||
|---|---|---|---|
| Quadrant | BADHDUFLAG | Total packets | Discarded packets |
| A | 0 | 4 | 0 |
| B | 0 | 4 | 0 |
| C | 0 | 4 | 0 |
| D | 0 | 4 | 0 |
| Mode M0 | |||
|---|---|---|---|
| Quadrant | BADHDUFLAG | Total packets | Discarded packets |
| A | 0 | 14168 | 1 |
| B | 0 | 14561 | 1 |
| C | 0 | 14250 | 2 |
| D | 0 | 23954 | 1 |
| Mode SS | |||
|---|---|---|---|
| Quadrant | BADHDUFLAG | Total packets | Discarded packets |
| A | 0 | 138 | 0 |
| B | 0 | 138 | 0 |
| C | 0 | 140 | 0 |
| D | 0 | 140 | 0 |
| Quadrant | Total seconds | Saturated seconds | Saturation percentage |
|---|---|---|---|
| A | 6906 | 45 | 0.651607% |
| B | 6906 | 82 | 1.187373% |
| C | 6906 | 92 | 1.332175% |
| D | 6906 | 1055 | 15.276571% |
Noise dominated data is calculated using 1-second bins in cleaned event files. If a bin has >2000 counts, and if more than 50% of those come from <1% of pixels, then it is considered to be noise-dominated and hence unusable.
| Quadrant | # 1 sec bins | Bins with >0 counts | Bins with >2000 counts | High rate bins dominated by noise | Noise dominated (total time) | Noise dominated (detector-on time) | Marked lightcurve |
|---|---|---|---|---|---|---|---|
| A | 7271 | 6907 | 0 | 0 | 0.00% | 0.00% | 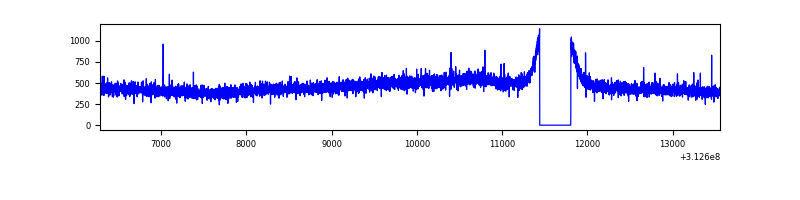 |
| B | 7271 | 6906 | 8 | 8 | 0.11% | 0.12% | 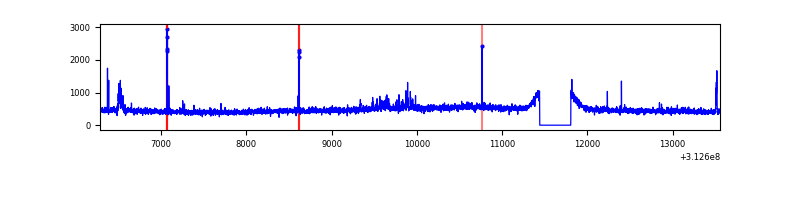 |
| C | 7271 | 6906 | 0 | 0 | 0.00% | 0.00% | 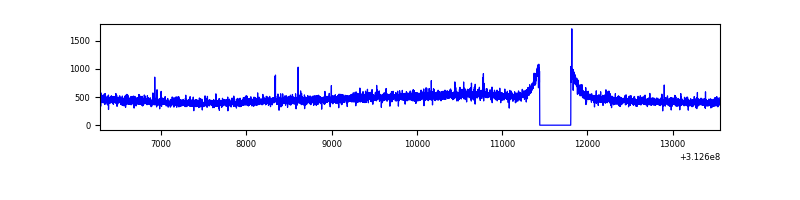 |
| D | 7271 | 6906 | 872 | 872 | 11.99% | 12.63% | 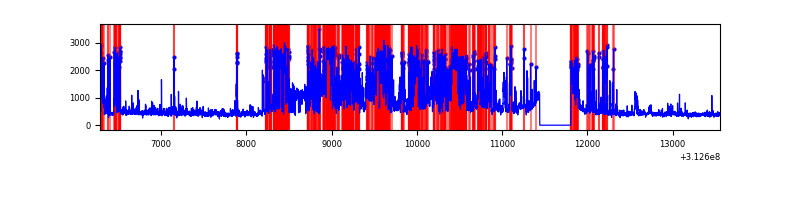 |
Top three noisy pixels from each quadrant. If the there are fewer than three noisy pixels in the level2.evt file, extra rows are filled as -1
| Pixel properties | Quadrant properties | ||||||
|---|---|---|---|---|---|---|---|
| Quadrant | DetID | PixID | Counts | Sigma | Mean | Median | Sigma |
| A | 13 | 254 | 11186 | 61.59 | 822 | 804 | 168.6 |
| A | 0 | 226 | 7146 | 37.63 | 822 | 804 | 168.6 |
| A | 3 | 137 | 7117 | 37.45 | 822 | 804 | 168.6 |
| B | 15 | 33 | 40295 | 246.33 | 822 | 801 | 160.3 |
| B | 0 | 197 | 30386 | 184.53 | 822 | 801 | 160.3 |
| B | 5 | 172 | 24012 | 144.77 | 822 | 801 | 160.3 |
| C | 14 | 238 | 123268 | 651.69 | 791 | 797 | 187.9 |
| C | 8 | 128 | 8838 | 42.79 | 791 | 797 | 187.9 |
| C | 13 | 61 | 5499 | 25.02 | 791 | 797 | 187.9 |
| D | 1 | 52 | 3455002 | 19012.77 | 736 | 714 | 181.7 |
| D | 13 | 249 | 81041 | 442.13 | 736 | 714 | 181.7 |
| D | 5 | 32 | 40263 | 217.68 | 736 | 714 | 181.7 |
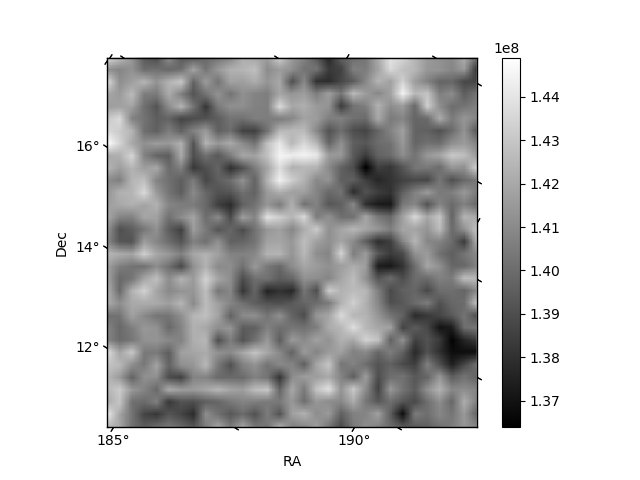
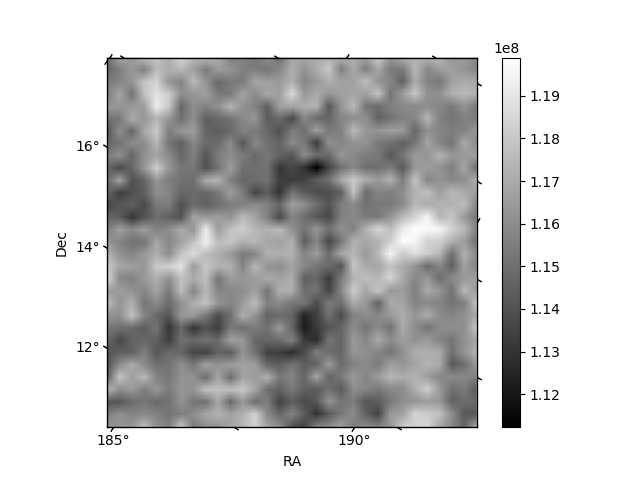
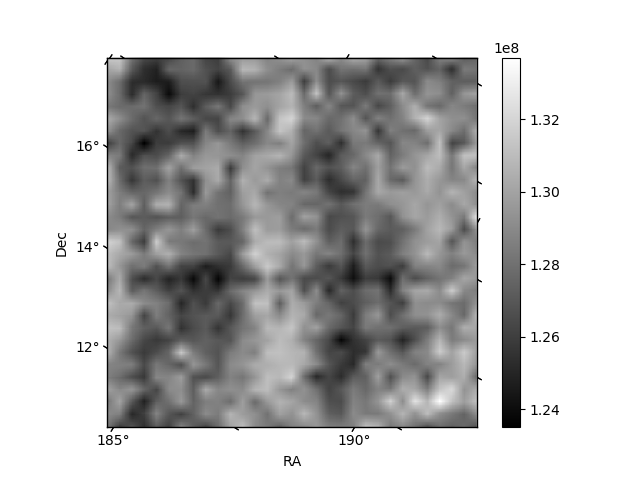
Histogram calculated using DETX and DETY for each event in the final _common_clean file
| Quadrant A | 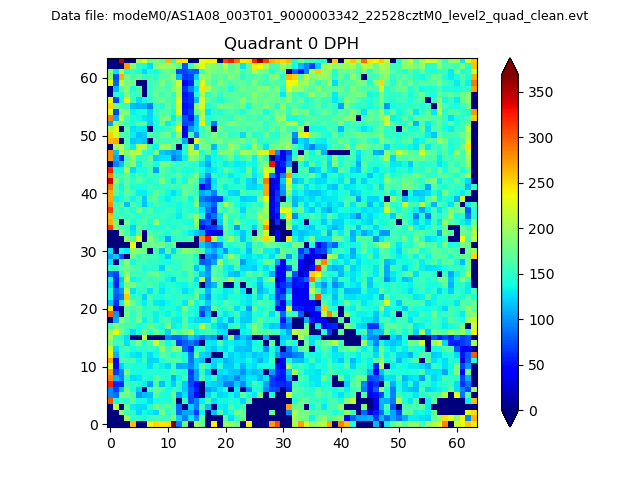 |
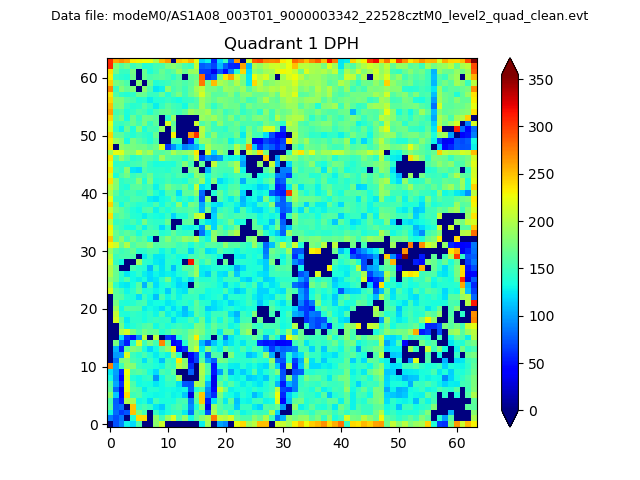 |
Quadrant B |
|---|---|---|---|
| Quadrant D | 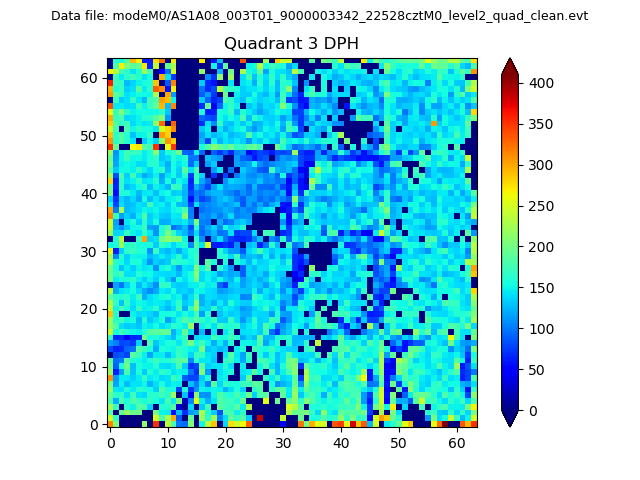 |
 |
Quadrant C |
| Plot type | Count rate plots | Images |
|---|---|---|
| Comparison with Poisson distribution Blue bars denote a histogram of data divided into 1 sec bins. Red curve is a Poisson curve with rate = median count rate of data. |
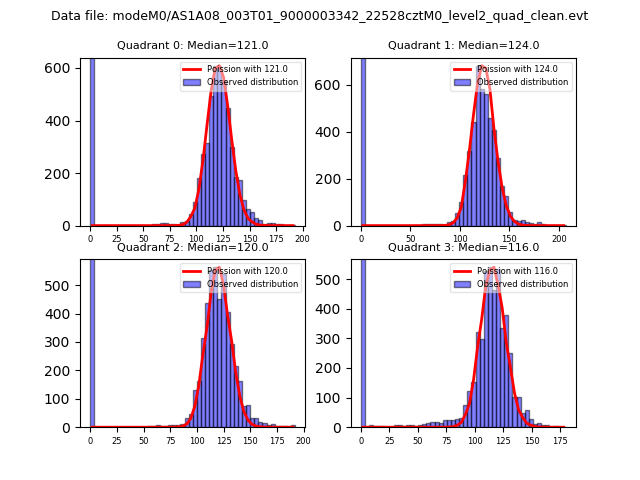 |
 |
| Quadrant-wise count rates Data is divided into 100 sec bins |
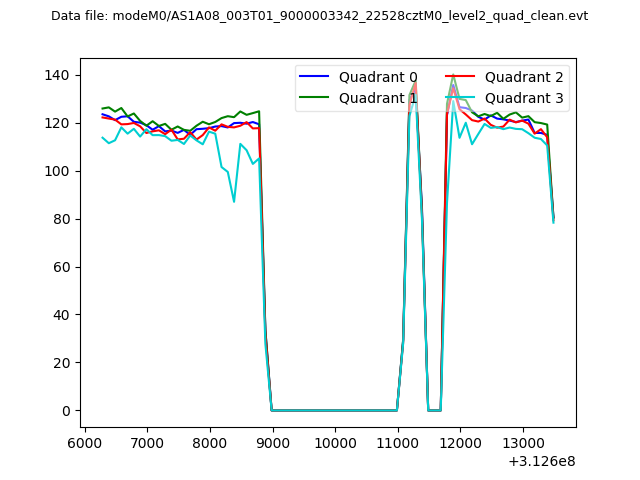 |
|
| Module-wise count rates for Quadrant A Data is divided into 100 sec bins |
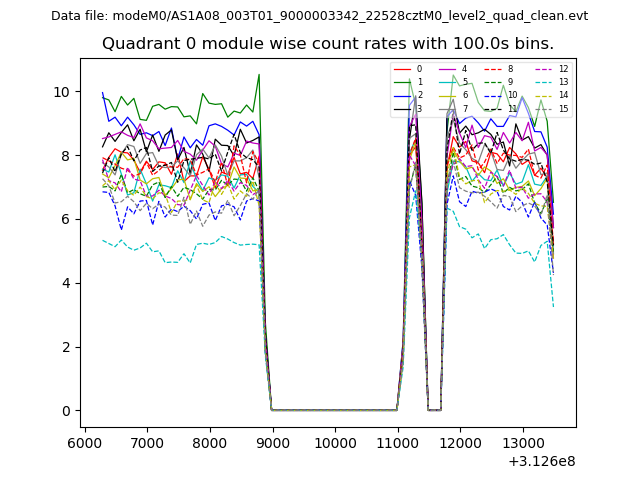 |
 |
| Module-wise count rates for Quadrant B Data is divided into 100 sec bins |
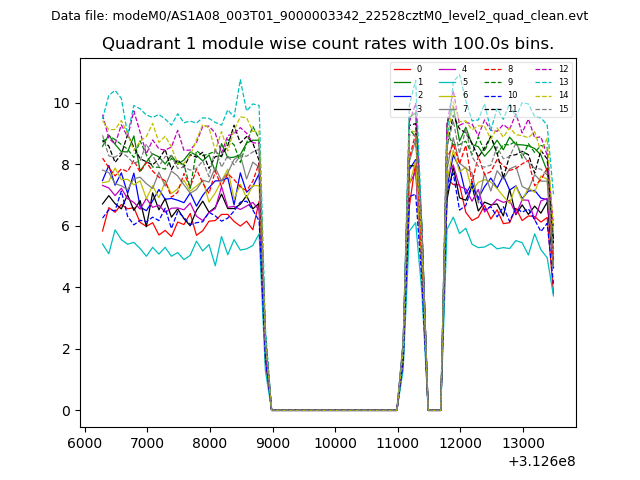 |
 |
| Module-wise count rates for Quadrant C Data is divided into 100 sec bins |
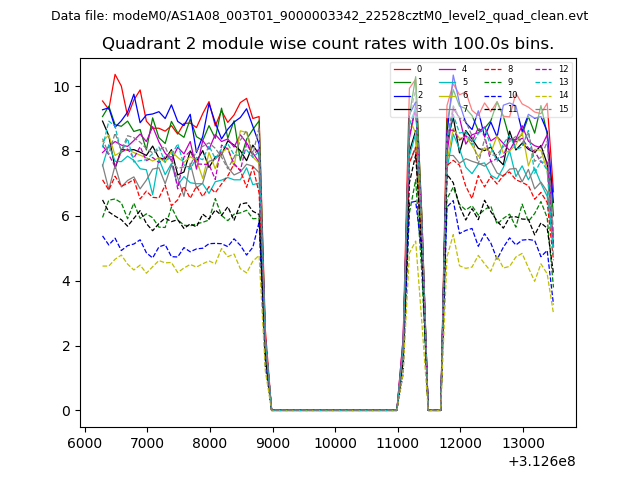 |
 |
| Module-wise count rates for Quadrant D Data is divided into 100 sec bins |
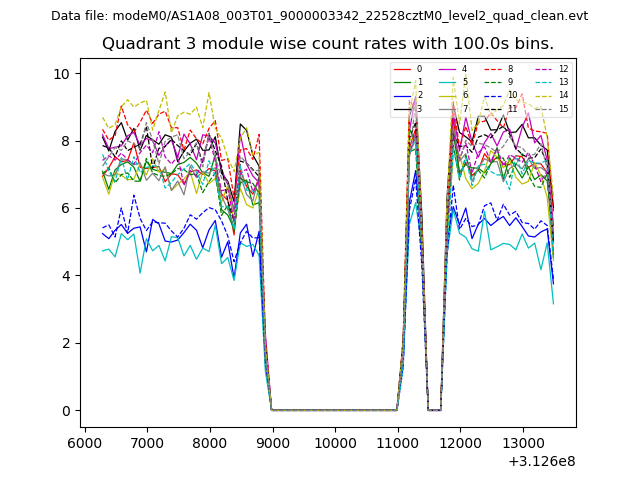 |
 |
| Parameter | Plot |
|---|---|
| CZT HV Monitor |  |
| D_VDD | 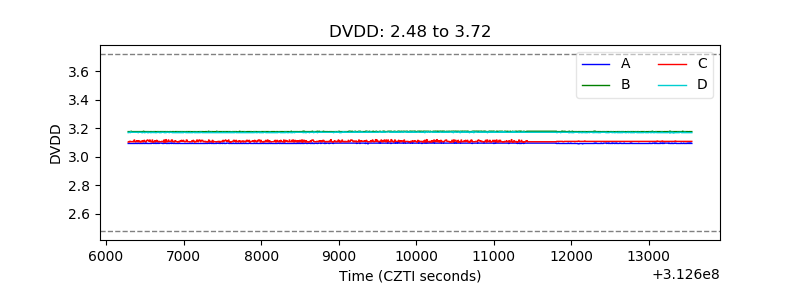 |
| Temperature 1 | 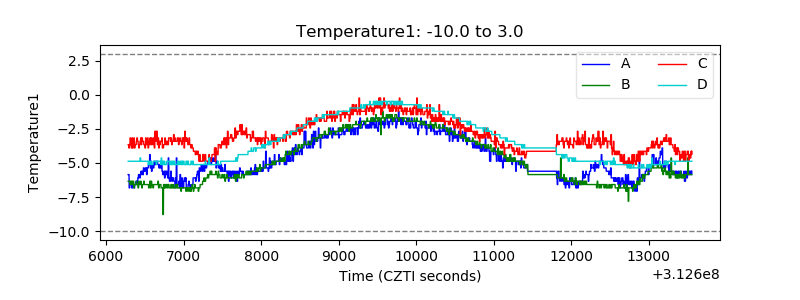 |
| Veto HV Monitor | 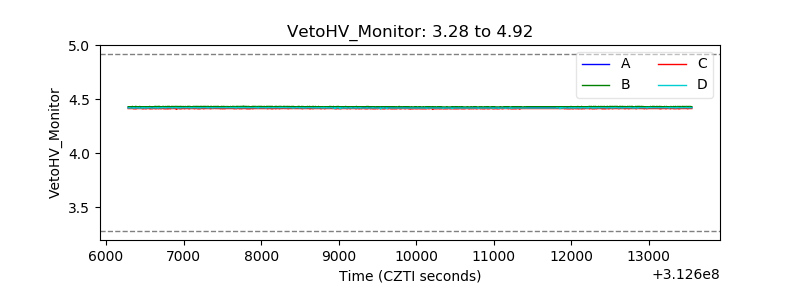 |
| Veto LLD |  |
| Alpha Counter | 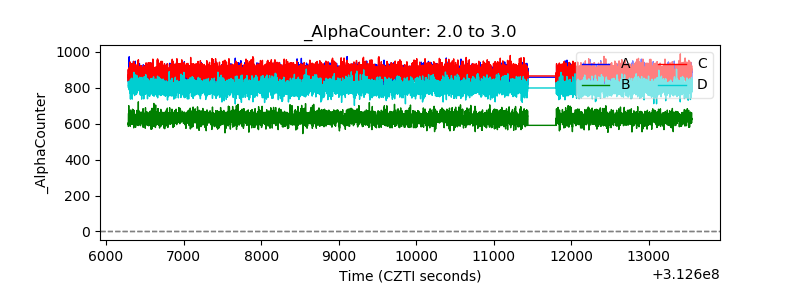 |
| _CPM_Rate | 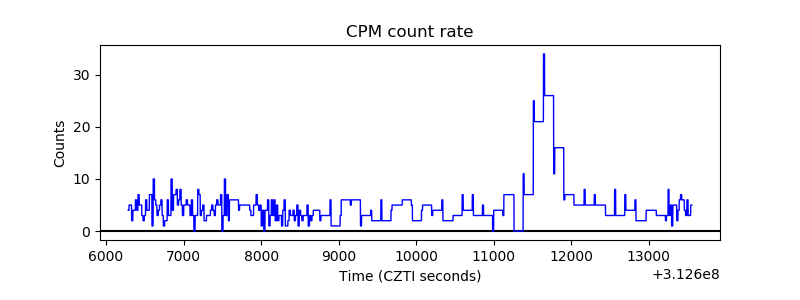 |
| CZT Counter |  |
| +2.5 Volts monitor |  |
| +5 Volts monitor |  |
| _ROLL_ROT | 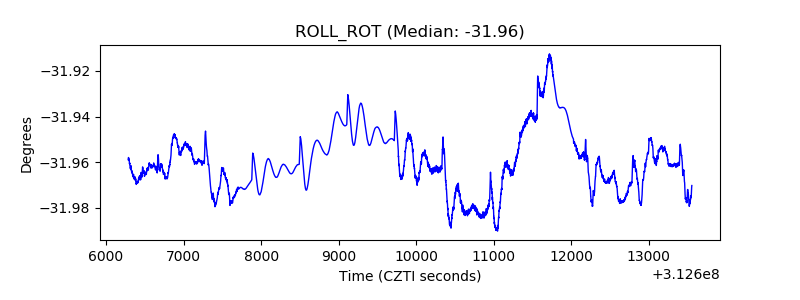 |
| _Roll_DEC | 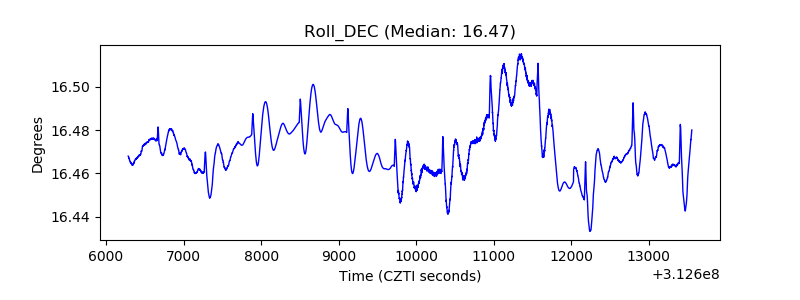 |
| _Roll_RA | 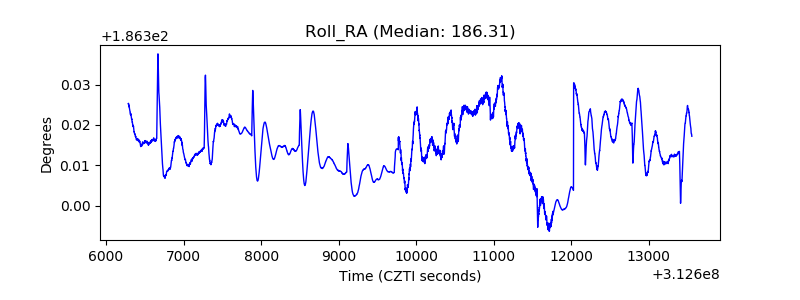 |
| Veto Counter | 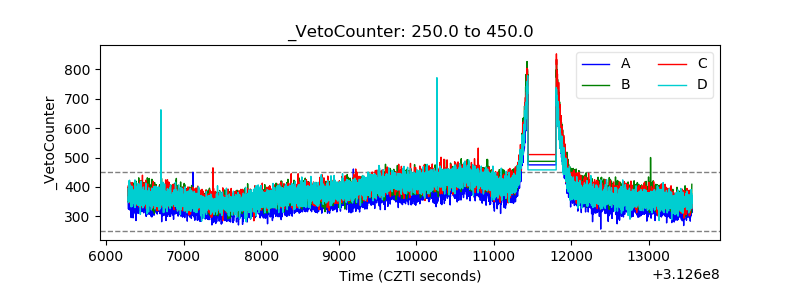 |