| Param | Original file | Final file |
|---|---|---|
| Filename | modeM0/AS1A08_003T01_9000003342_22531cztM0_level2.evt | modeM0/AS1A08_003T01_9000003342_22531cztM0_level2_quad_clean.evt |
| Size (bytes) | 717,854,400 | 123,315,840 |
| Size | 684.6 MB | 117.6 MB |
| Events in quadrant A | 4,893,846 | 753,432 |
| Events in quadrant B | 5,646,260 | 771,317 |
| Events in quadrant C | 5,037,452 | 742,916 |
| Events in quadrant D | 5,437,352 | 725,789 |
| Mode M9 | |||
|---|---|---|---|
| Quadrant | BADHDUFLAG | Total packets | Discarded packets |
| A | 0 | 5 | 0 |
| B | 0 | 5 | 0 |
| C | 0 | 5 | 0 |
| D | 0 | 5 | 0 |
| Mode M0 | |||
|---|---|---|---|
| Quadrant | BADHDUFLAG | Total packets | Discarded packets |
| A | 0 | 21687 | 1 |
| B | 0 | 23994 | 1 |
| C | 0 | 21968 | 1 |
| D | 0 | 23548 | 1 |
| Mode SS | |||
|---|---|---|---|
| Quadrant | BADHDUFLAG | Total packets | Discarded packets |
| A | 0 | 216 | 0 |
| B | 0 | 216 | 0 |
| C | 0 | 216 | 0 |
| D | 0 | 216 | 0 |
| Quadrant | Total seconds | Saturated seconds | Saturation percentage |
|---|---|---|---|
| A | 10700 | 28 | 0.261682% |
| B | 10701 | 158 | 1.476498% |
| C | 10701 | 103 | 0.962527% |
| D | 10701 | 124 | 1.158770% |
Noise dominated data is calculated using 1-second bins in cleaned event files. If a bin has >2000 counts, and if more than 50% of those come from <1% of pixels, then it is considered to be noise-dominated and hence unusable.
| Quadrant | # 1 sec bins | Bins with >0 counts | Bins with >2000 counts | High rate bins dominated by noise | Noise dominated (total time) | Noise dominated (detector-on time) | Marked lightcurve |
|---|---|---|---|---|---|---|---|
| A | 11230 | 10700 | 0 | 0 | 0.00% | 0.00% | 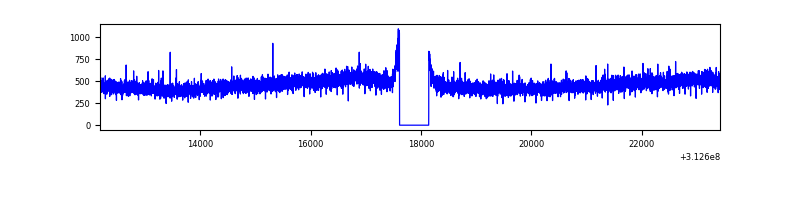 |
| B | 11231 | 10701 | 35 | 35 | 0.31% | 0.33% | 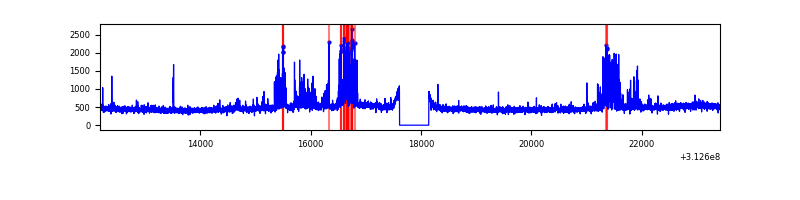 |
| C | 11231 | 10701 | 15 | 15 | 0.13% | 0.14% | 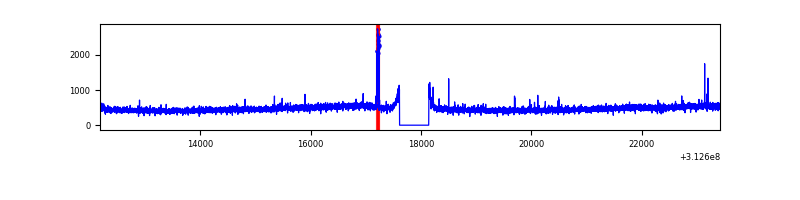 |
| D | 11231 | 10701 | 85 | 85 | 0.76% | 0.79% | 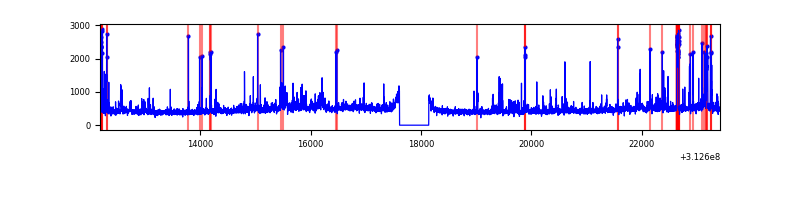 |
Top three noisy pixels from each quadrant. If the there are fewer than three noisy pixels in the level2.evt file, extra rows are filled as -1
| Pixel properties | Quadrant properties | ||||||
|---|---|---|---|---|---|---|---|
| Quadrant | DetID | PixID | Counts | Sigma | Mean | Median | Sigma |
| A | 13 | 254 | 17337 | 62.84 | 1268 | 1238 | 256.2 |
| A | 3 | 137 | 11165 | 38.75 | 1268 | 1238 | 256.2 |
| A | 0 | 226 | 11038 | 38.25 | 1268 | 1238 | 256.2 |
| B | 15 | 33 | 653111 | 2698.01 | 1261 | 1230 | 241.6 |
| B | 12 | 111 | 29715 | 117.89 | 1261 | 1230 | 241.6 |
| B | 11 | 111 | 26305 | 103.78 | 1261 | 1230 | 241.6 |
| C | 14 | 238 | 193298 | 669.92 | 1221 | 1228 | 286.7 |
| C | 10 | 22 | 63165 | 216.03 | 1221 | 1228 | 286.7 |
| C | 2 | 16 | 19097 | 62.32 | 1221 | 1228 | 286.7 |
| D | 1 | 52 | 398675 | 1316.44 | 1233 | 1198 | 301.9 |
| D | 12 | 227 | 171737 | 564.83 | 1233 | 1198 | 301.9 |
| D | 13 | 172 | 122591 | 402.05 | 1233 | 1198 | 301.9 |
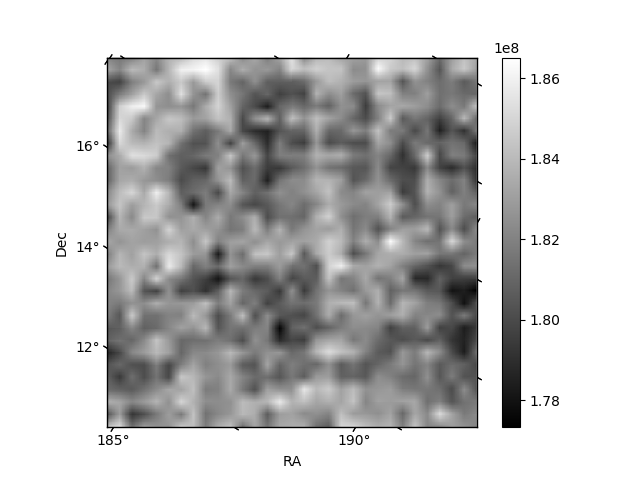
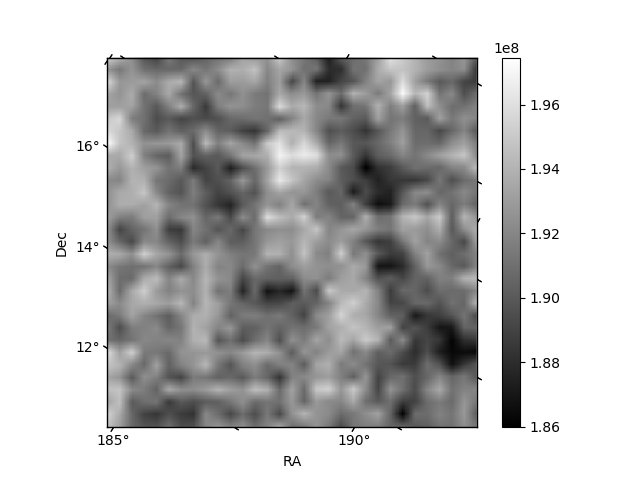
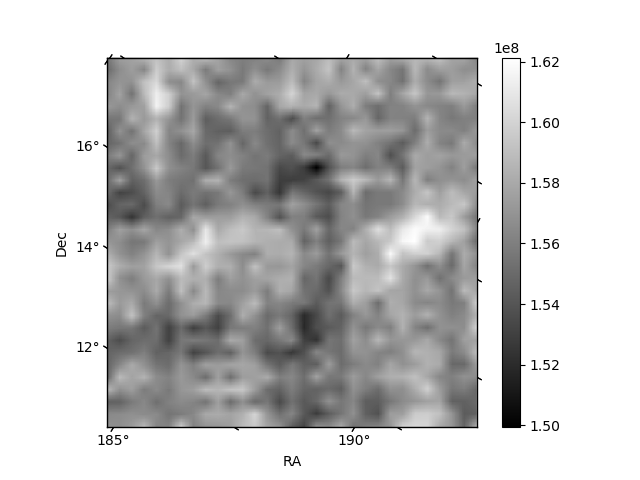
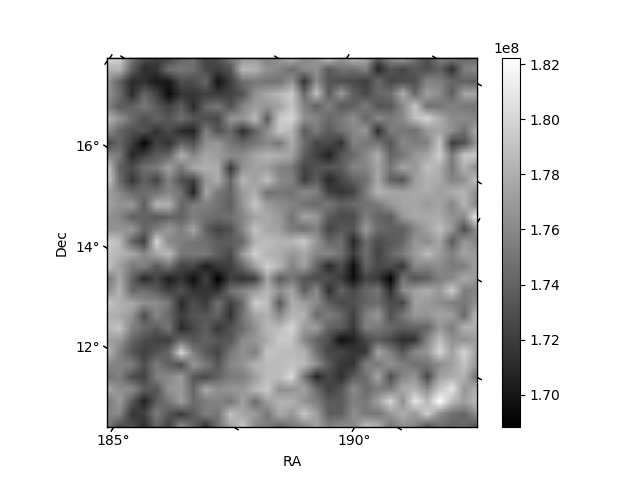
Histogram calculated using DETX and DETY for each event in the final _common_clean file
| Quadrant A |  |
 |
Quadrant B |
|---|---|---|---|
| Quadrant D |  |
 |
Quadrant C |
| Plot type | Count rate plots | Images |
|---|---|---|
| Comparison with Poisson distribution Blue bars denote a histogram of data divided into 1 sec bins. Red curve is a Poisson curve with rate = median count rate of data. |
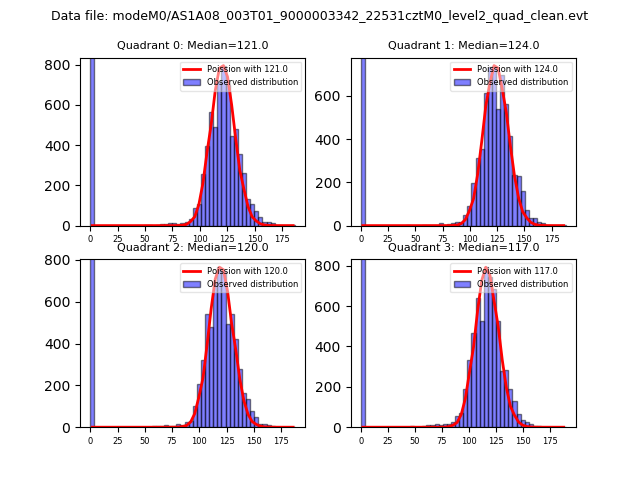 |
 |
| Quadrant-wise count rates Data is divided into 100 sec bins |
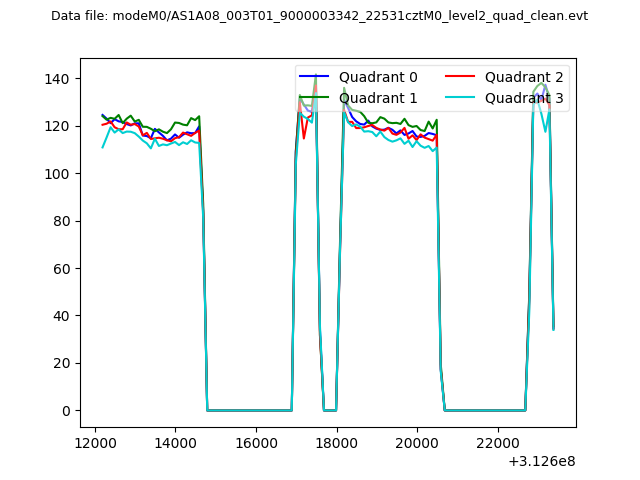 |
|
| Module-wise count rates for Quadrant A Data is divided into 100 sec bins |
 |
 |
| Module-wise count rates for Quadrant B Data is divided into 100 sec bins |
 |
 |
| Module-wise count rates for Quadrant C Data is divided into 100 sec bins |
 |
 |
| Module-wise count rates for Quadrant D Data is divided into 100 sec bins |
 |
 |
| Parameter | Plot |
|---|---|
| CZT HV Monitor |  |
| D_VDD |  |
| Temperature 1 |  |
| Veto HV Monitor |  |
| Veto LLD |  |
| Alpha Counter | 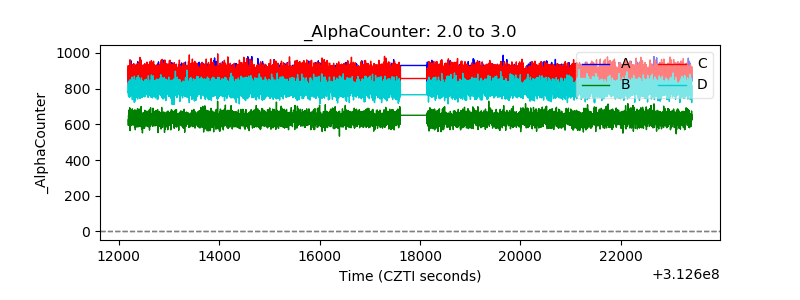 |
| _CPM_Rate | 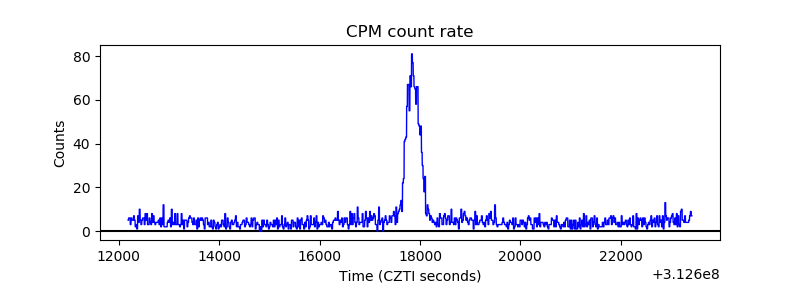 |
| CZT Counter |  |
| +2.5 Volts monitor |  |
| +5 Volts monitor |  |
| _ROLL_ROT |  |
| _Roll_DEC |  |
| _Roll_RA |  |
| Veto Counter |  |