| Param | Original file | Final file |
|---|---|---|
| Filename | modeM0/AS1A07_049T01_9000003344cztM0_level2.fits | modeM0/AS1A07_049T01_9000003344cztM0_level2_quad_clean.evt |
| Size (bytes) | 614,747,520 | 472,138,560 |
| Size | 586.3 MB | 450.3 MB |
| Events in quadrant A | 3,834,630 | 2,638,064 |
| Events in quadrant B | 3,672,132 | 2,644,081 |
| Events in quadrant C | 3,715,772 | 2,494,652 |
| Events in quadrant D | 3,057,990 | 2,184,807 |
| Mode M0 | |||
|---|---|---|---|
| Quadrant | BADHDUFLAG | Total packets | Discarded packets |
| A | 0 | 130386 | 0 |
| B | 0 | 135103 | 0 |
| C | 0 | 130882 | 0 |
| D | 0 | 185077 | 0 |
| Mode M9 | |||
|---|---|---|---|
| Quadrant | BADHDUFLAG | Total packets | Discarded packets |
| A | 0 | 105 | 0 |
| B | 0 | 105 | 0 |
| C | 0 | 105 | 0 |
| D | 0 | 105 | 0 |
| Mode SS | |||
|---|---|---|---|
| Quadrant | BADHDUFLAG | Total packets | Discarded packets |
| A | 0 | 1286 | 0 |
| B | 0 | 1286 | 0 |
| C | 0 | 1286 | 0 |
| D | 0 | 1286 | 0 |
| Quadrant | Total seconds | Saturated seconds | Saturation percentage |
|---|---|---|---|
| A | 63204 | 521 | 0.824315% |
| B | 63204 | 902 | 1.427125% |
| C | 63204 | 831 | 1.314790% |
| D | 63204 | 6043 | 9.561104% |
Noise dominated data is calculated using 1-second bins in cleaned event files. If a bin has >2000 counts, and if more than 50% of those come from <1% of pixels, then it is considered to be noise-dominated and hence unusable.
| Quadrant | # 1 sec bins | Bins with >0 counts | Bins with >2000 counts | High rate bins dominated by noise | Noise dominated (total time) | Noise dominated (detector-on time) | Marked lightcurve |
|---|---|---|---|---|---|---|---|
| A | 73743 | 63194 | 0 | 0 | 0.00% | 0.00% | 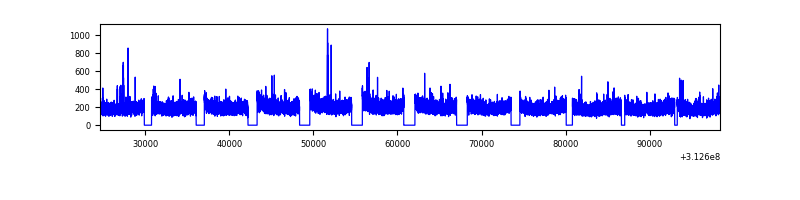 |
| B | 73743 | 63192 | 0 | 0 | 0.00% | 0.00% |  |
| C | 73743 | 63191 | 0 | 0 | 0.00% | 0.00% |  |
| D | 73743 | 62021 | 0 | 0 | 0.00% | 0.00% | 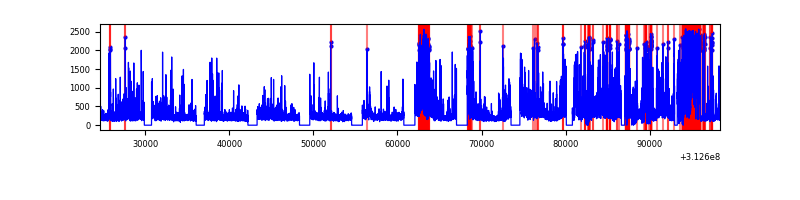 |
Top three noisy pixels from each quadrant. If the there are fewer than three noisy pixels in the level2.evt file, extra rows are filled as -1
| Pixel properties | Quadrant properties | ||||||
|---|---|---|---|---|---|---|---|
| Quadrant | DetID | PixID | Counts | Sigma | Mean | Median | Sigma |
| A | 0 | 29 | 3605 | 10.81 | 997 | 934 | 247.1 |
| A | 7 | 110 | 3064 | 8.62 | 997 | 934 | 247.1 |
| A | 9 | 19 | 2825 | 7.65 | 997 | 934 | 247.1 |
| B | 2 | 9 | 2994 | 10.81 | 970 | 926 | 191.2 |
| B | 2 | 8 | 2543 | 8.46 | 970 | 926 | 191.2 |
| B | 5 | 128 | 2452 | 7.98 | 970 | 926 | 191.2 |
| C | 12 | 241 | 2683 | 7.07 | 982 | 920 | 249.5 |
| C | 9 | 233 | 2501 | 6.34 | 982 | 920 | 249.5 |
| C | 9 | 209 | 2491 | 6.3 | 982 | 920 | 249.5 |
| D | 3 | 14 | 2246 | 6.21 | 872 | 794 | 233.7 |
| D | 13 | 238 | 2201 | 6.02 | 872 | 794 | 233.7 |
| D | 6 | 231 | 2165 | 5.87 | 872 | 794 | 233.7 |
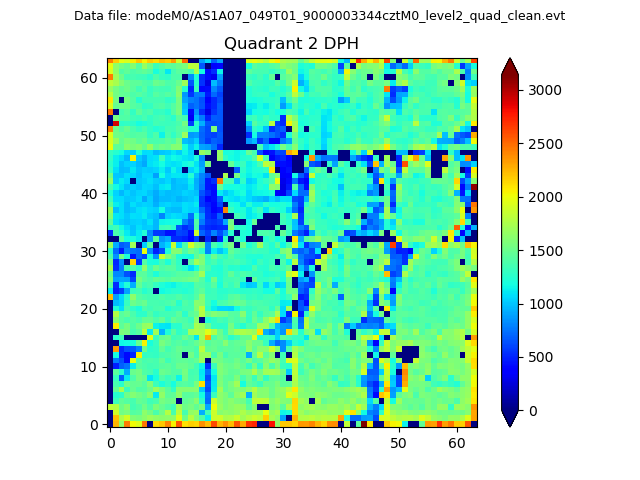
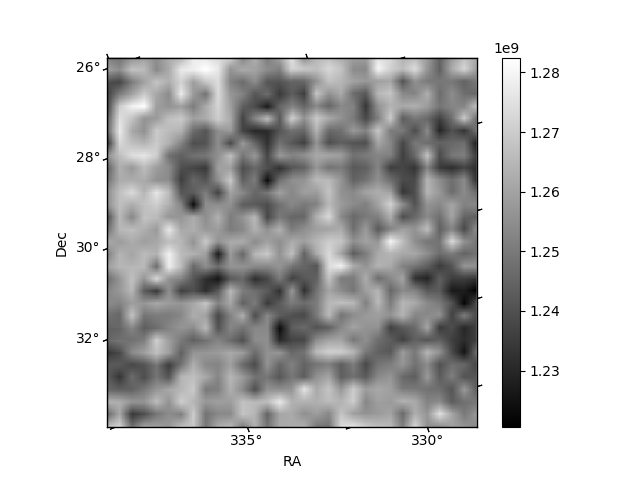
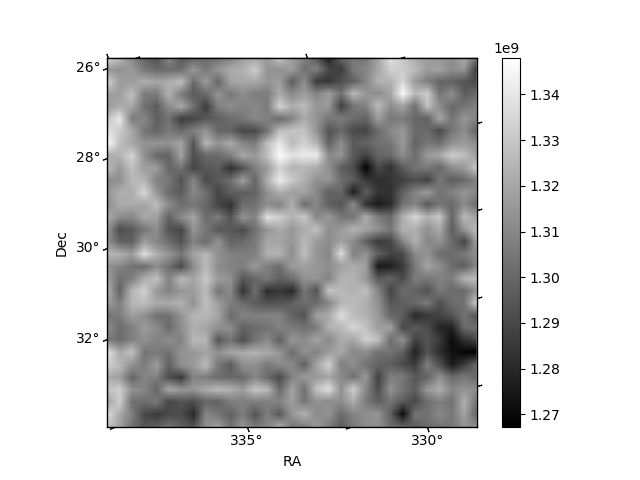
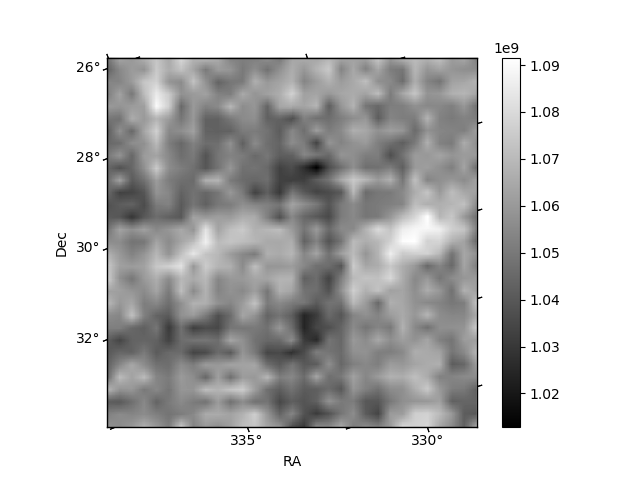
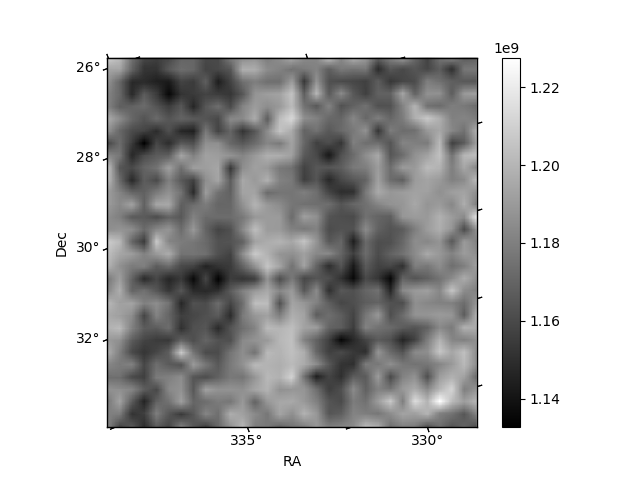
Histogram calculated using DETX and DETY for each event in the final _common_clean file
| Quadrant A | 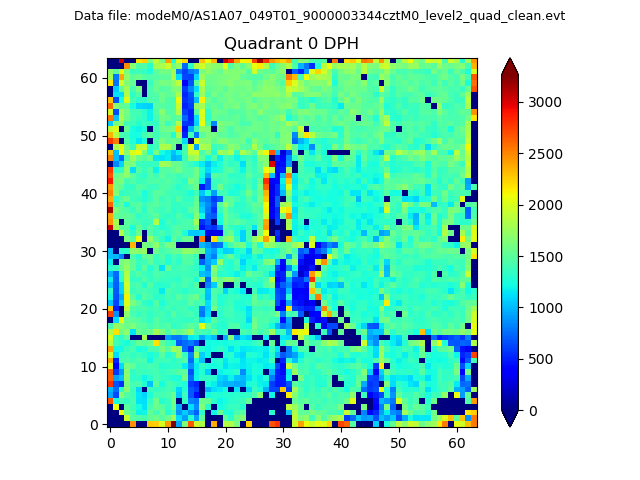 |
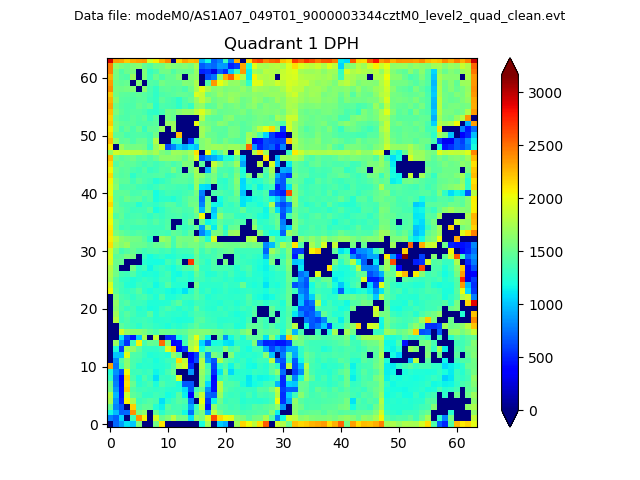 |
Quadrant B |
|---|---|---|---|
| Quadrant D | 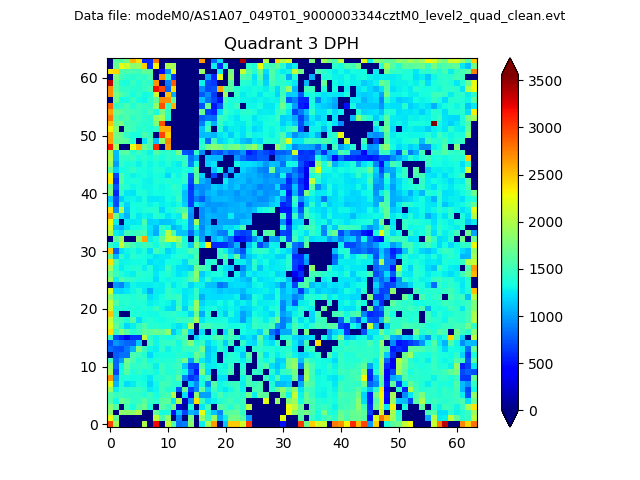 |
 |
Quadrant C |
| Plot type | Count rate plots | Images |
|---|---|---|
| Comparison with Poisson distribution Blue bars denote a histogram of data divided into 1 sec bins. Red curve is a Poisson curve with rate = median count rate of data. |
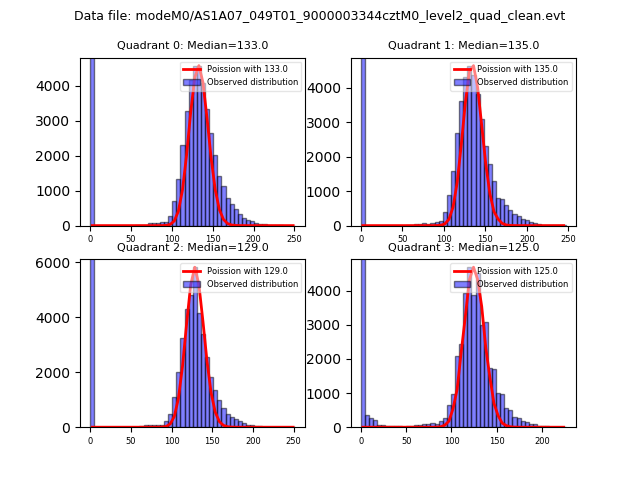 |
 |
| Quadrant-wise count rates Data is divided into 100 sec bins |
 |
|
| Module-wise count rates for Quadrant A Data is divided into 100 sec bins |
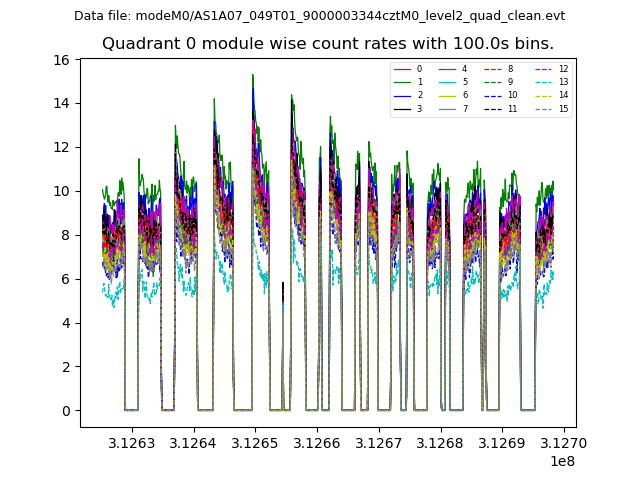 |
 |
| Module-wise count rates for Quadrant B Data is divided into 100 sec bins |
 |
 |
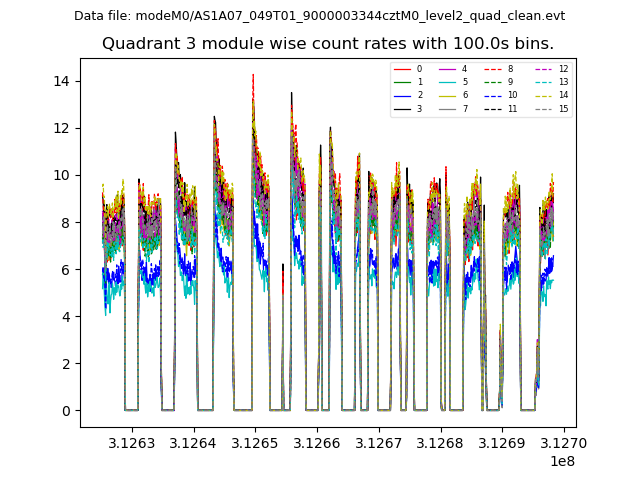
| Module-wise count rates for Quadrant C Data is divided into 100 sec bins |
 |
 |
| Module-wise count rates for Quadrant D Data is divided into 100 sec bins |
 |
 |
| Parameter | Plot |
|---|---|
| CZT HV Monitor | 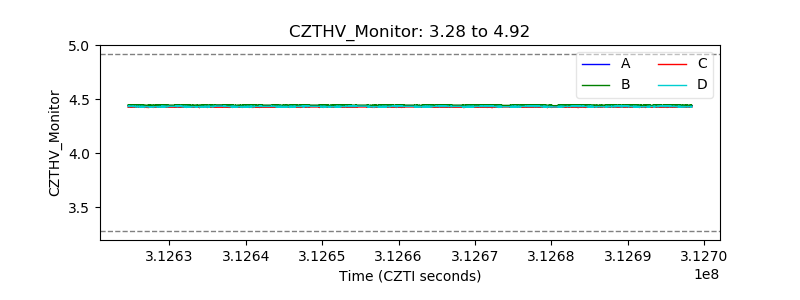 |
| D_VDD | 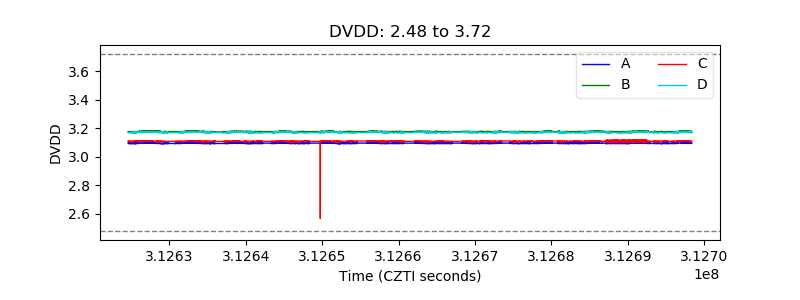 |
| Temperature 1 | 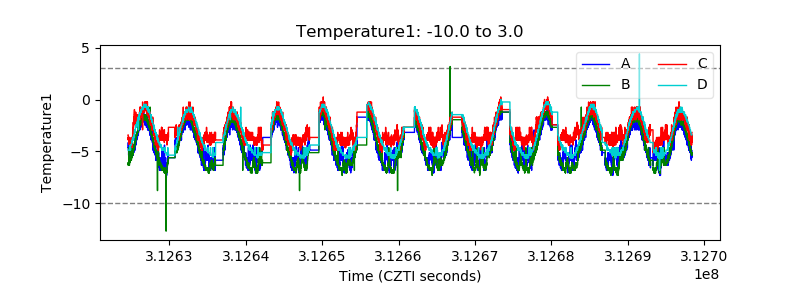 |
| Veto HV Monitor | 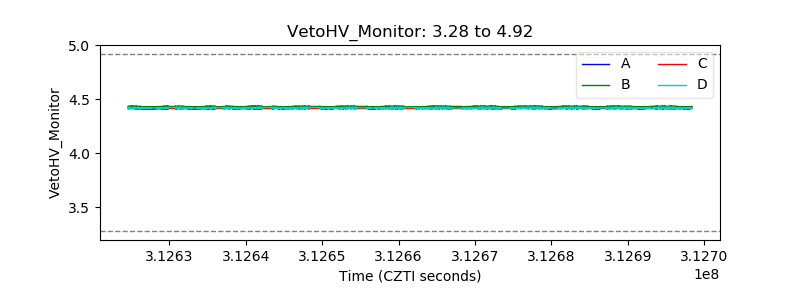 |
| Veto LLD | 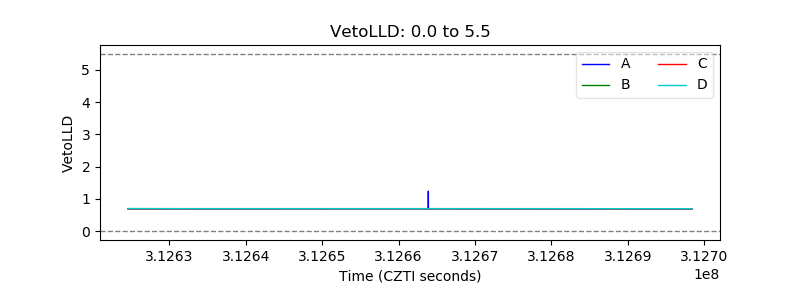 |
| Alpha Counter | 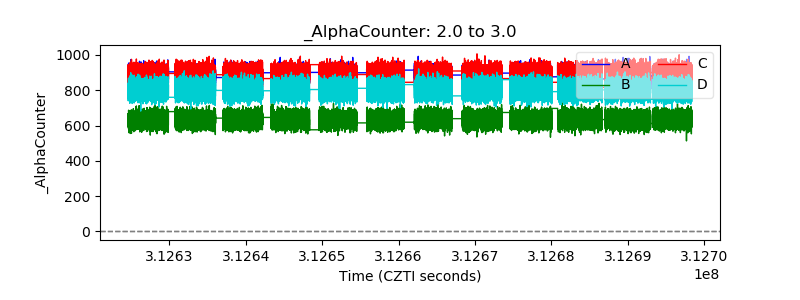 |
| _CPM_Rate | 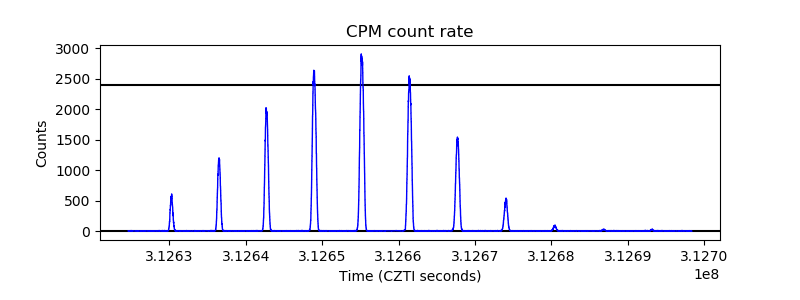 |
| CZT Counter | 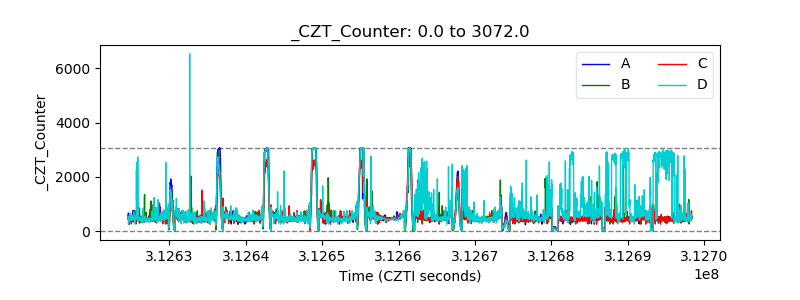 |
| +2.5 Volts monitor | 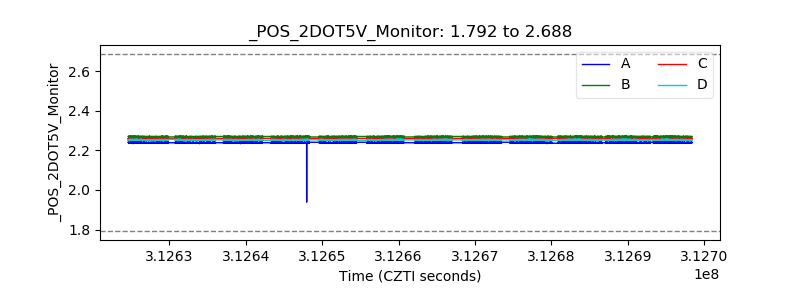 |
| +5 Volts monitor | 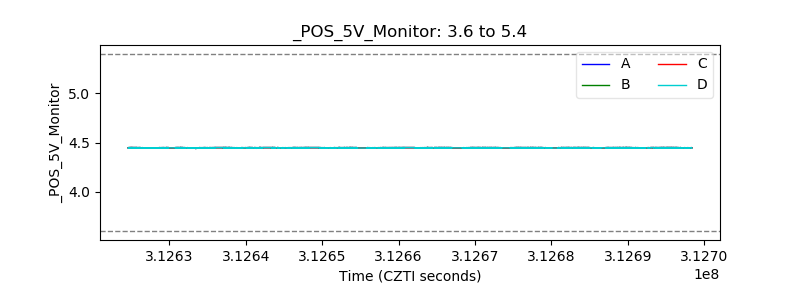 |
| _ROLL_ROT | 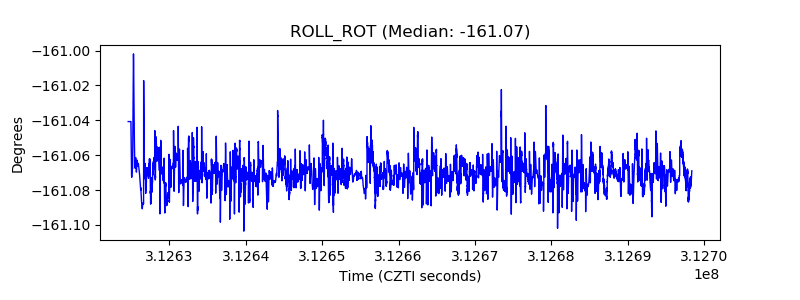 |
| _Roll_DEC | 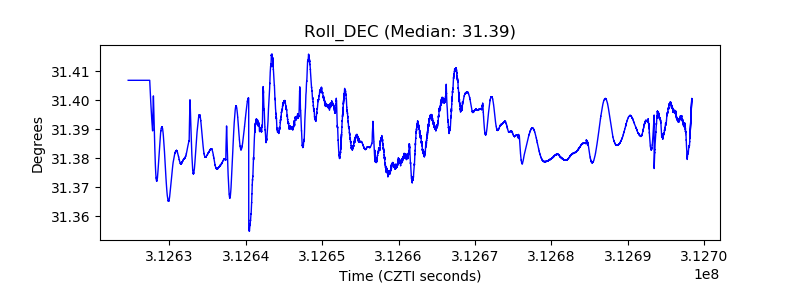 |
| _Roll_RA | 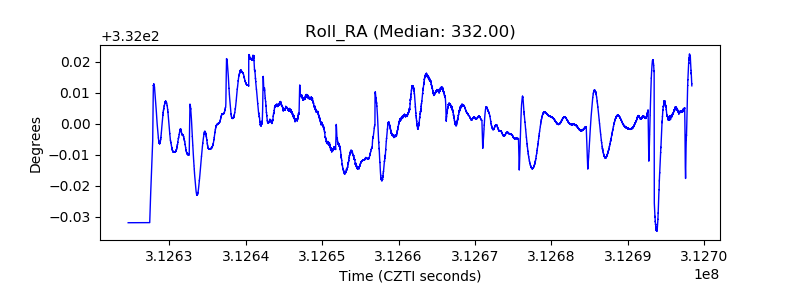 |
| Veto Counter | 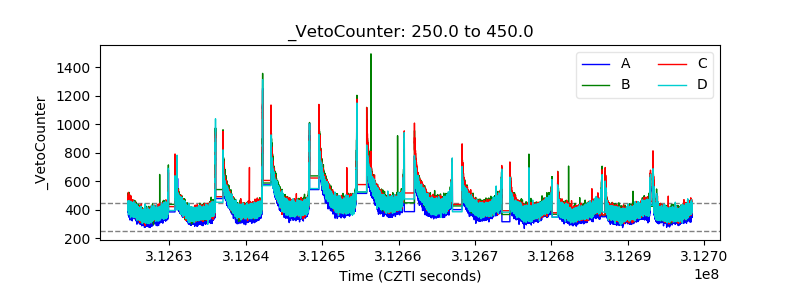 |