| Param | Original file | Final file |
|---|---|---|
| Filename | modeM0/AS1A07_049T01_9000003344_22531cztM0_level2.evt | modeM0/AS1A07_049T01_9000003344_22531cztM0_level2_quad_clean.evt |
| Size (bytes) | 455,760,000 | 92,424,960 |
| Size | 434.6 MB | 88.1 MB |
| Events in quadrant A | 3,141,957 | 591,654 |
| Events in quadrant B | 3,311,872 | 600,710 |
| Events in quadrant C | 3,166,299 | 576,607 |
| Events in quadrant D | 3,725,860 | 561,613 |
| Mode M0 | |||
|---|---|---|---|
| Quadrant | BADHDUFLAG | Total packets | Discarded packets |
| A | 0 | 13659 | 1 |
| B | 0 | 14028 | 1 |
| C | 0 | 13641 | 1 |
| D | 0 | 15548 | 1 |
| Mode M9 | |||
|---|---|---|---|
| Quadrant | BADHDUFLAG | Total packets | Discarded packets |
| A | 0 | 8 | 0 |
| B | 0 | 8 | 0 |
| C | 0 | 8 | 0 |
| D | 0 | 8 | 0 |
| Mode SS | |||
|---|---|---|---|
| Quadrant | BADHDUFLAG | Total packets | Discarded packets |
| A | 0 | 138 | 0 |
| B | 0 | 138 | 0 |
| C | 0 | 138 | 0 |
| D | 0 | 138 | 0 |
| Quadrant | Total seconds | Saturated seconds | Saturation percentage |
|---|---|---|---|
| A | 6713 | 39 | 0.580962% |
| B | 6713 | 56 | 0.834202% |
| C | 6713 | 56 | 0.834202% |
| D | 6713 | 171 | 2.547296% |
Noise dominated data is calculated using 1-second bins in cleaned event files. If a bin has >2000 counts, and if more than 50% of those come from <1% of pixels, then it is considered to be noise-dominated and hence unusable.
| Quadrant | # 1 sec bins | Bins with >0 counts | Bins with >2000 counts | High rate bins dominated by noise | Noise dominated (total time) | Noise dominated (detector-on time) | Marked lightcurve |
|---|---|---|---|---|---|---|---|
| A | 7573 | 6713 | 0 | 0 | 0.00% | 0.00% | 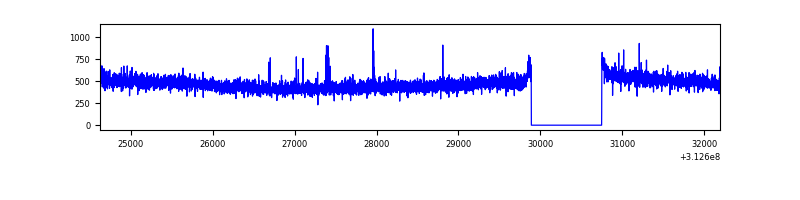 |
| B | 7573 | 6713 | 9 | 9 | 0.12% | 0.13% | 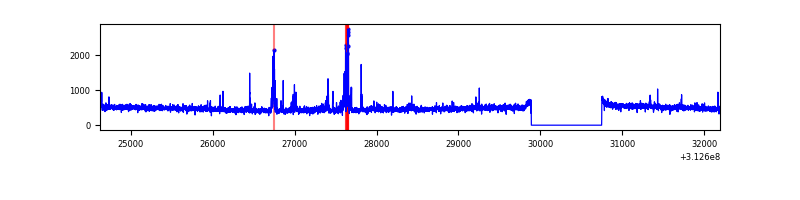 |
| C | 7573 | 6713 | 0 | 0 | 0.00% | 0.00% | 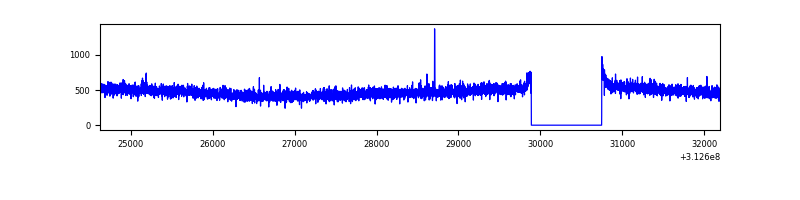 |
| D | 7573 | 6713 | 132 | 132 | 1.74% | 1.97% | 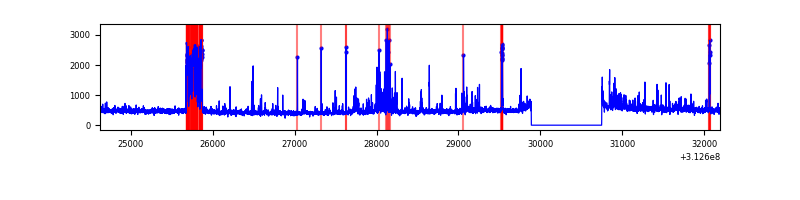 |
Top three noisy pixels from each quadrant. If the there are fewer than three noisy pixels in the level2.evt file, extra rows are filled as -1
| Pixel properties | Quadrant properties | ||||||
|---|---|---|---|---|---|---|---|
| Quadrant | DetID | PixID | Counts | Sigma | Mean | Median | Sigma |
| A | 13 | 254 | 10283 | 57.87 | 812 | 793 | 164.0 |
| A | 3 | 1 | 9242 | 51.52 | 812 | 793 | 164.0 |
| A | 0 | 226 | 7201 | 39.08 | 812 | 793 | 164.0 |
| B | 0 | 228 | 68430 | 438.68 | 807 | 785 | 154.2 |
| B | 15 | 33 | 57476 | 367.64 | 807 | 785 | 154.2 |
| B | 12 | 111 | 19342 | 120.34 | 807 | 785 | 154.2 |
| C | 14 | 238 | 123660 | 668.24 | 777 | 781 | 183.9 |
| C | 10 | 22 | 6710 | 32.24 | 777 | 781 | 183.9 |
| C | 13 | 61 | 5418 | 25.22 | 777 | 781 | 183.9 |
| D | 1 | 52 | 495541 | 2590.49 | 785 | 762 | 191.0 |
| D | 13 | 104 | 75613 | 391.89 | 785 | 762 | 191.0 |
| D | 7 | 223 | 64589 | 334.18 | 785 | 762 | 191.0 |
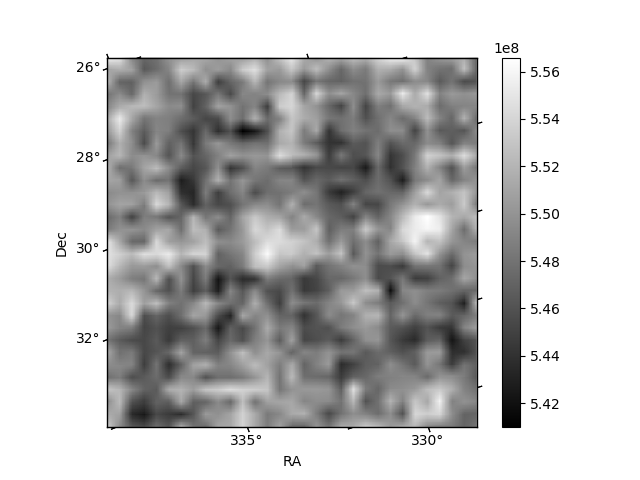
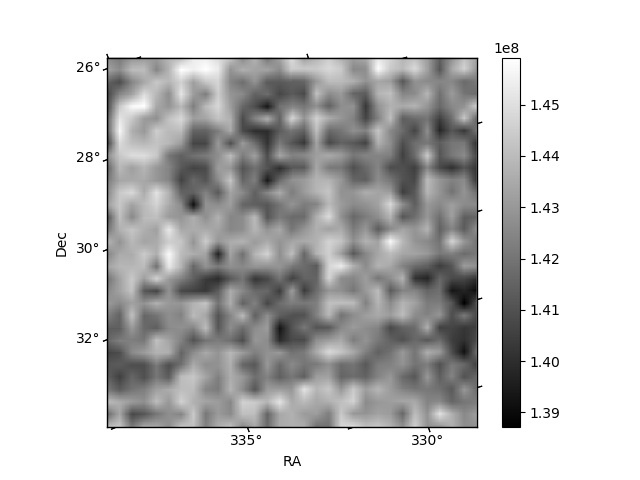
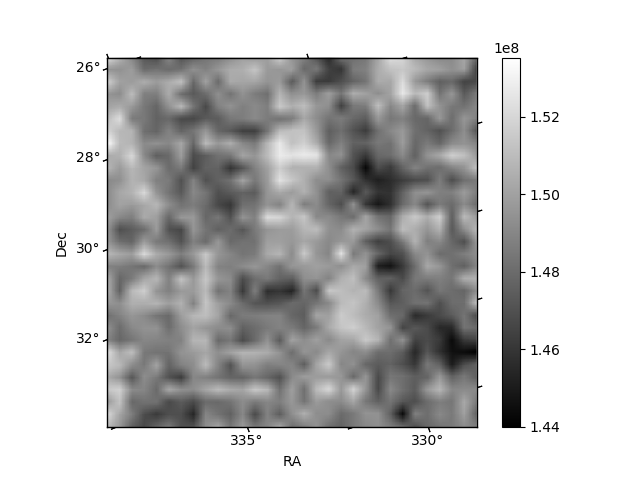
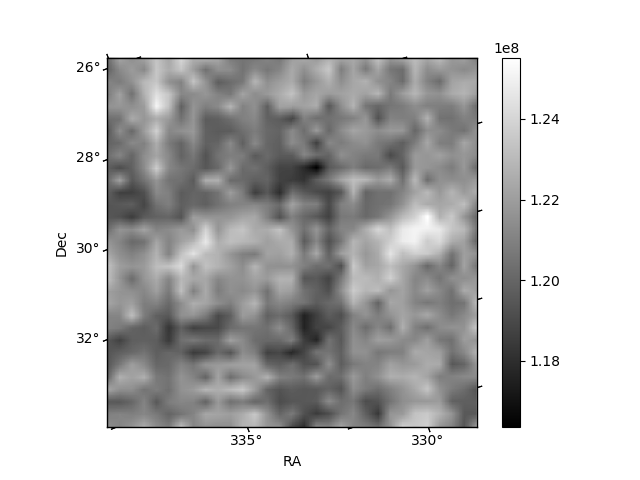
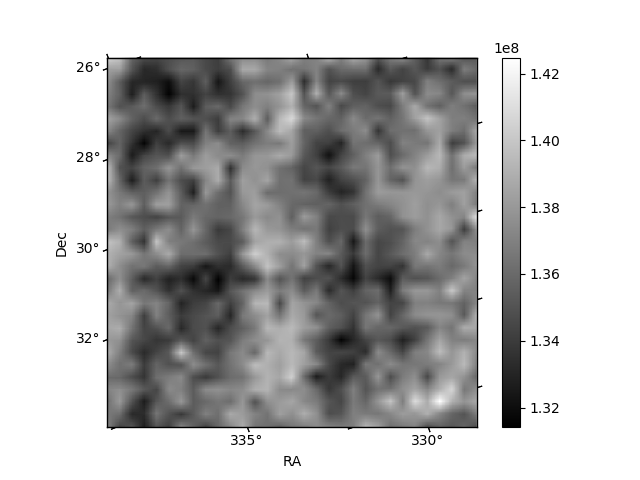
Histogram calculated using DETX and DETY for each event in the final _common_clean file
| Quadrant A | 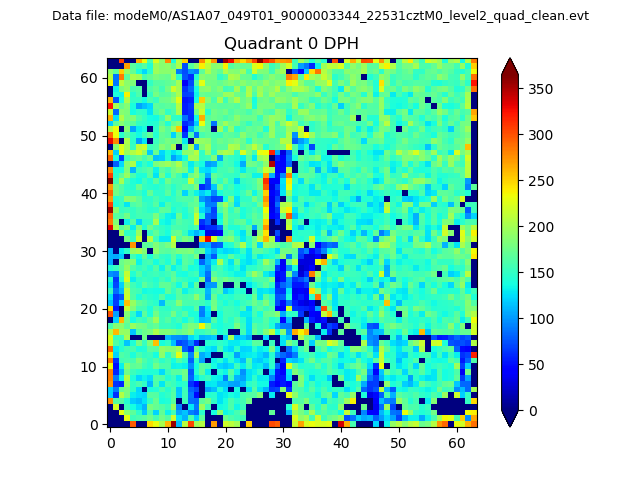 |
 |
Quadrant B |
|---|---|---|---|
| Quadrant D | 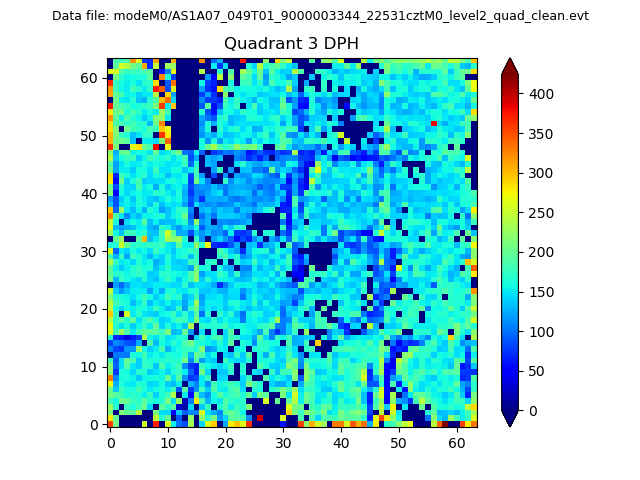 |
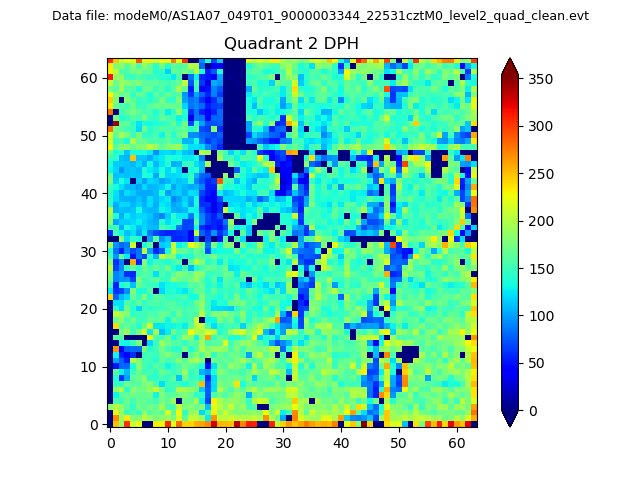 |
Quadrant C |
| Plot type | Count rate plots | Images |
|---|---|---|
| Comparison with Poisson distribution Blue bars denote a histogram of data divided into 1 sec bins. Red curve is a Poisson curve with rate = median count rate of data. |
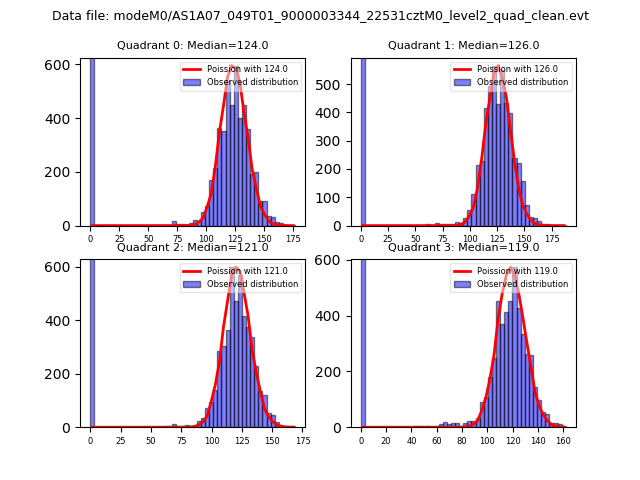 |
 |
| Quadrant-wise count rates Data is divided into 100 sec bins |
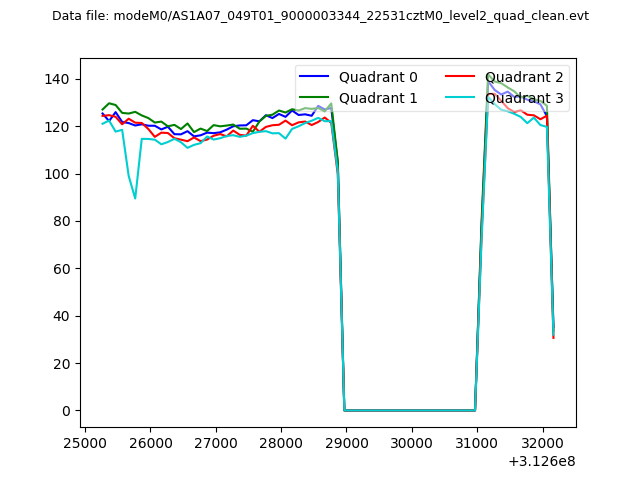 |
|
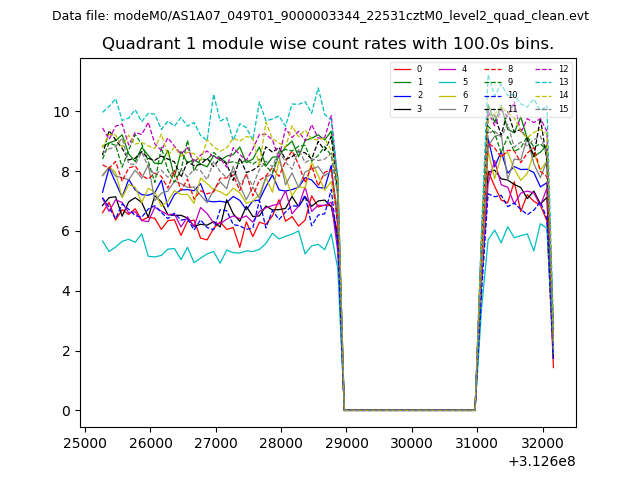
| Module-wise count rates for Quadrant A Data is divided into 100 sec bins |
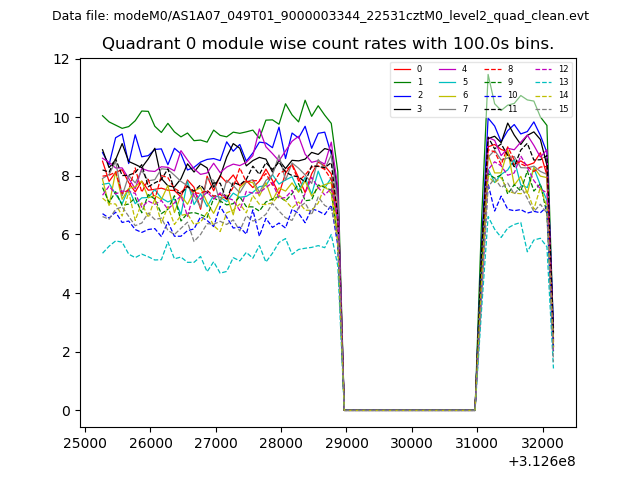 |
 |
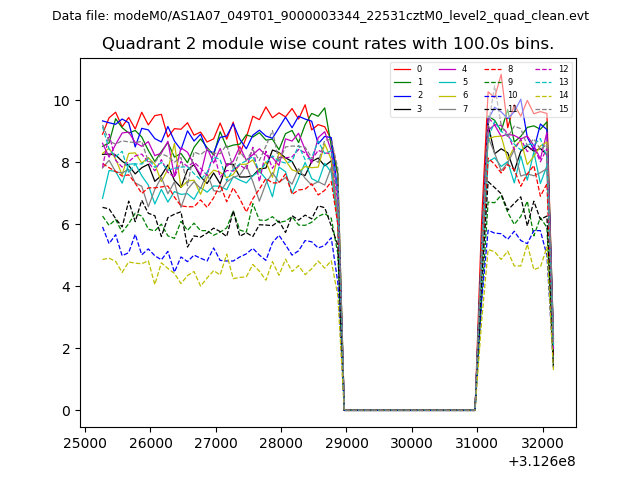
| Module-wise count rates for Quadrant B Data is divided into 100 sec bins |
 |
 |
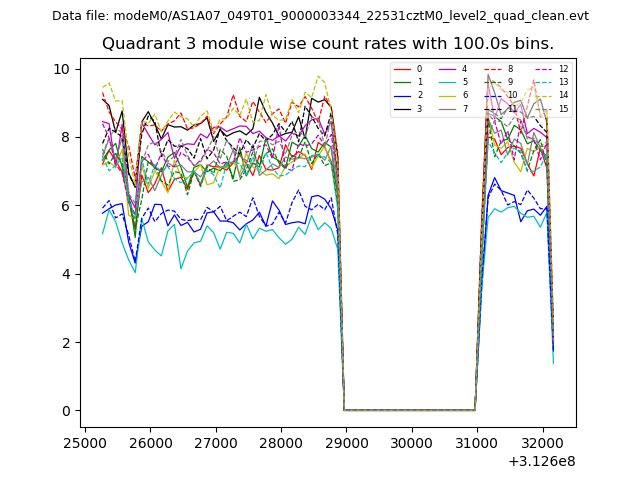
| Module-wise count rates for Quadrant C Data is divided into 100 sec bins |
 |
 |
| Module-wise count rates for Quadrant D Data is divided into 100 sec bins |
 |
 |
| Parameter | Plot |
|---|---|
| CZT HV Monitor | 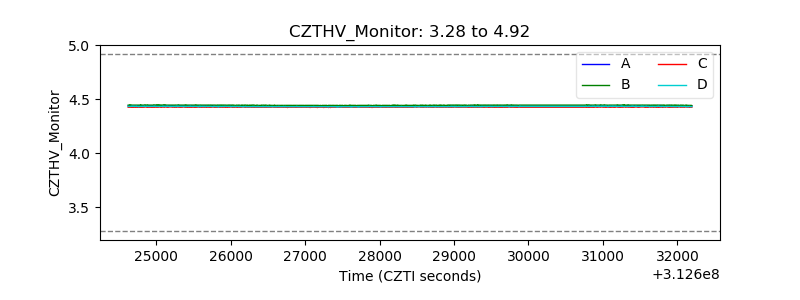 |
| D_VDD | 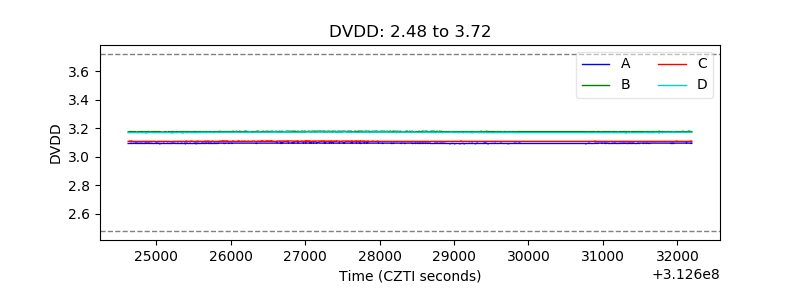 |
| Temperature 1 | 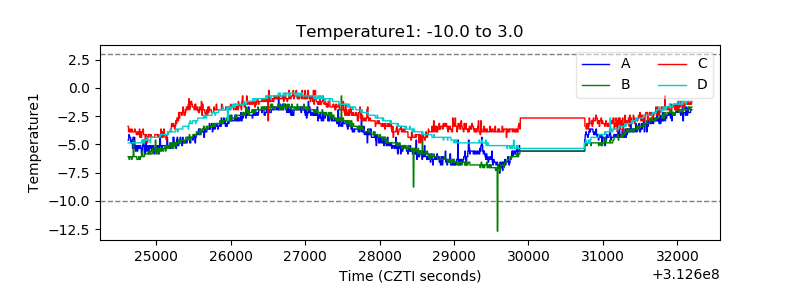 |
| Veto HV Monitor |  |
| Veto LLD | 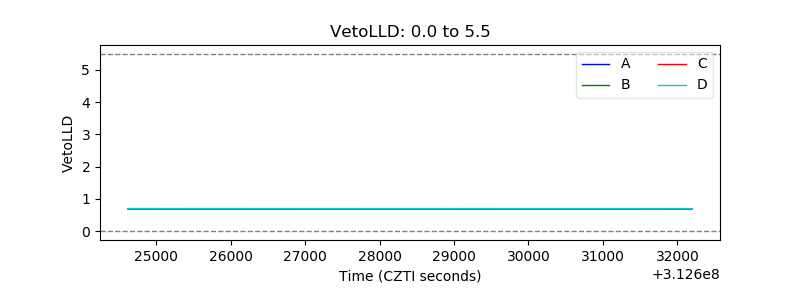 |
| Alpha Counter | 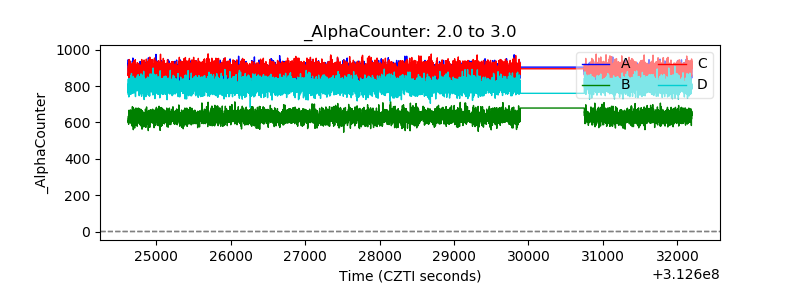 |
| _CPM_Rate | 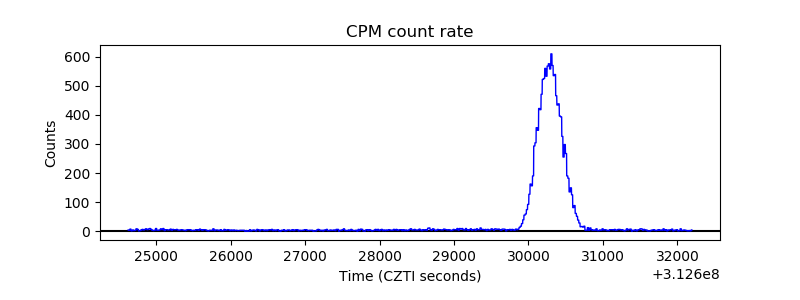 |
| CZT Counter | 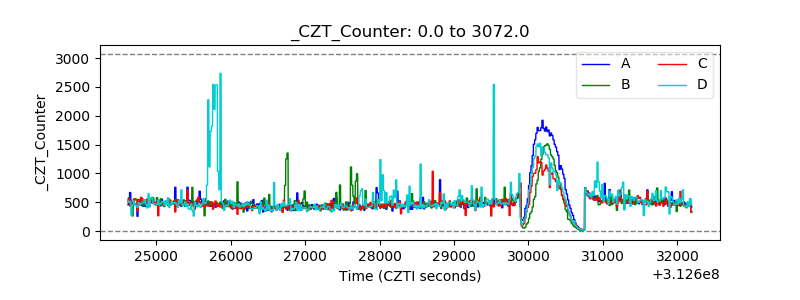 |
| +2.5 Volts monitor |  |
| +5 Volts monitor |  |
| _ROLL_ROT | 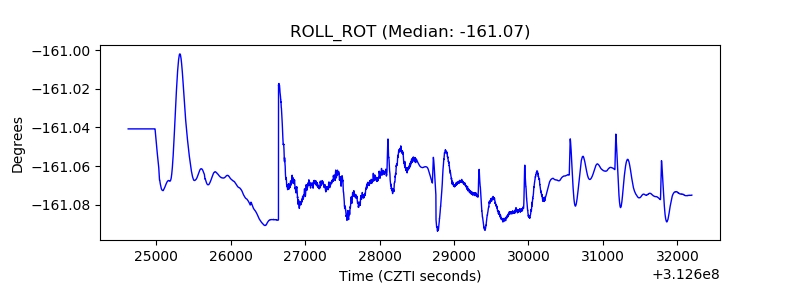 |
| _Roll_DEC | 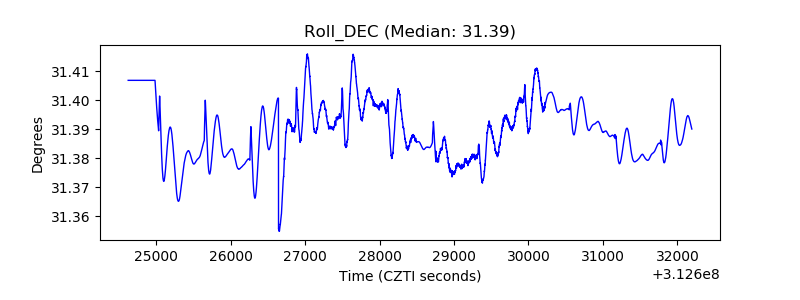 |
| _Roll_RA | 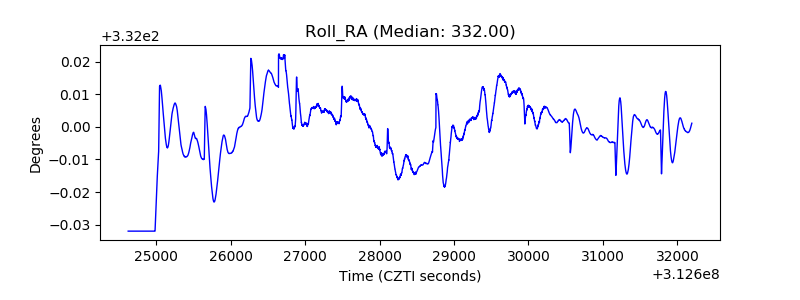 |
| Veto Counter | 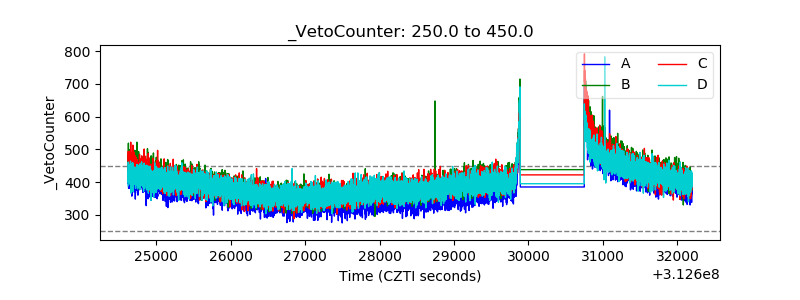 |