| Param | Original file | Final file |
|---|---|---|
| Filename | modeM0/AS1A07_049T01_9000003344_22532cztM0_level2.evt | modeM0/AS1A07_049T01_9000003344_22532cztM0_level2_quad_clean.evt |
| Size (bytes) | 412,067,520 | 98,078,400 |
| Size | 393.0 MB | 93.5 MB |
| Events in quadrant A | 2,925,180 | 649,581 |
| Events in quadrant B | 3,047,271 | 656,260 |
| Events in quadrant C | 2,962,018 | 620,502 |
| Events in quadrant D | 3,124,705 | 612,571 |
| Mode M0 | |||
|---|---|---|---|
| Quadrant | BADHDUFLAG | Total packets | Discarded packets |
| A | 0 | 12771 | 1 |
| B | 0 | 13028 | 2 |
| C | 0 | 12793 | 1 |
| D | 0 | 13287 | 1 |
| Mode M9 | |||
|---|---|---|---|
| Quadrant | BADHDUFLAG | Total packets | Discarded packets |
| A | 0 | 10 | 0 |
| B | 0 | 10 | 0 |
| C | 0 | 10 | 0 |
| D | 0 | 10 | 0 |
| Mode SS | |||
|---|---|---|---|
| Quadrant | BADHDUFLAG | Total packets | Discarded packets |
| A | 0 | 126 | 0 |
| B | 0 | 126 | 0 |
| C | 0 | 126 | 0 |
| D | 0 | 126 | 0 |
| Quadrant | Total seconds | Saturated seconds | Saturation percentage |
|---|---|---|---|
| A | 6178 | 64 | 1.035934% |
| B | 6178 | 70 | 1.133053% |
| C | 6178 | 85 | 1.375850% |
| D | 6178 | 54 | 0.874069% |
Noise dominated data is calculated using 1-second bins in cleaned event files. If a bin has >2000 counts, and if more than 50% of those come from <1% of pixels, then it is considered to be noise-dominated and hence unusable.
| Quadrant | # 1 sec bins | Bins with >0 counts | Bins with >2000 counts | High rate bins dominated by noise | Noise dominated (total time) | Noise dominated (detector-on time) | Marked lightcurve |
|---|---|---|---|---|---|---|---|
| A | 7158 | 6178 | 0 | 0 | 0.00% | 0.00% | 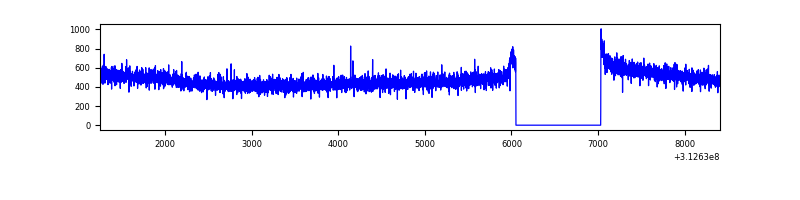 |
| B | 7158 | 6178 | 2 | 2 | 0.03% | 0.03% | 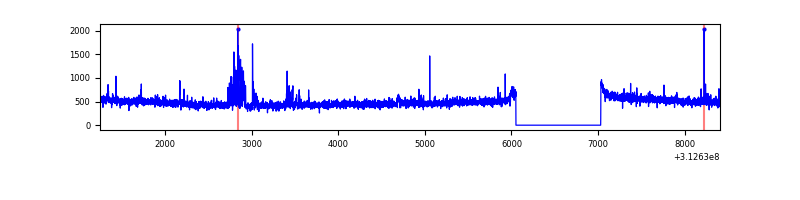 |
| C | 7158 | 6178 | 4 | 4 | 0.06% | 0.06% | 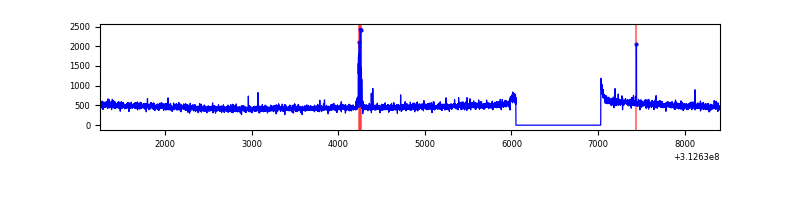 |
| D | 7158 | 6178 | 9 | 9 | 0.13% | 0.15% | 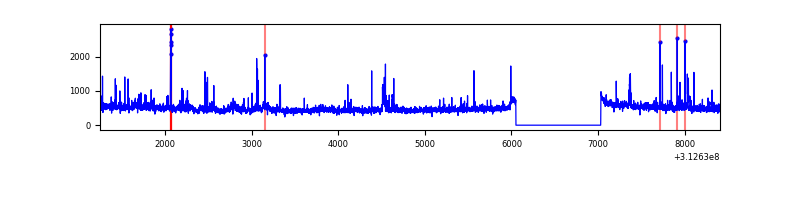 |
Top three noisy pixels from each quadrant. If the there are fewer than three noisy pixels in the level2.evt file, extra rows are filled as -1
| Pixel properties | Quadrant properties | ||||||
|---|---|---|---|---|---|---|---|
| Quadrant | DetID | PixID | Counts | Sigma | Mean | Median | Sigma |
| A | 13 | 254 | 9712 | 58.85 | 758 | 742 | 152.4 |
| A | 0 | 226 | 6763 | 39.5 | 758 | 742 | 152.4 |
| A | 3 | 137 | 6382 | 37.0 | 758 | 742 | 152.4 |
| B | 15 | 33 | 83748 | 584.3 | 749 | 730 | 142.1 |
| B | 12 | 111 | 17350 | 116.98 | 749 | 730 | 142.1 |
| B | 11 | 111 | 15559 | 104.37 | 749 | 730 | 142.1 |
| C | 14 | 238 | 114906 | 678.47 | 720 | 722 | 168.3 |
| C | 10 | 22 | 34666 | 201.69 | 720 | 722 | 168.3 |
| C | 13 | 61 | 5030 | 25.6 | 720 | 722 | 168.3 |
| D | 1 | 52 | 161663 | 895.58 | 734 | 710 | 179.7 |
| D | 12 | 227 | 93487 | 516.23 | 734 | 710 | 179.7 |
| D | 5 | 32 | 28590 | 155.13 | 734 | 710 | 179.7 |
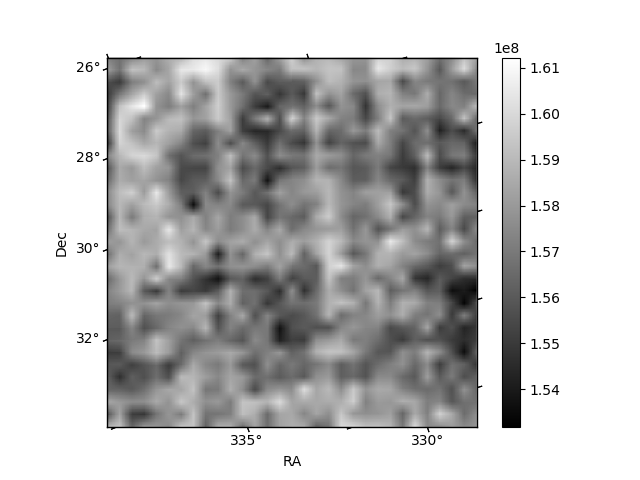
Histogram calculated using DETX and DETY for each event in the final _common_clean file
| Quadrant A | 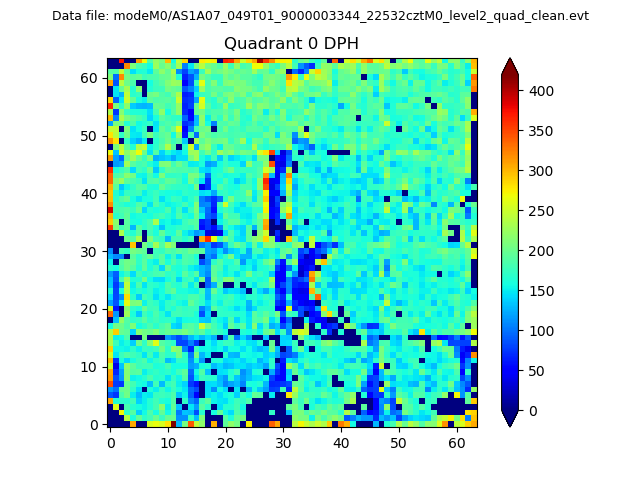 |
 |
Quadrant B |
|---|---|---|---|
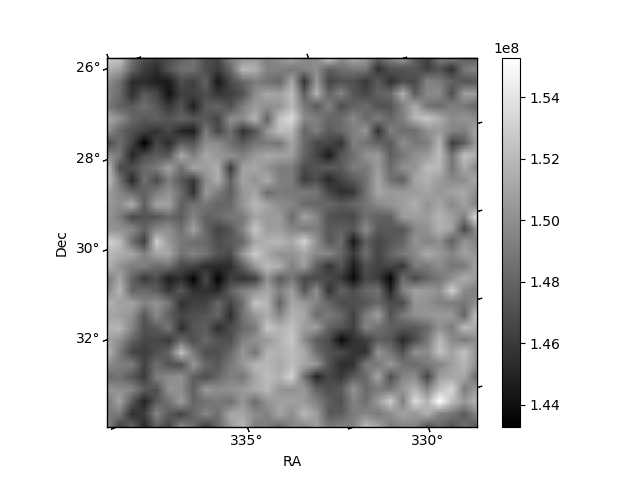
| Quadrant D | 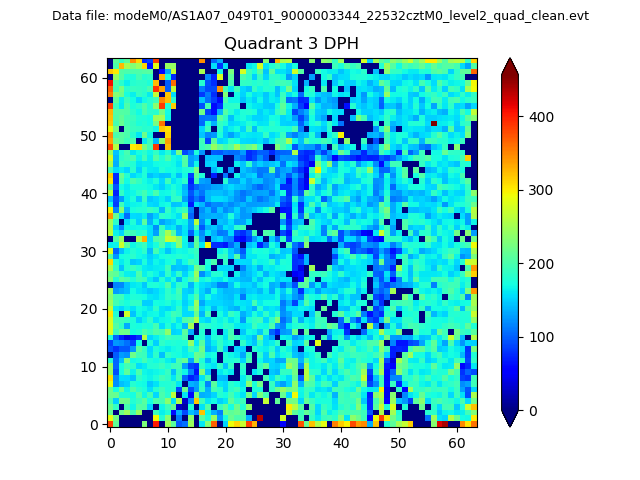 |
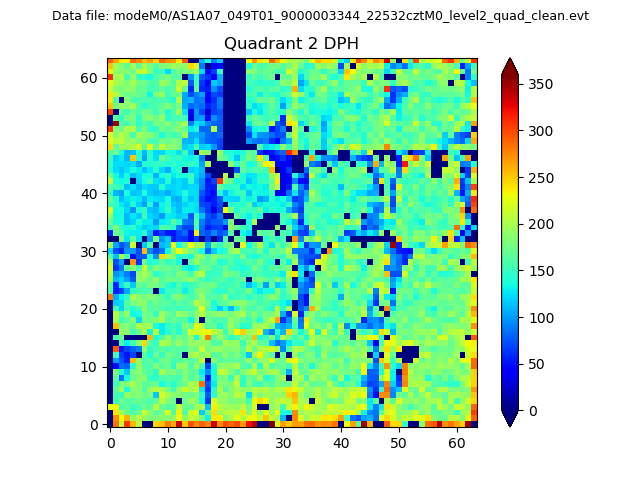 |
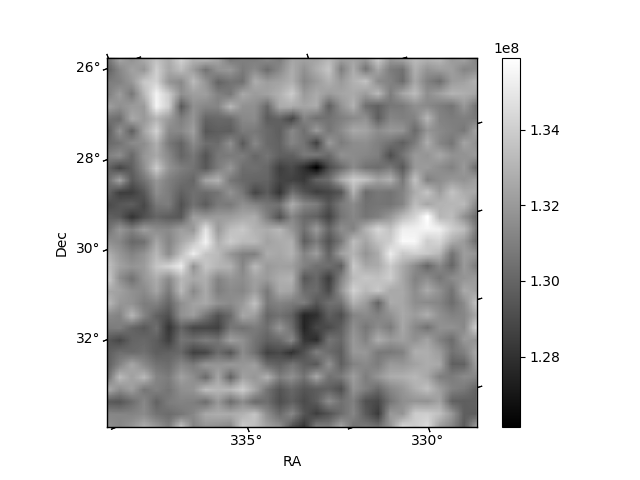
Quadrant C |
| Plot type | Count rate plots | Images |
|---|---|---|
| Comparison with Poisson distribution Blue bars denote a histogram of data divided into 1 sec bins. Red curve is a Poisson curve with rate = median count rate of data. |
 |
 |
| Quadrant-wise count rates Data is divided into 100 sec bins |
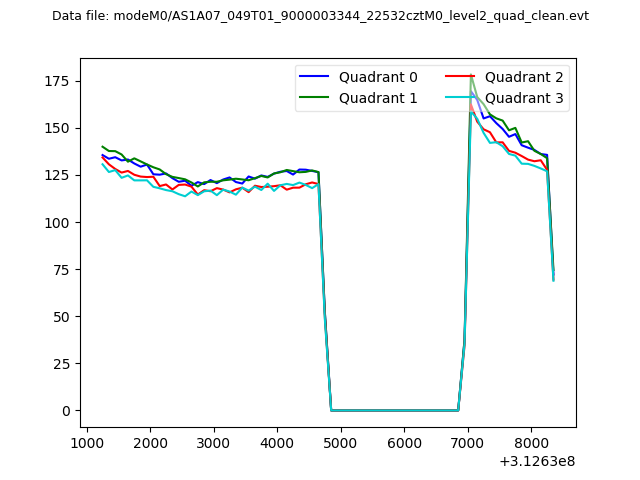 |
|
| Module-wise count rates for Quadrant A Data is divided into 100 sec bins |
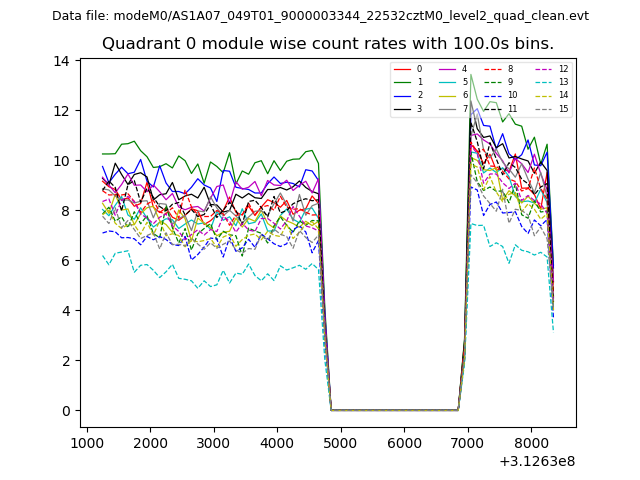 |
 |
| Module-wise count rates for Quadrant B Data is divided into 100 sec bins |
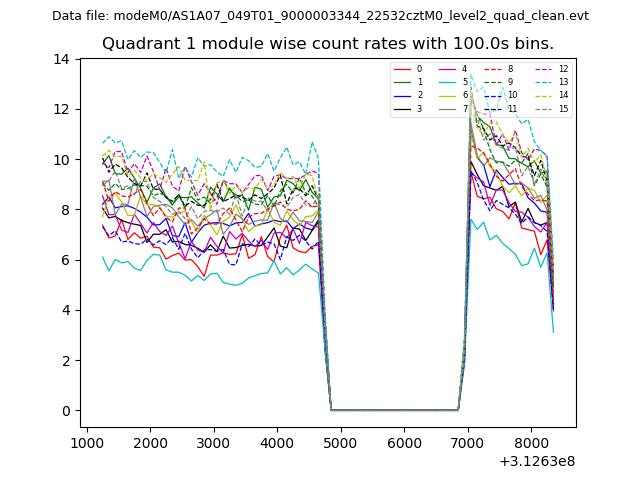 |
 |
| Module-wise count rates for Quadrant C Data is divided into 100 sec bins |
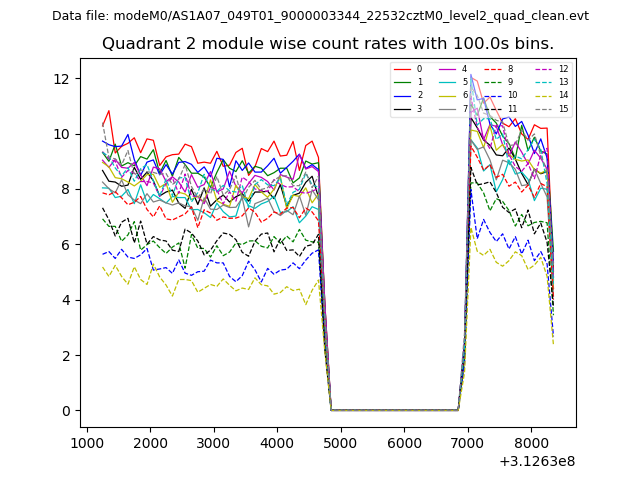 |
 |
| Module-wise count rates for Quadrant D Data is divided into 100 sec bins |
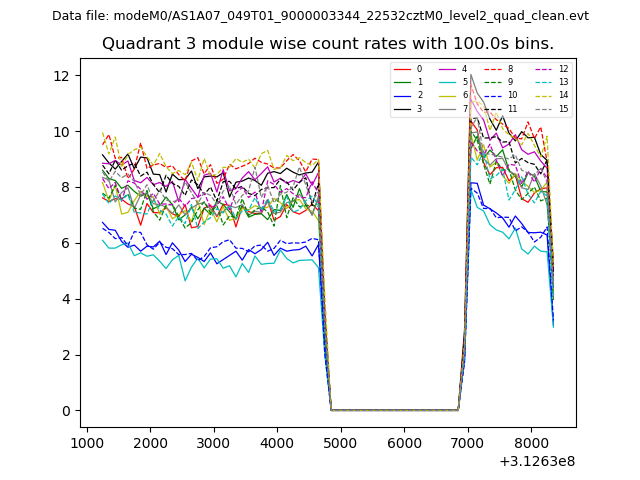 |
 |
| Parameter | Plot |
|---|---|
| CZT HV Monitor | 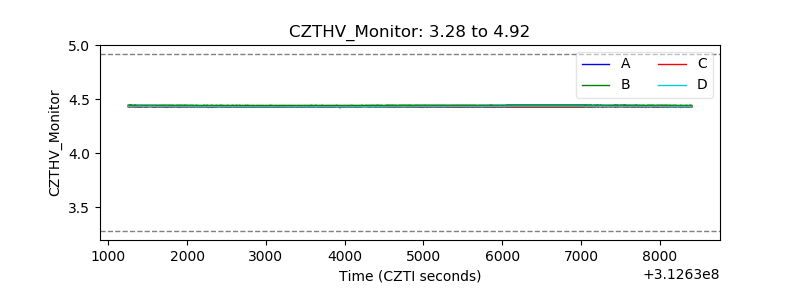 |
| D_VDD | 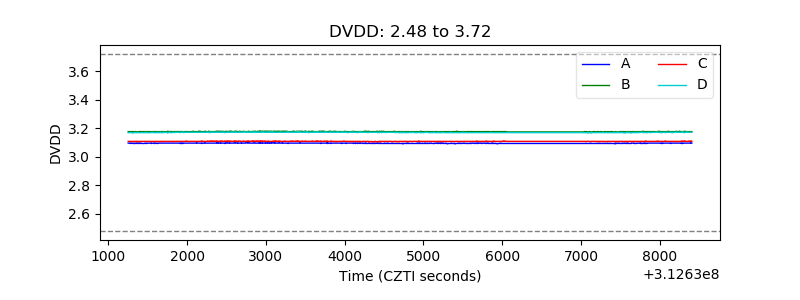 |
| Temperature 1 | 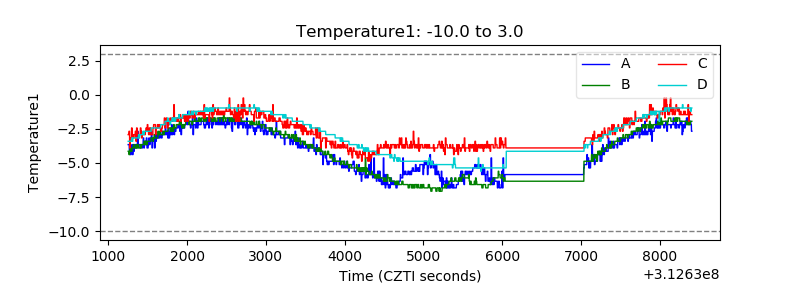 |
| Veto HV Monitor | 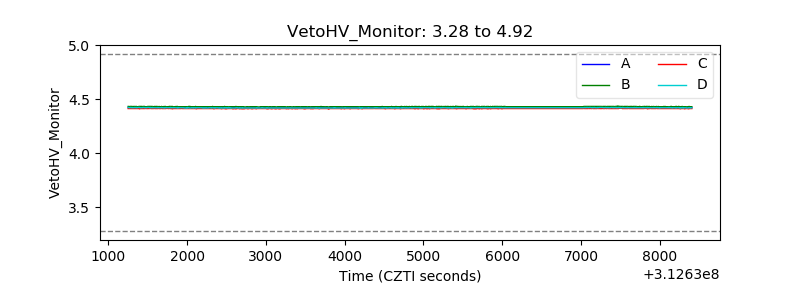 |
| Veto LLD | 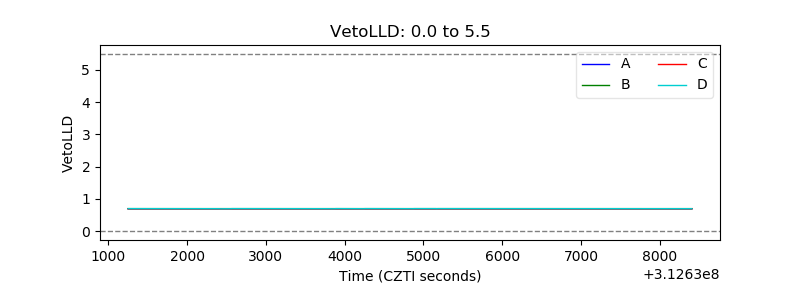 |
| Alpha Counter | 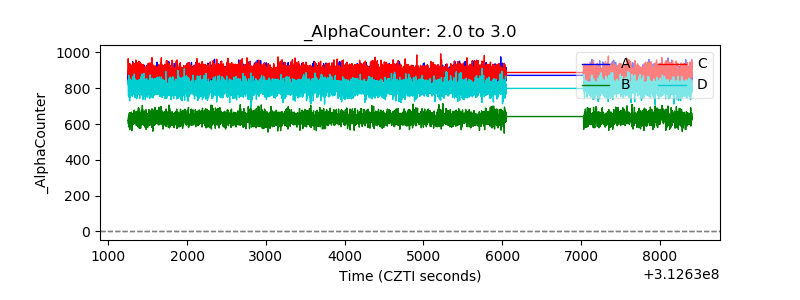 |
| _CPM_Rate | 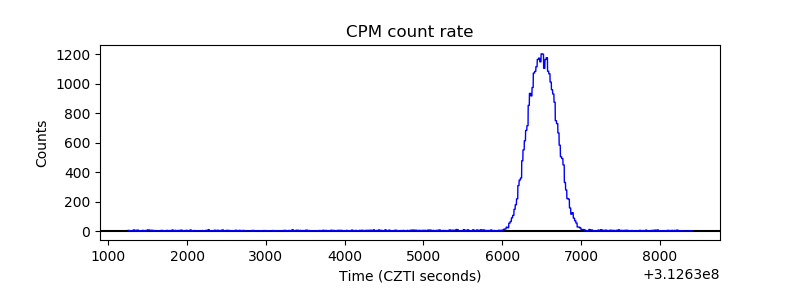 |
| CZT Counter | 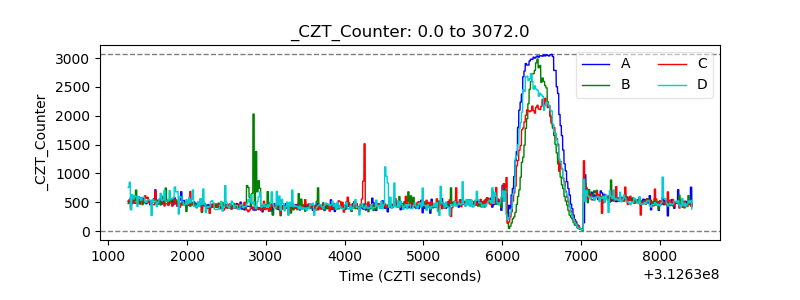 |
| +2.5 Volts monitor |  |
| +5 Volts monitor |  |
| _ROLL_ROT | 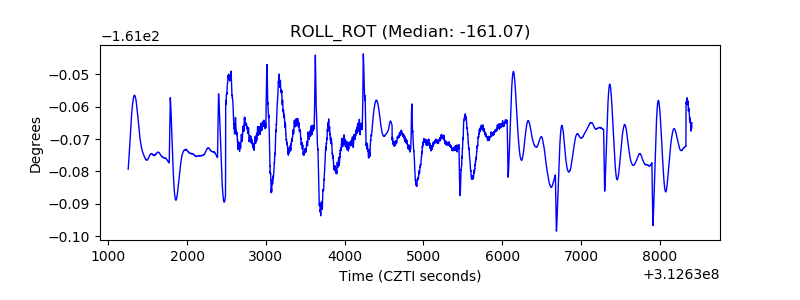 |
| _Roll_DEC | 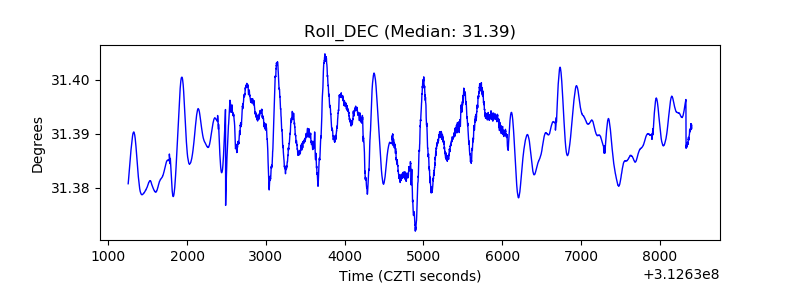 |
| _Roll_RA | 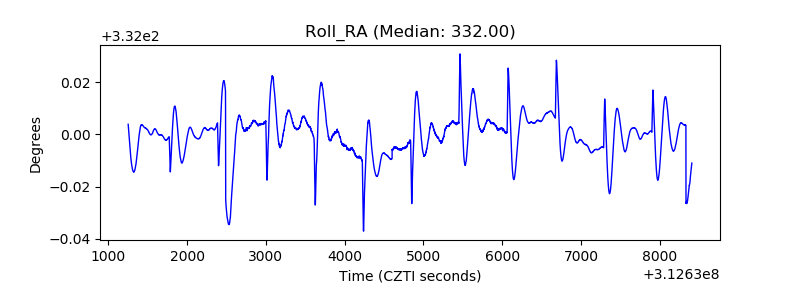 |
| Veto Counter | 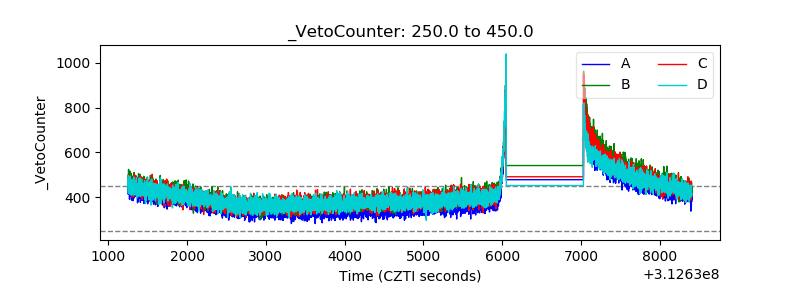 |