| Param | Original file | Final file |
|---|---|---|
| Filename | modeM0/AS1A07_049T01_9000003344_22535cztM0_level2.evt | modeM0/AS1A07_049T01_9000003344_22535cztM0_level2_quad_clean.evt |
| Size (bytes) | 429,036,480 | 98,164,800 |
| Size | 409.2 MB | 93.6 MB |
| Events in quadrant A | 3,086,240 | 654,617 |
| Events in quadrant B | 3,268,935 | 658,631 |
| Events in quadrant C | 3,106,982 | 615,638 |
| Events in quadrant D | 3,107,170 | 608,647 |
| Mode M0 | |||
|---|---|---|---|
| Quadrant | BADHDUFLAG | Total packets | Discarded packets |
| A | 0 | 13102 | 1 |
| B | 0 | 13678 | 1 |
| C | 0 | 13077 | 1 |
| D | 0 | 13232 | 1 |
| Mode M9 | |||
|---|---|---|---|
| Quadrant | BADHDUFLAG | Total packets | Discarded packets |
| A | 0 | 12 | 0 |
| B | 0 | 12 | 0 |
| C | 0 | 12 | 0 |
| D | 0 | 12 | 0 |
| Mode SS | |||
|---|---|---|---|
| Quadrant | BADHDUFLAG | Total packets | Discarded packets |
| A | 0 | 126 | 0 |
| B | 0 | 126 | 0 |
| C | 0 | 126 | 0 |
| D | 0 | 126 | 0 |
| Quadrant | Total seconds | Saturated seconds | Saturation percentage |
|---|---|---|---|
| A | 6241 | 50 | 0.801154% |
| B | 6242 | 69 | 1.105415% |
| C | 6242 | 79 | 1.265620% |
| D | 6242 | 46 | 0.736943% |
Noise dominated data is calculated using 1-second bins in cleaned event files. If a bin has >2000 counts, and if more than 50% of those come from <1% of pixels, then it is considered to be noise-dominated and hence unusable.
| Quadrant | # 1 sec bins | Bins with >0 counts | Bins with >2000 counts | High rate bins dominated by noise | Noise dominated (total time) | Noise dominated (detector-on time) | Marked lightcurve |
|---|---|---|---|---|---|---|---|
| A | 7461 | 6241 | 0 | 0 | 0.00% | 0.00% | 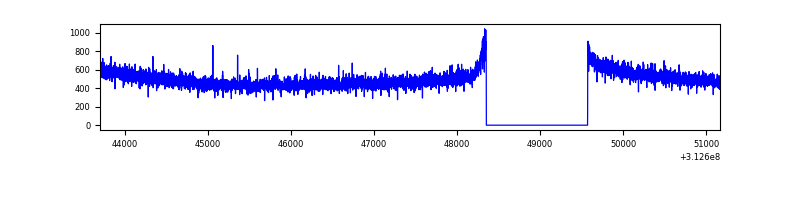 |
| B | 7462 | 6242 | 5 | 5 | 0.07% | 0.08% | 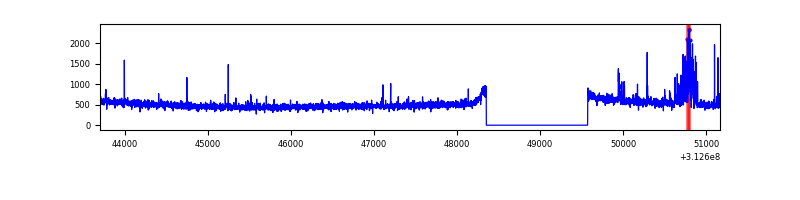 |
| C | 7462 | 6242 | 8 | 8 | 0.11% | 0.13% | 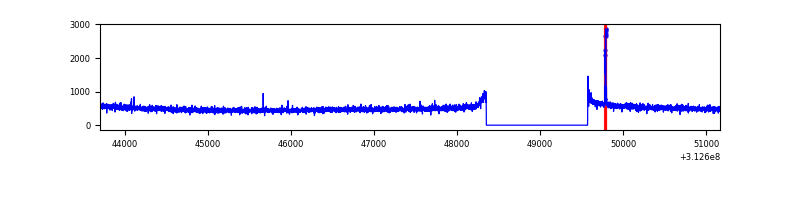 |
| D | 7462 | 6242 | 1 | 1 | 0.01% | 0.02% | 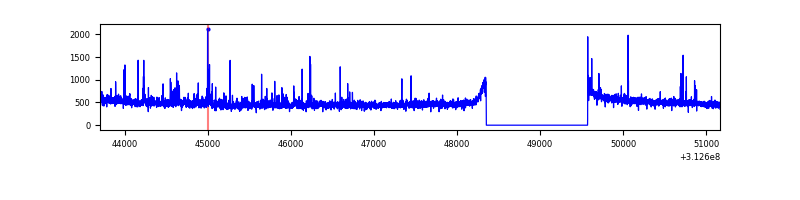 |
Top three noisy pixels from each quadrant. If the there are fewer than three noisy pixels in the level2.evt file, extra rows are filled as -1
| Pixel properties | Quadrant properties | ||||||
|---|---|---|---|---|---|---|---|
| Quadrant | DetID | PixID | Counts | Sigma | Mean | Median | Sigma |
| A | 13 | 254 | 10812 | 63.35 | 799 | 785 | 158.3 |
| A | 3 | 1 | 7624 | 43.21 | 799 | 785 | 158.3 |
| A | 0 | 226 | 6971 | 39.08 | 799 | 785 | 158.3 |
| B | 15 | 33 | 131732 | 886.1 | 791 | 771 | 147.8 |
| B | 12 | 111 | 17176 | 111.0 | 791 | 771 | 147.8 |
| B | 11 | 111 | 15145 | 97.26 | 791 | 771 | 147.8 |
| C | 14 | 238 | 121387 | 687.77 | 758 | 766 | 175.4 |
| C | 10 | 22 | 24744 | 136.72 | 758 | 766 | 175.4 |
| C | 13 | 61 | 5219 | 25.39 | 758 | 766 | 175.4 |
| D | 1 | 52 | 78877 | 415.81 | 777 | 755 | 187.9 |
| D | 13 | 172 | 35970 | 187.44 | 777 | 755 | 187.9 |
| D | 2 | 234 | 23263 | 119.8 | 777 | 755 | 187.9 |
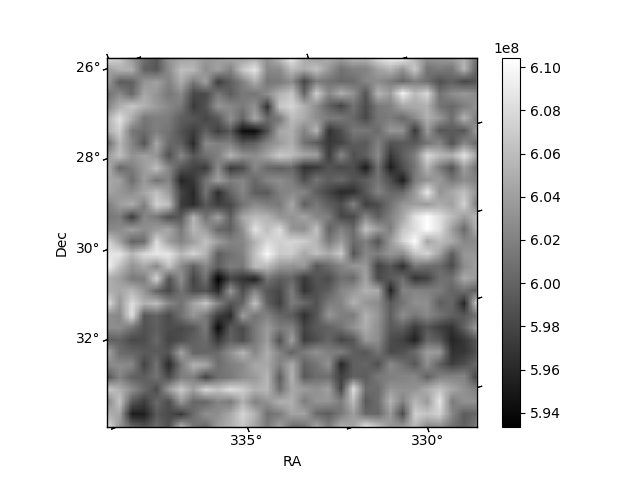
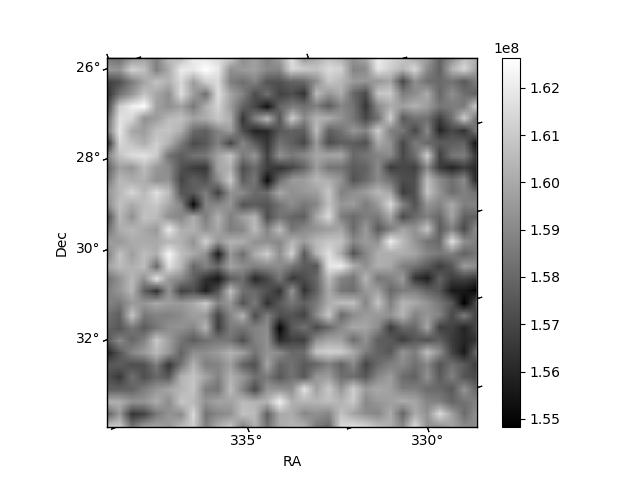
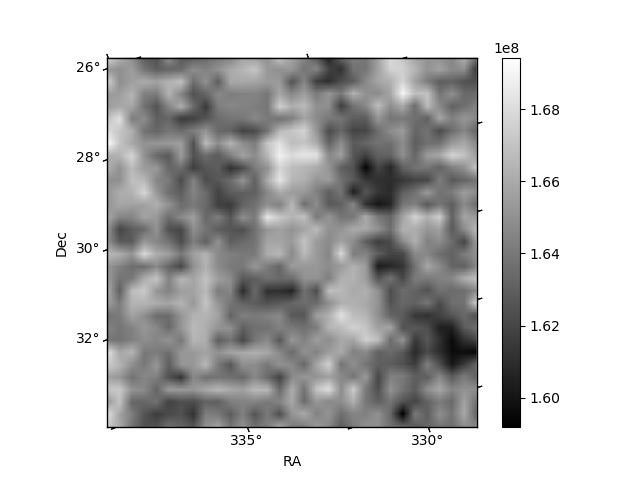
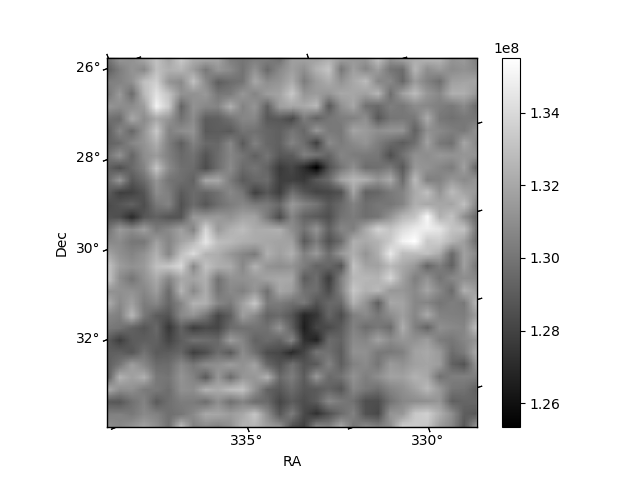
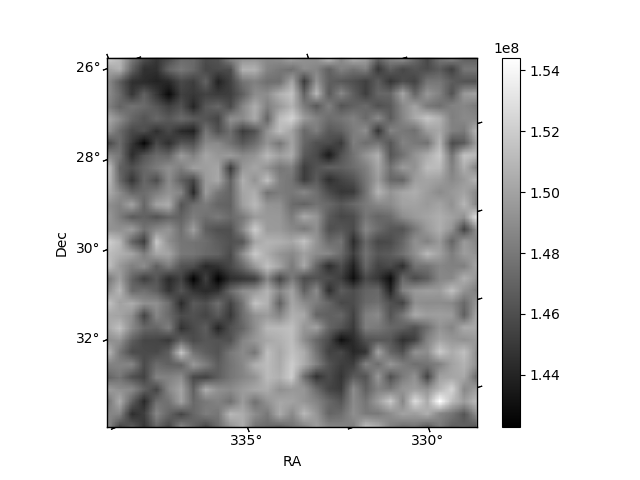
Histogram calculated using DETX and DETY for each event in the final _common_clean file
| Quadrant A |  |
 |
Quadrant B |
|---|---|---|---|
| Quadrant D |  |
 |
Quadrant C |
| Plot type | Count rate plots | Images |
|---|---|---|
| Comparison with Poisson distribution Blue bars denote a histogram of data divided into 1 sec bins. Red curve is a Poisson curve with rate = median count rate of data. |
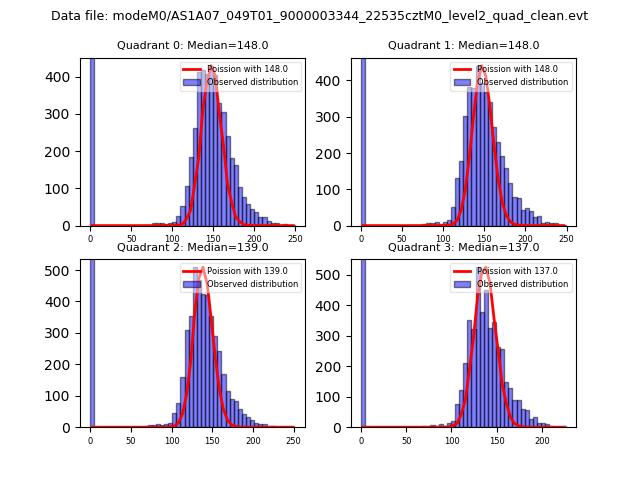 |
 |
| Quadrant-wise count rates Data is divided into 100 sec bins |
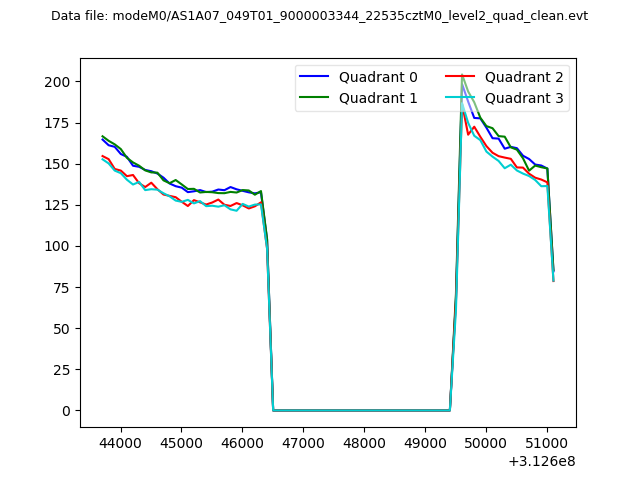 |
|
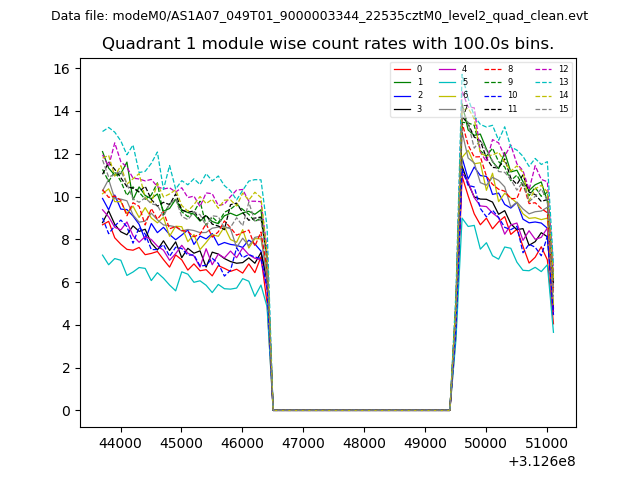
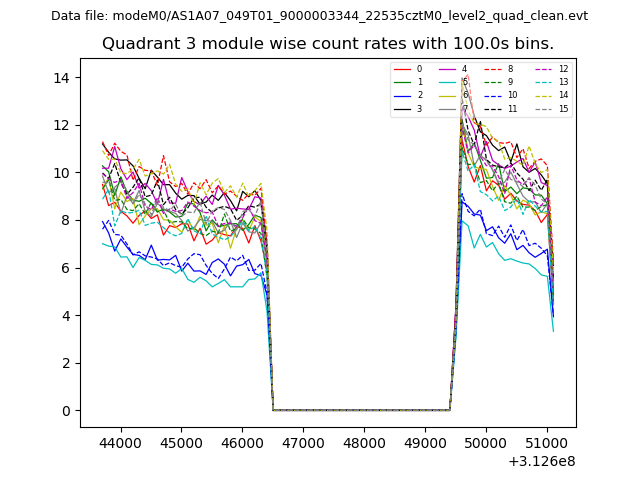
| Module-wise count rates for Quadrant A Data is divided into 100 sec bins |
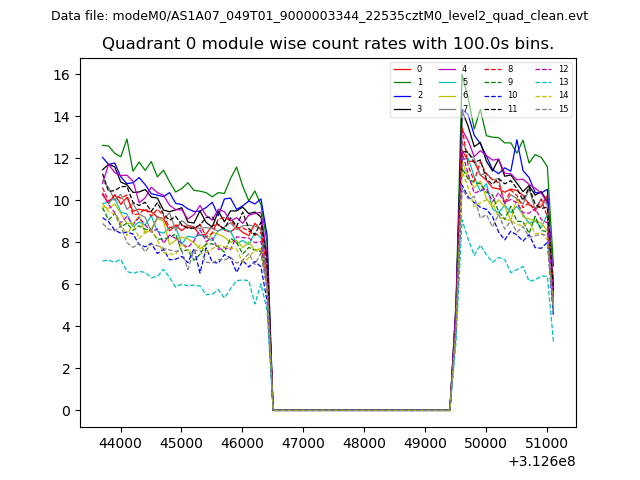 |
 |
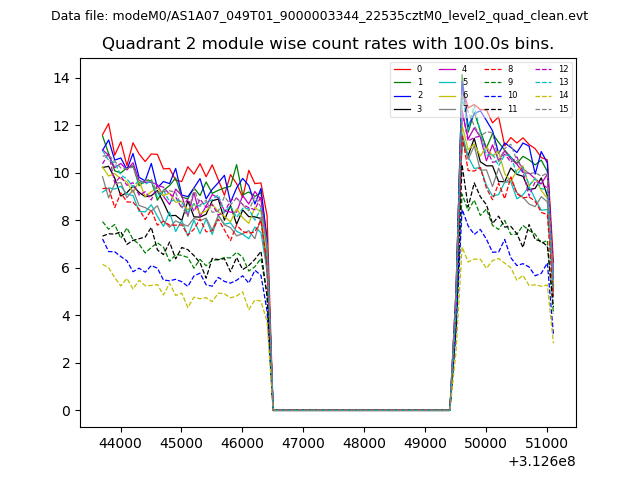
| Module-wise count rates for Quadrant B Data is divided into 100 sec bins |
 |
 |
| Module-wise count rates for Quadrant C Data is divided into 100 sec bins |
 |
 |
| Module-wise count rates for Quadrant D Data is divided into 100 sec bins |
 |
 |
| Parameter | Plot |
|---|---|
| CZT HV Monitor | 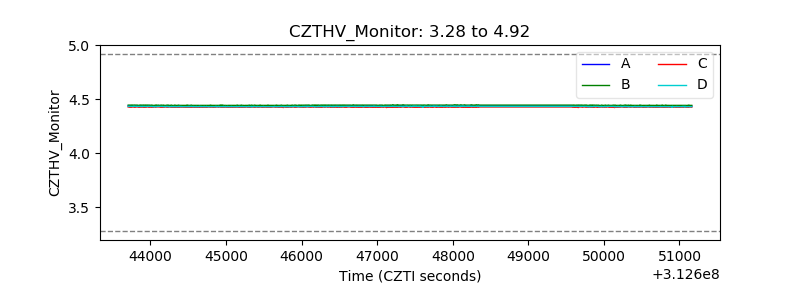 |
| D_VDD | 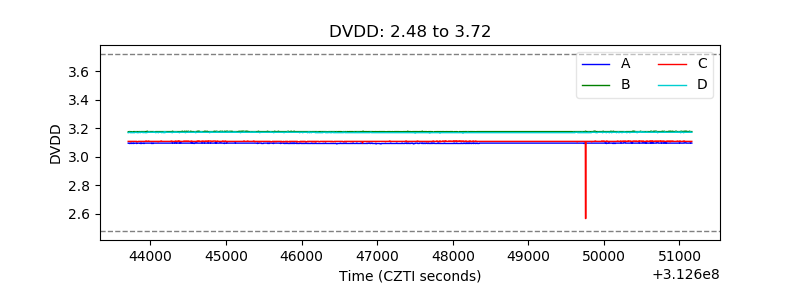 |
| Temperature 1 | 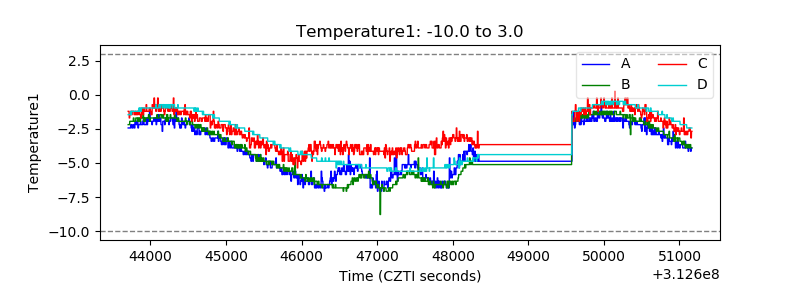 |
| Veto HV Monitor |  |
| Veto LLD | 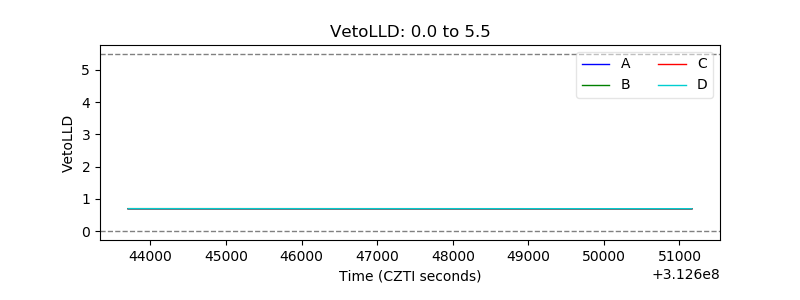 |
| Alpha Counter | 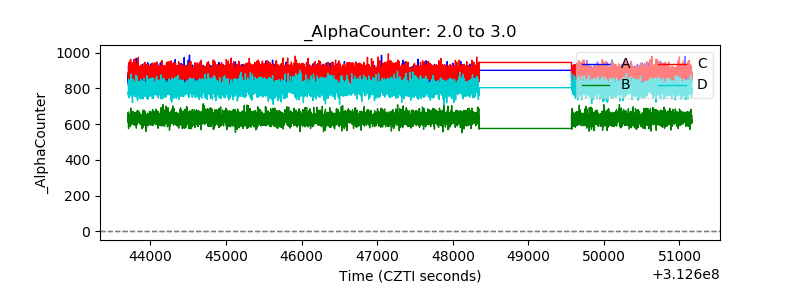 |
| _CPM_Rate | 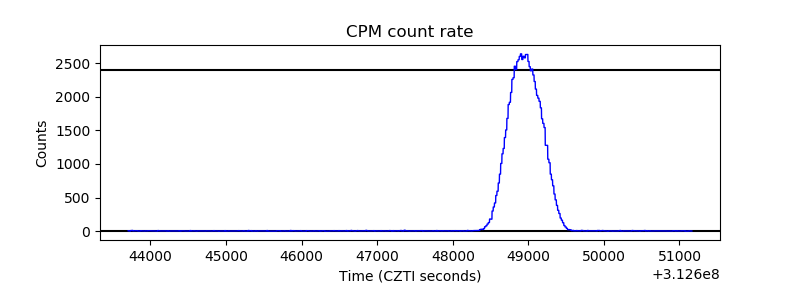 |
| CZT Counter | 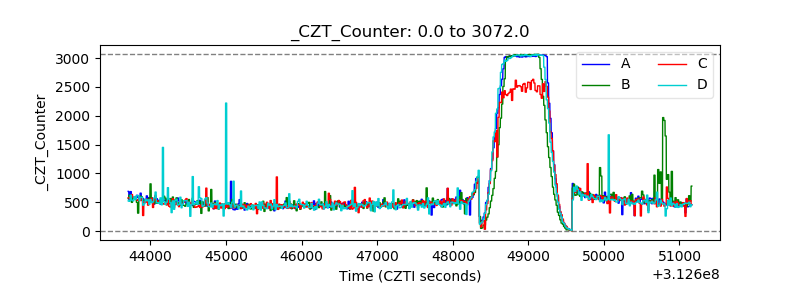 |
| +2.5 Volts monitor |  |
| +5 Volts monitor | 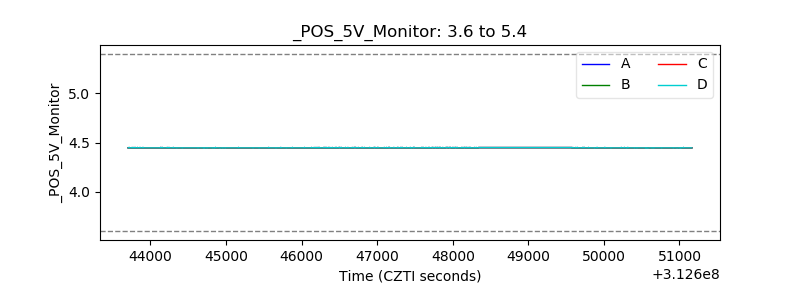 |
| _ROLL_ROT | 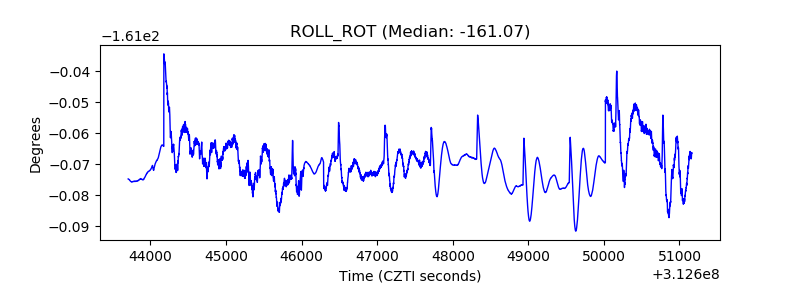 |
| _Roll_DEC |  |
| _Roll_RA | 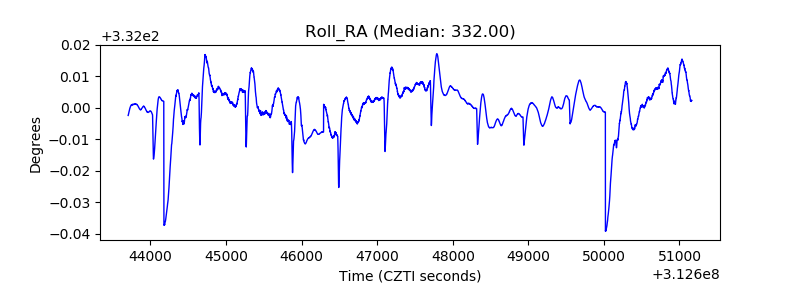 |
| Veto Counter | 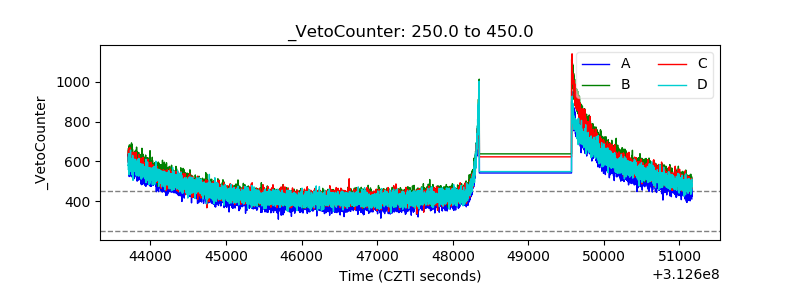 |