| Param | Original file | Final file |
|---|---|---|
| Filename | modeM0/AS1A07_049T01_9000003344_22540cztM0_level2.evt | modeM0/AS1A07_049T01_9000003344_22540cztM0_level2_quad_clean.evt |
| Size (bytes) | 523,739,520 | 86,425,920 |
| Size | 499.5 MB | 82.4 MB |
| Events in quadrant A | 3,301,060 | 539,086 |
| Events in quadrant B | 3,487,836 | 550,136 |
| Events in quadrant C | 3,417,593 | 524,120 |
| Events in quadrant D | 5,168,928 | 504,933 |
| Mode M0 | |||
|---|---|---|---|
| Quadrant | BADHDUFLAG | Total packets | Discarded packets |
| A | 0 | 14602 | 2 |
| B | 0 | 15017 | 3 |
| C | 0 | 14786 | 2 |
| D | 0 | 20123 | 2 |
| Mode M9 | |||
|---|---|---|---|
| Quadrant | BADHDUFLAG | Total packets | Discarded packets |
| A | 0 | 16 | 0 |
| B | 0 | 17 | 0 |
| C | 0 | 17 | 0 |
| D | 0 | 17 | 0 |
| Mode SS | |||
|---|---|---|---|
| Quadrant | BADHDUFLAG | Total packets | Discarded packets |
| A | 0 | 144 | 0 |
| B | 0 | 144 | 0 |
| C | 0 | 144 | 0 |
| D | 0 | 144 | 0 |
| Quadrant | Total seconds | Saturated seconds | Saturation percentage |
|---|---|---|---|
| A | 7170 | 21 | 0.292887% |
| B | 7169 | 65 | 0.906682% |
| C | 7169 | 50 | 0.697447% |
| D | 7169 | 243 | 3.389594% |
Noise dominated data is calculated using 1-second bins in cleaned event files. If a bin has >2000 counts, and if more than 50% of those come from <1% of pixels, then it is considered to be noise-dominated and hence unusable.
| Quadrant | # 1 sec bins | Bins with >0 counts | Bins with >2000 counts | High rate bins dominated by noise | Noise dominated (total time) | Noise dominated (detector-on time) | Marked lightcurve |
|---|---|---|---|---|---|---|---|
| A | 7905 | 7170 | 0 | 0 | 0.00% | 0.00% | 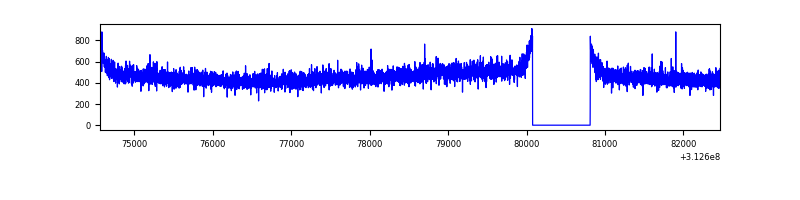 |
| B | 7904 | 7170 | 6 | 6 | 0.08% | 0.08% | 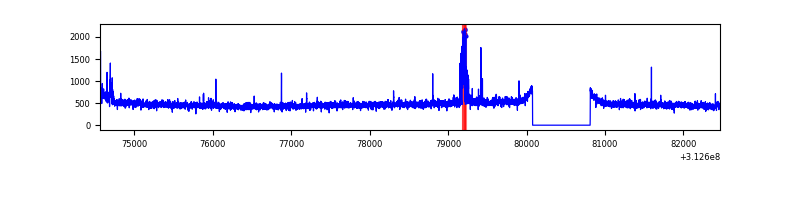 |
| C | 7904 | 7170 | 0 | 0 | 0.00% | 0.00% | 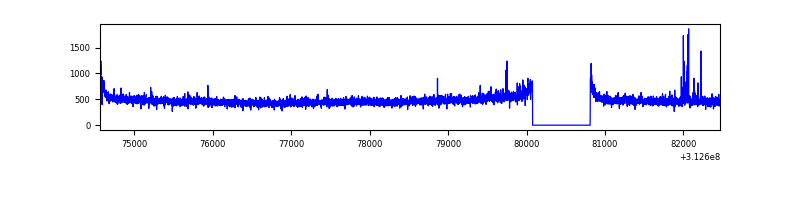 |
| D | 7903 | 7168 | 193 | 193 | 2.44% | 2.69% | 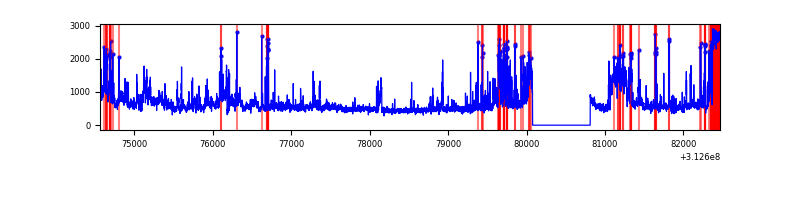 |
Top three noisy pixels from each quadrant. If the there are fewer than three noisy pixels in the level2.evt file, extra rows are filled as -1
| Pixel properties | Quadrant properties | ||||||
|---|---|---|---|---|---|---|---|
| Quadrant | DetID | PixID | Counts | Sigma | Mean | Median | Sigma |
| A | 13 | 254 | 11955 | 64.45 | 854 | 835 | 172.5 |
| A | 3 | 137 | 7436 | 38.26 | 854 | 835 | 172.5 |
| A | 0 | 226 | 7368 | 37.87 | 854 | 835 | 172.5 |
| B | 15 | 33 | 96698 | 584.79 | 856 | 832 | 163.9 |
| B | 0 | 229 | 21476 | 125.93 | 856 | 832 | 163.9 |
| B | 12 | 111 | 19851 | 116.02 | 856 | 832 | 163.9 |
| C | 14 | 238 | 130069 | 662.94 | 827 | 834 | 194.9 |
| C | 0 | 207 | 46355 | 233.51 | 827 | 834 | 194.9 |
| C | 0 | 10 | 12561 | 60.16 | 827 | 834 | 194.9 |
| D | 1 | 52 | 1503543 | 7555.94 | 820 | 795 | 198.9 |
| D | 7 | 223 | 316057 | 1585.16 | 820 | 795 | 198.9 |
| D | 2 | 136 | 119951 | 599.13 | 820 | 795 | 198.9 |
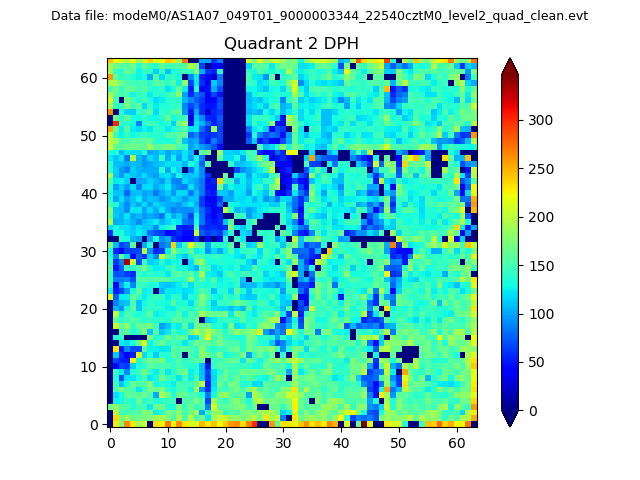
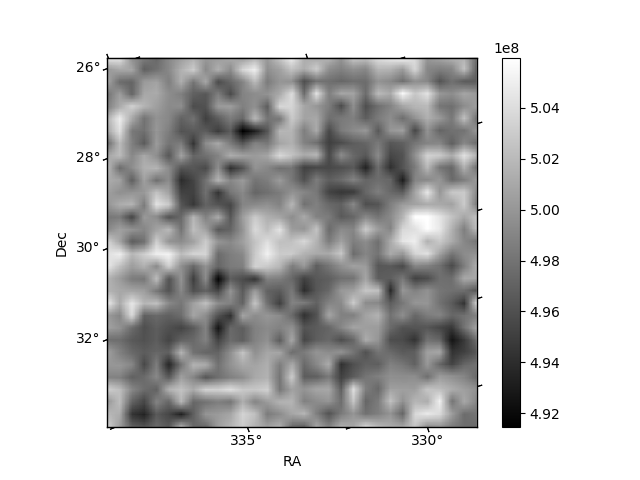
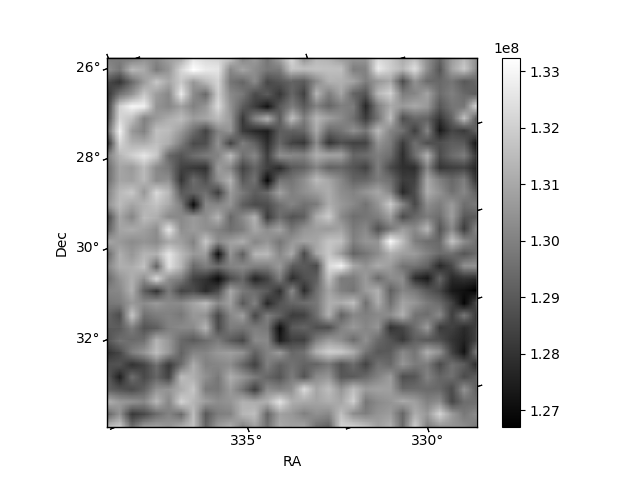
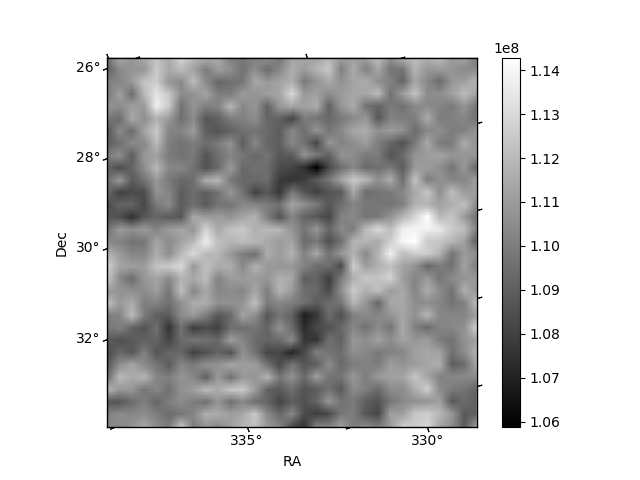
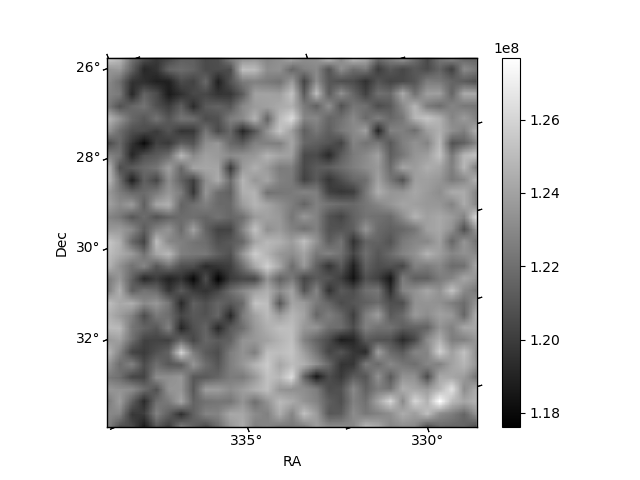
Histogram calculated using DETX and DETY for each event in the final _common_clean file
| Quadrant A | 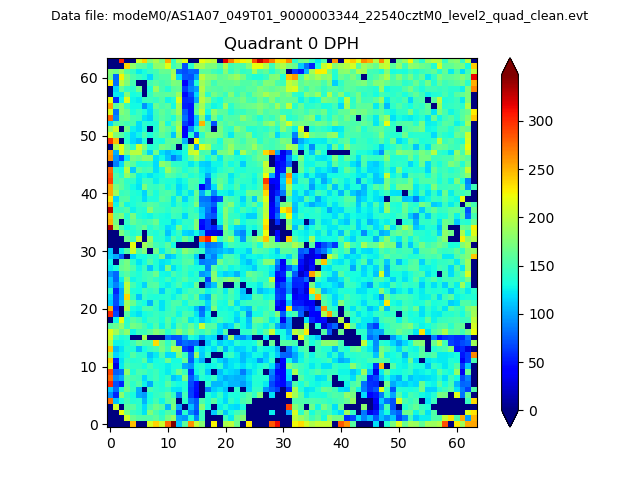 |
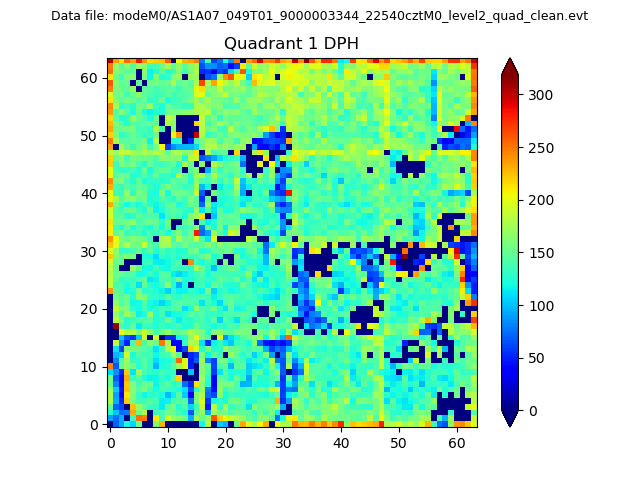 |
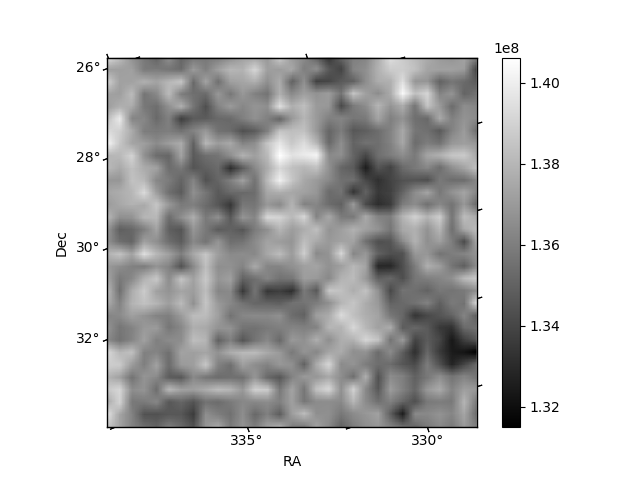
Quadrant B |
|---|---|---|---|
| Quadrant D | 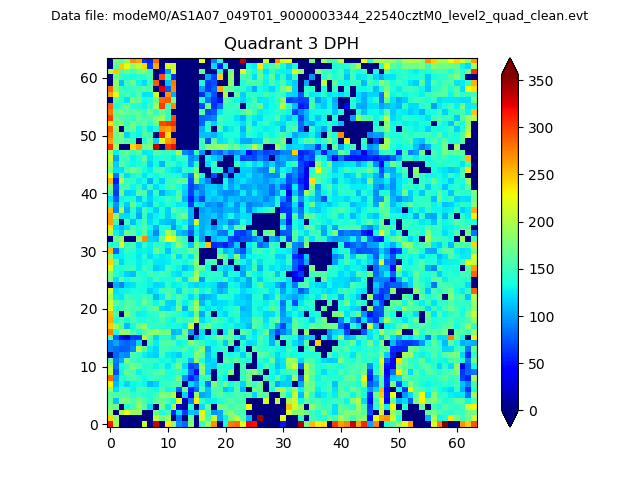 |
 |
Quadrant C |
| Plot type | Count rate plots | Images |
|---|---|---|
| Comparison with Poisson distribution Blue bars denote a histogram of data divided into 1 sec bins. Red curve is a Poisson curve with rate = median count rate of data. |
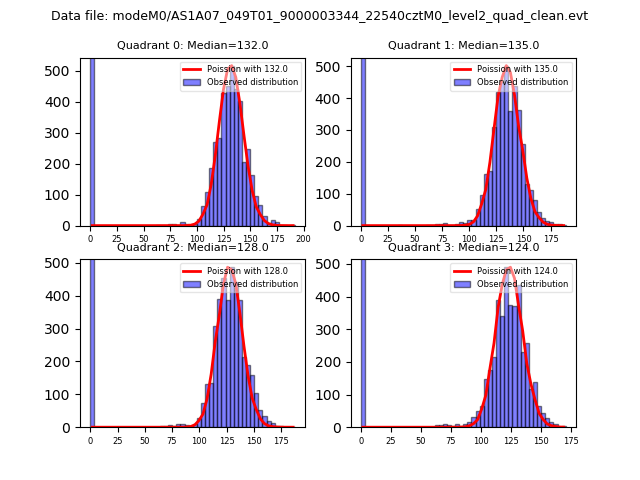 |
 |
| Quadrant-wise count rates Data is divided into 100 sec bins |
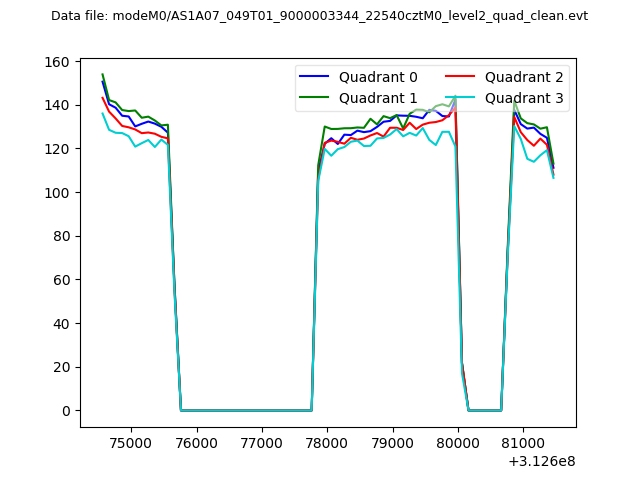 |
|
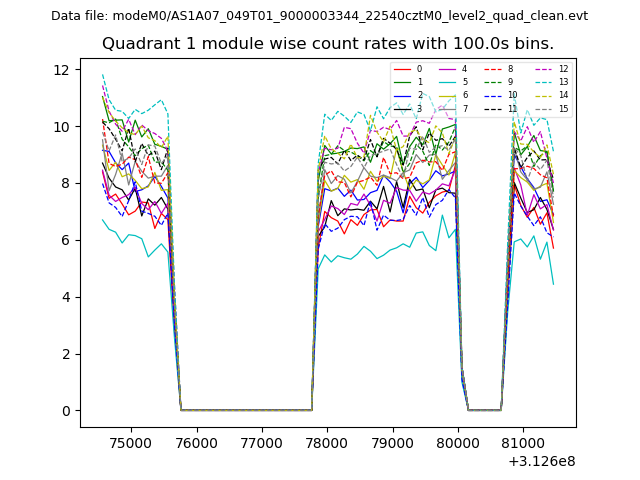
| Module-wise count rates for Quadrant A Data is divided into 100 sec bins |
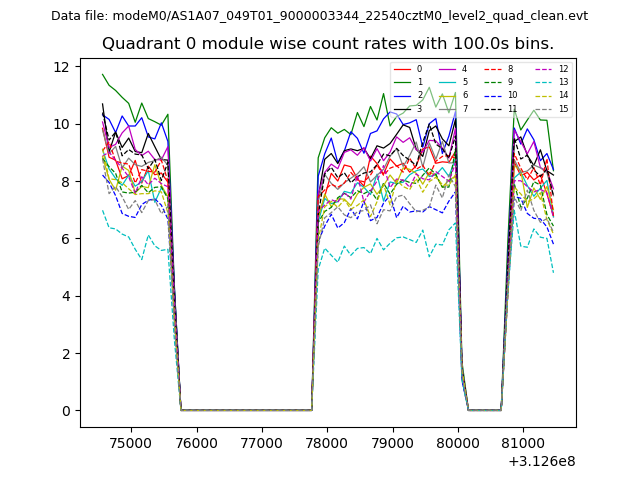 |
 |
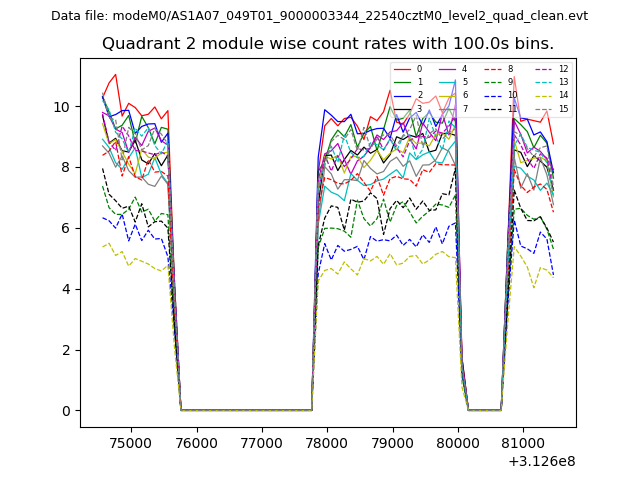
| Module-wise count rates for Quadrant B Data is divided into 100 sec bins |
 |
 |
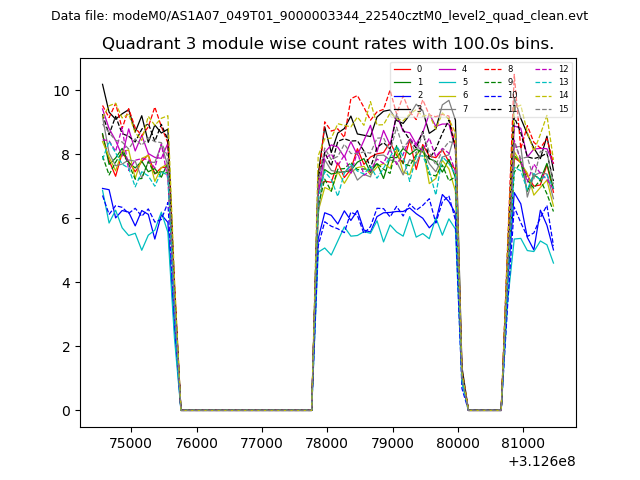
| Module-wise count rates for Quadrant C Data is divided into 100 sec bins |
 |
 |
| Module-wise count rates for Quadrant D Data is divided into 100 sec bins |
 |
 |
| Parameter | Plot |
|---|---|
| CZT HV Monitor | 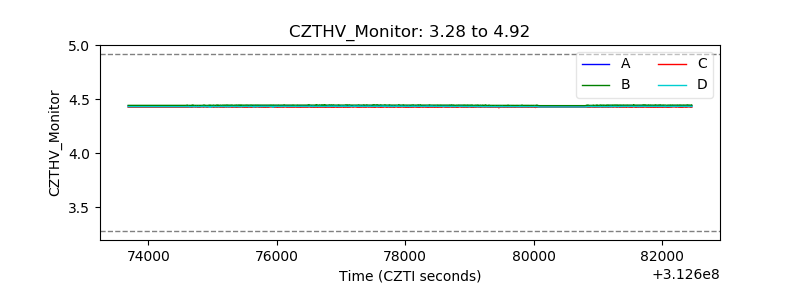 |
| D_VDD | 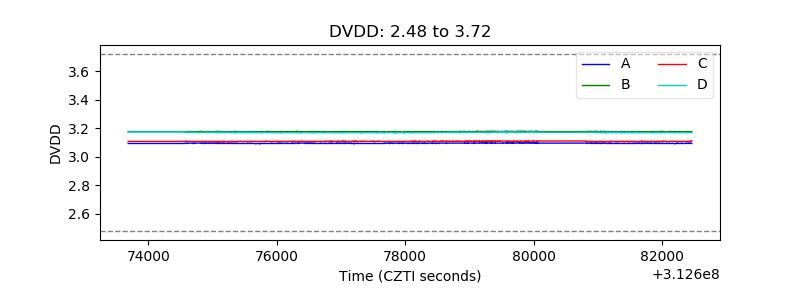 |
| Temperature 1 | 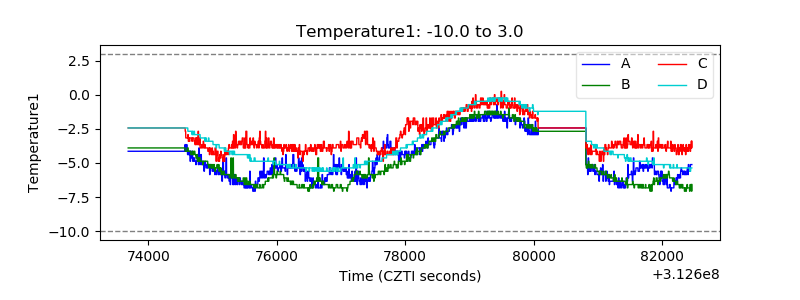 |
| Veto HV Monitor | 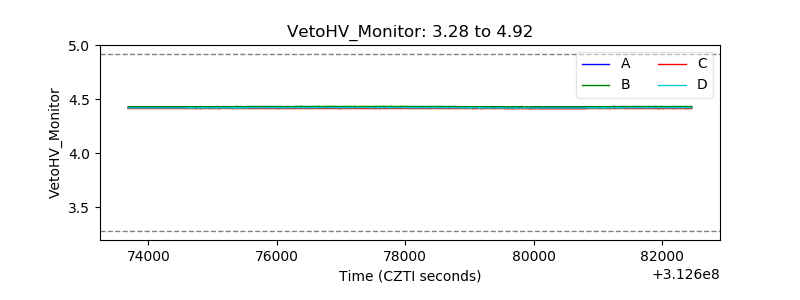 |
| Veto LLD | 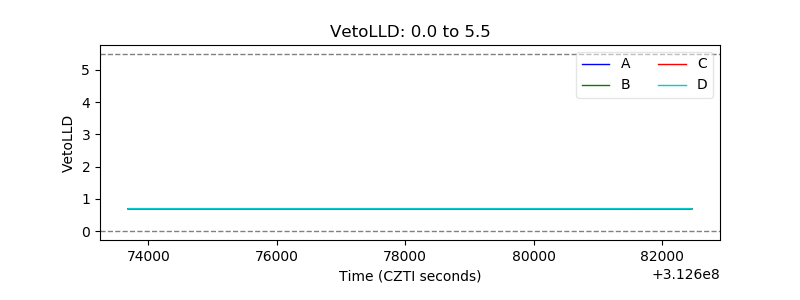 |
| Alpha Counter | 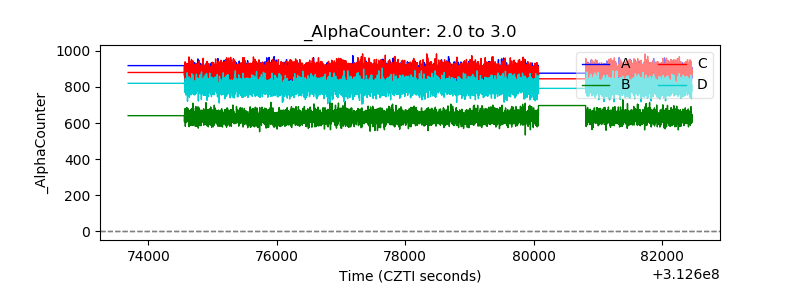 |
| _CPM_Rate | 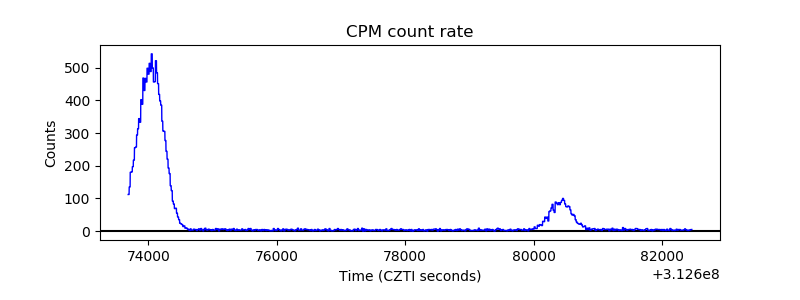 |
| CZT Counter | 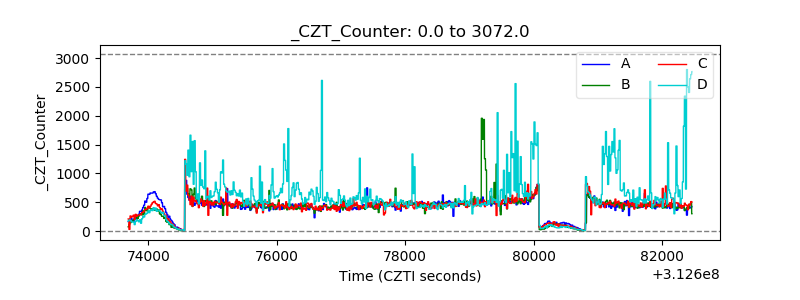 |
| +2.5 Volts monitor |  |
| +5 Volts monitor |  |
| _ROLL_ROT | 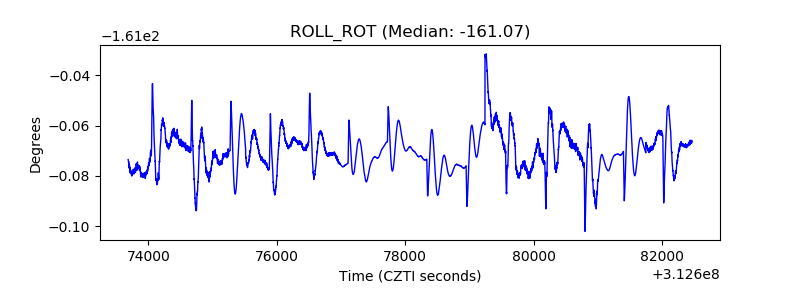 |
| _Roll_DEC | 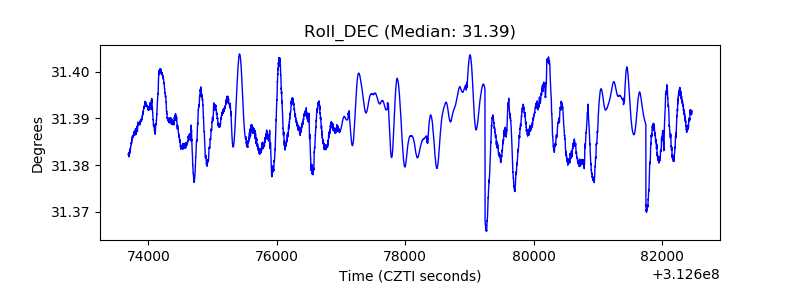 |
| _Roll_RA | 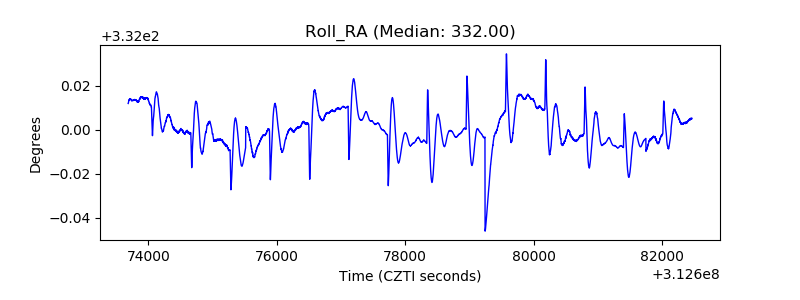 |
| Veto Counter | 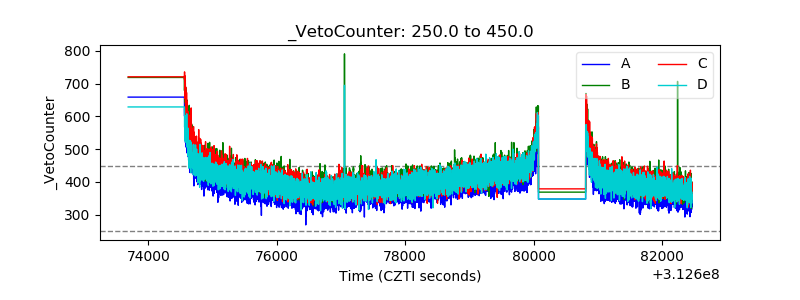 |