| Param | Original file | Final file |
|---|---|---|
| Filename | modeM0/AS1A07_049T01_9000003344_22541cztM0_level2.evt | modeM0/AS1A07_049T01_9000003344_22541cztM0_level2_quad_clean.evt |
| Size (bytes) | 650,160,000 | 85,688,640 |
| Size | 620.0 MB | 81.7 MB |
| Events in quadrant A | 3,471,619 | 532,813 |
| Events in quadrant B | 3,714,464 | 541,104 |
| Events in quadrant C | 3,627,202 | 518,979 |
| Events in quadrant D | 8,371,117 | 482,109 |
| Mode M0 | |||
|---|---|---|---|
| Quadrant | BADHDUFLAG | Total packets | Discarded packets |
| A | 0 | 15344 | 2 |
| B | 0 | 15937 | 2 |
| C | 0 | 15546 | 2 |
| D | 0 | 30004 | 2 |
| Mode M9 | |||
|---|---|---|---|
| Quadrant | BADHDUFLAG | Total packets | Discarded packets |
| A | 0 | 12 | 0 |
| B | 0 | 12 | 0 |
| C | 0 | 12 | 0 |
| D | 0 | 12 | 0 |
| Mode SS | |||
|---|---|---|---|
| Quadrant | BADHDUFLAG | Total packets | Discarded packets |
| A | 0 | 152 | 0 |
| B | 0 | 152 | 0 |
| C | 0 | 152 | 0 |
| D | 0 | 152 | 0 |
| Quadrant | Total seconds | Saturated seconds | Saturation percentage |
|---|---|---|---|
| A | 7470 | 52 | 0.696118% |
| B | 7471 | 101 | 1.351894% |
| C | 7470 | 90 | 1.204819% |
| D | 7470 | 1500 | 20.080321% |
Noise dominated data is calculated using 1-second bins in cleaned event files. If a bin has >2000 counts, and if more than 50% of those come from <1% of pixels, then it is considered to be noise-dominated and hence unusable.
| Quadrant | # 1 sec bins | Bins with >0 counts | Bins with >2000 counts | High rate bins dominated by noise | Noise dominated (total time) | Noise dominated (detector-on time) | Marked lightcurve |
|---|---|---|---|---|---|---|---|
| A | 8605 | 7470 | 0 | 0 | 0.00% | 0.00% | 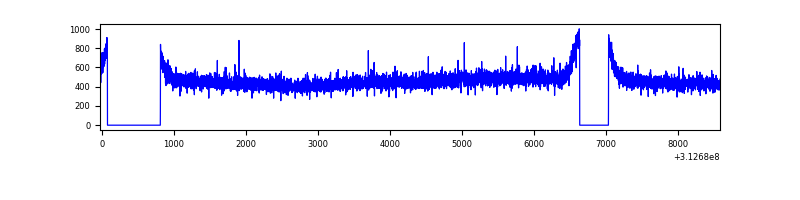 |
| B | 8606 | 7472 | 2 | 2 | 0.02% | 0.03% | 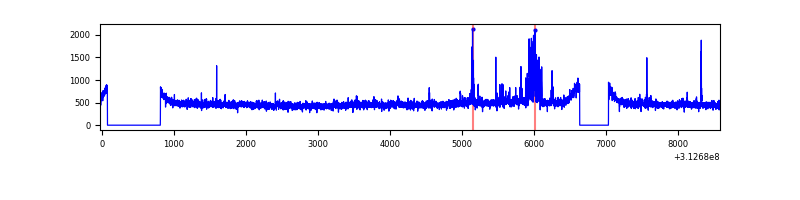 |
| C | 8605 | 7471 | 0 | 0 | 0.00% | 0.00% | 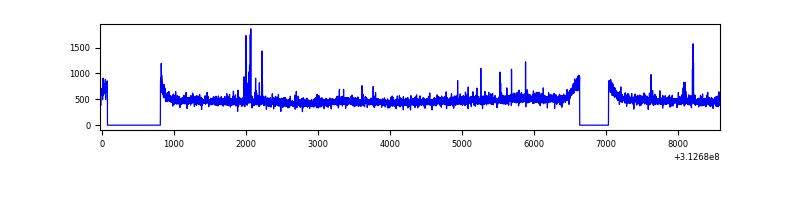 |
| D | 8605 | 7470 | 1430 | 1430 | 16.62% | 19.14% | 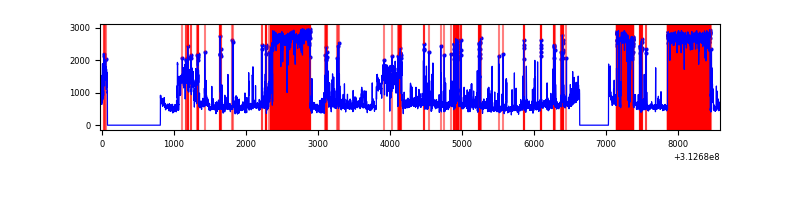 |
Top three noisy pixels from each quadrant. If the there are fewer than three noisy pixels in the level2.evt file, extra rows are filled as -1
| Pixel properties | Quadrant properties | ||||||
|---|---|---|---|---|---|---|---|
| Quadrant | DetID | PixID | Counts | Sigma | Mean | Median | Sigma |
| A | 13 | 254 | 11272 | 57.14 | 899 | 877 | 181.9 |
| A | 3 | 137 | 8026 | 39.3 | 899 | 877 | 181.9 |
| A | 0 | 226 | 7729 | 37.66 | 899 | 877 | 181.9 |
| B | 15 | 33 | 146442 | 836.97 | 900 | 877 | 173.9 |
| B | 12 | 111 | 21345 | 117.69 | 900 | 877 | 173.9 |
| B | 11 | 111 | 18751 | 102.77 | 900 | 877 | 173.9 |
| C | 14 | 238 | 135055 | 648.51 | 871 | 873 | 206.9 |
| C | 0 | 207 | 76811 | 367.01 | 871 | 873 | 206.9 |
| C | 10 | 91 | 9857 | 43.42 | 871 | 873 | 206.9 |
| D | 7 | 223 | 3274887 | 17839.31 | 752 | 730 | 183.5 |
| D | 1 | 52 | 1881253 | 10246.07 | 752 | 730 | 183.5 |
| D | 2 | 136 | 178472 | 968.43 | 752 | 730 | 183.5 |
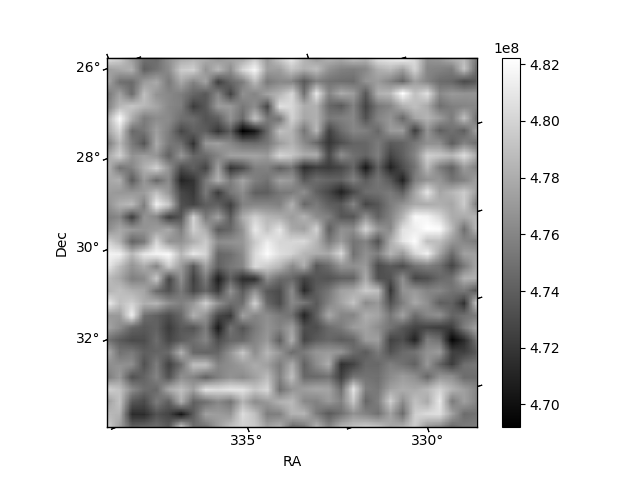
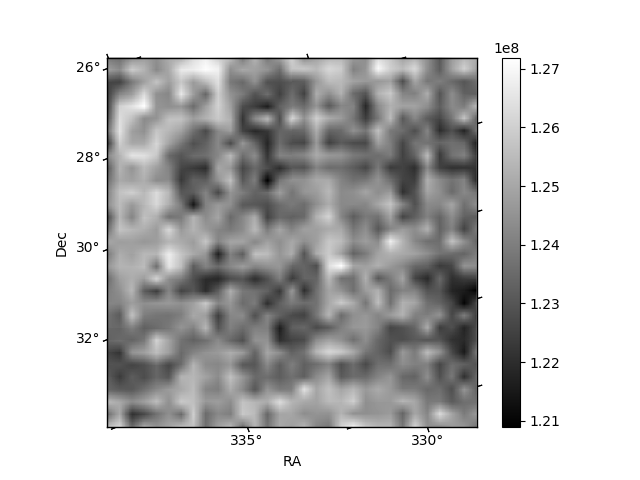
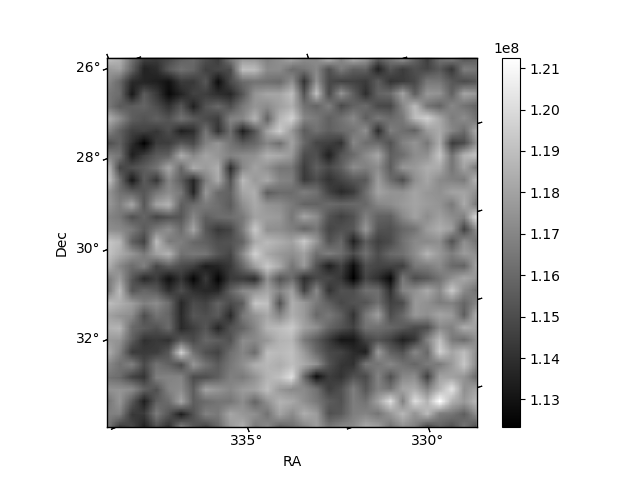
Histogram calculated using DETX and DETY for each event in the final _common_clean file
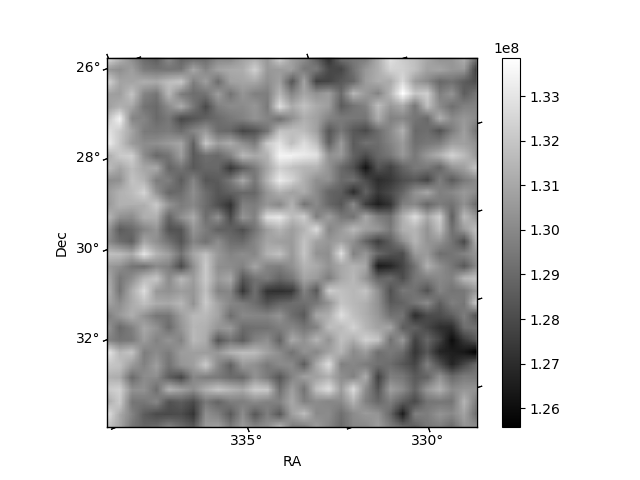
| Quadrant A | 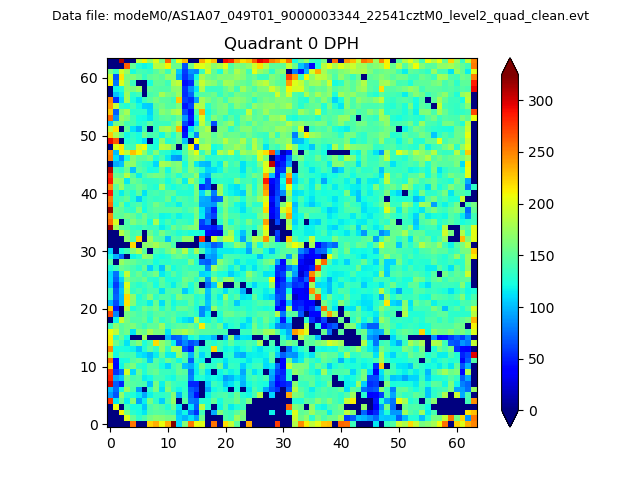 |
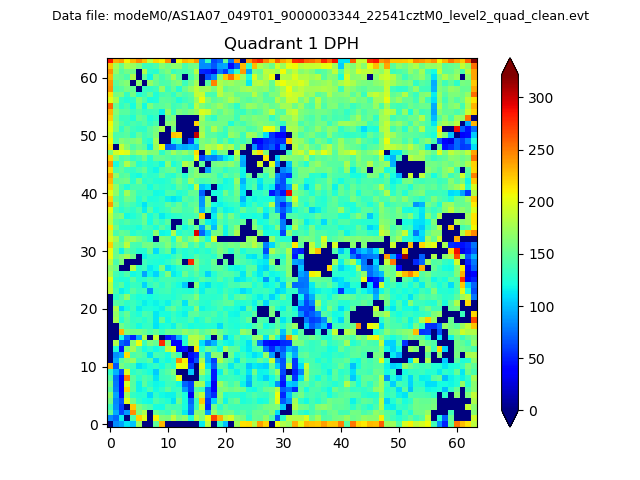 |
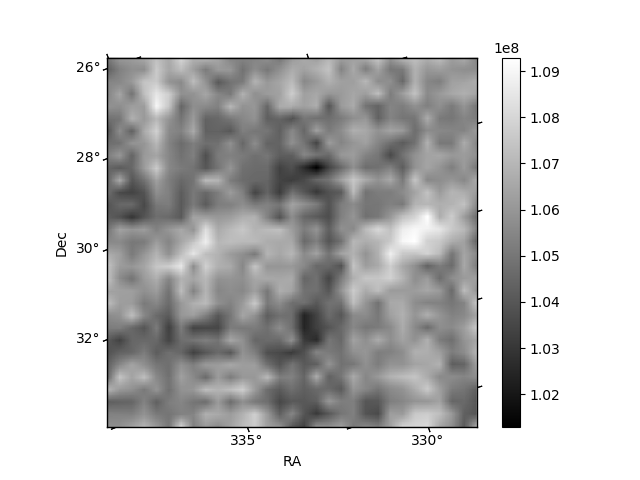
Quadrant B |
|---|---|---|---|
| Quadrant D | 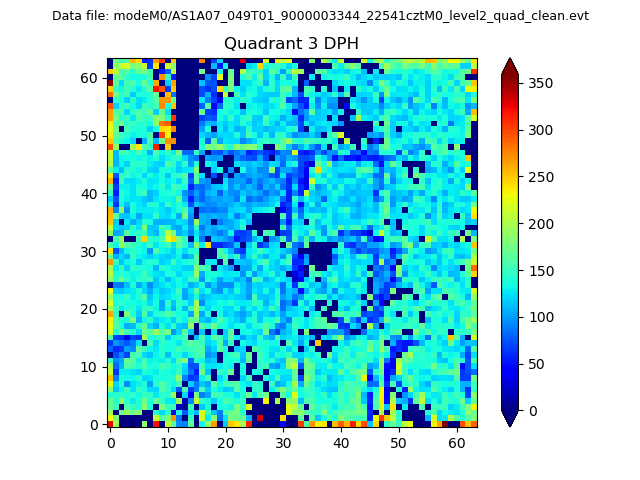 |
 |
Quadrant C |
| Plot type | Count rate plots | Images |
|---|---|---|
| Comparison with Poisson distribution Blue bars denote a histogram of data divided into 1 sec bins. Red curve is a Poisson curve with rate = median count rate of data. |
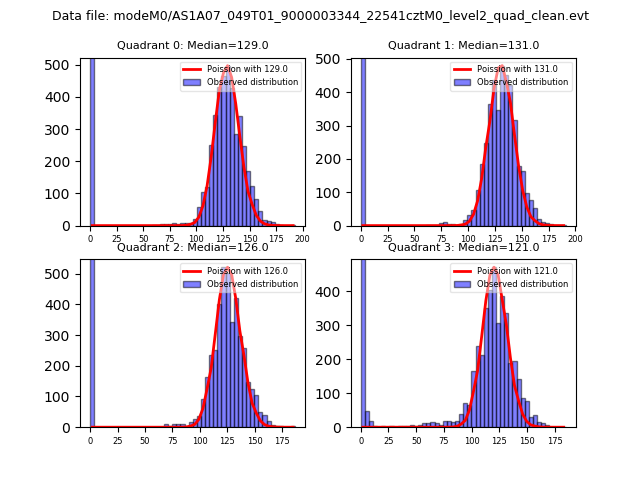 |
 |
| Quadrant-wise count rates Data is divided into 100 sec bins |
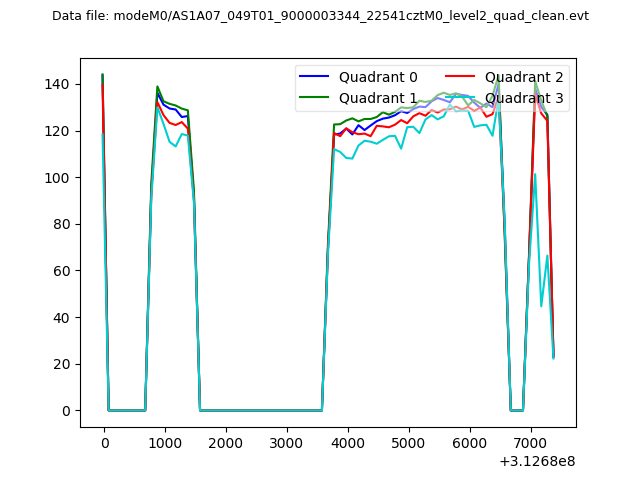 |
|
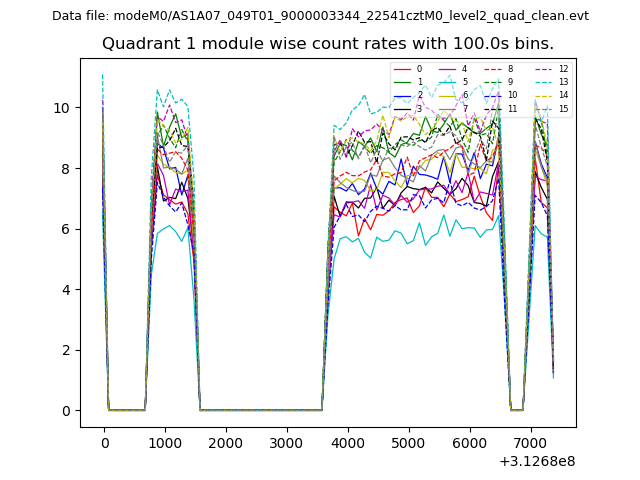
| Module-wise count rates for Quadrant A Data is divided into 100 sec bins |
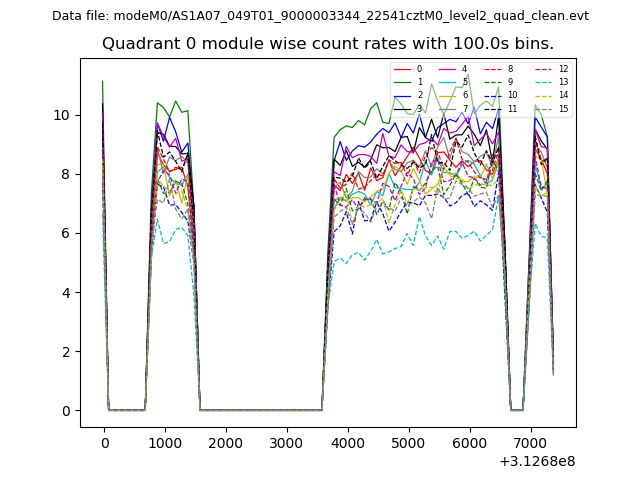 |
 |
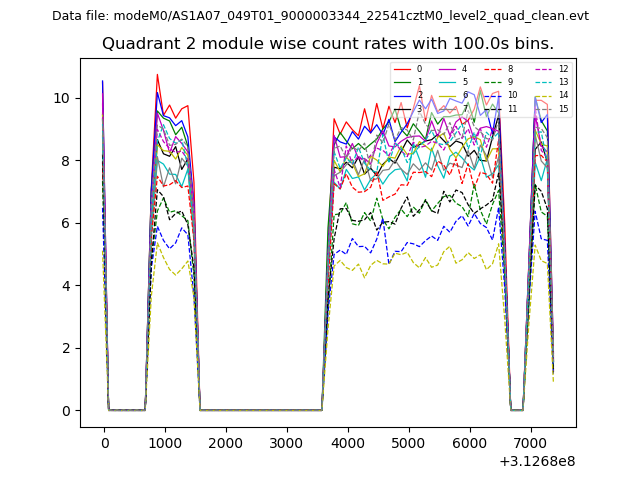
| Module-wise count rates for Quadrant B Data is divided into 100 sec bins |
 |
 |
| Module-wise count rates for Quadrant C Data is divided into 100 sec bins |
 |
 |
| Module-wise count rates for Quadrant D Data is divided into 100 sec bins |
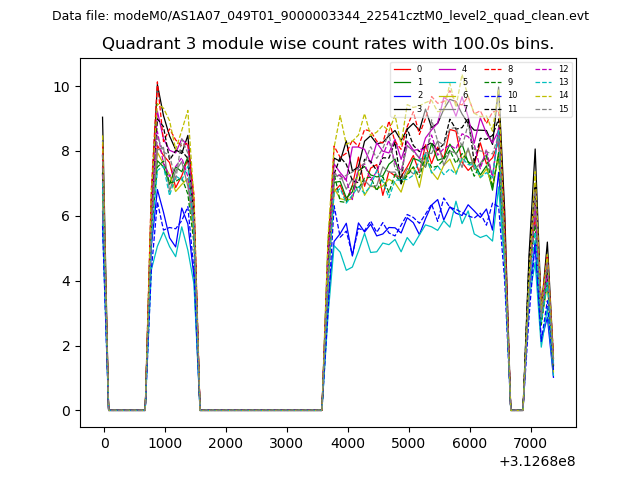 |
 |
| Parameter | Plot |
|---|---|
| CZT HV Monitor | 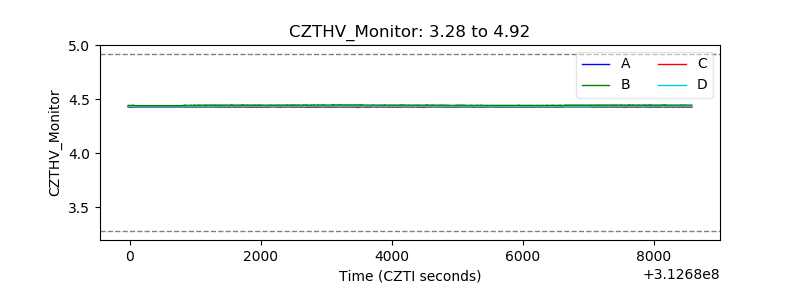 |
| D_VDD | 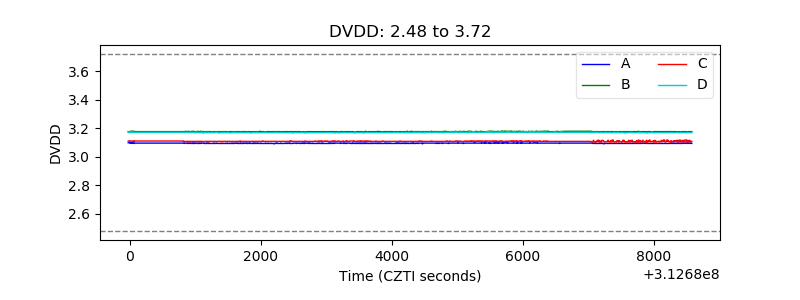 |
| Temperature 1 | 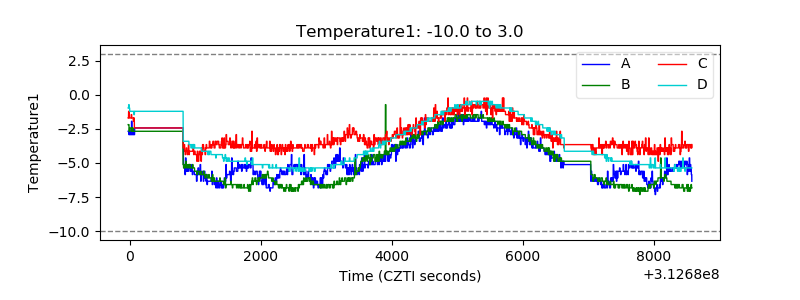 |
| Veto HV Monitor | 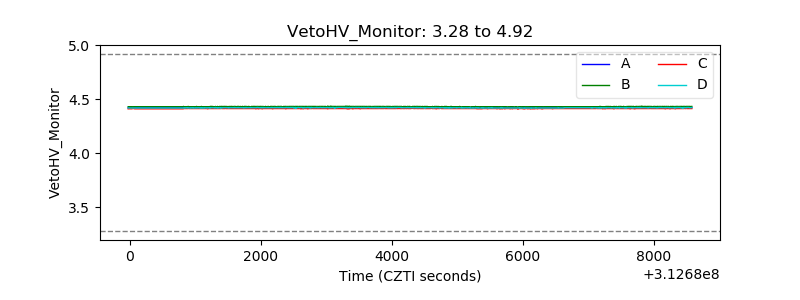 |
| Veto LLD | 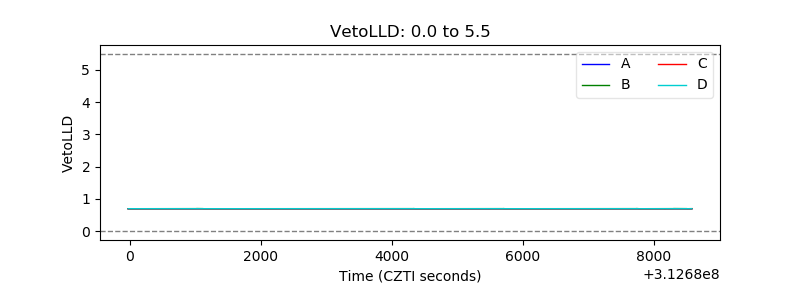 |
| Alpha Counter | 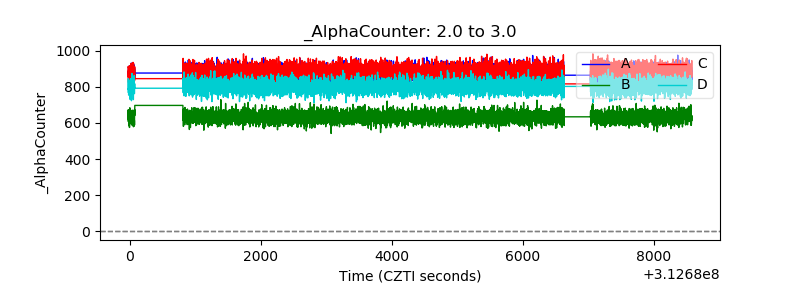 |
| _CPM_Rate | 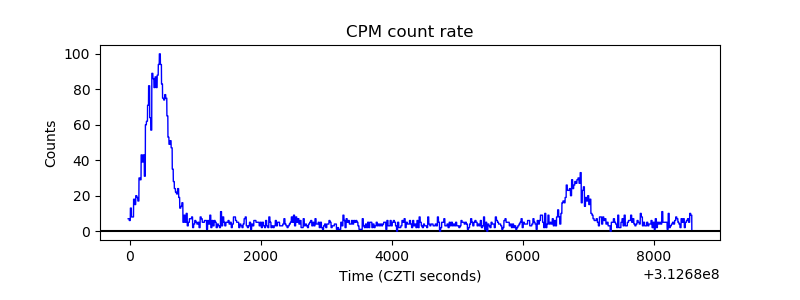 |
| CZT Counter | 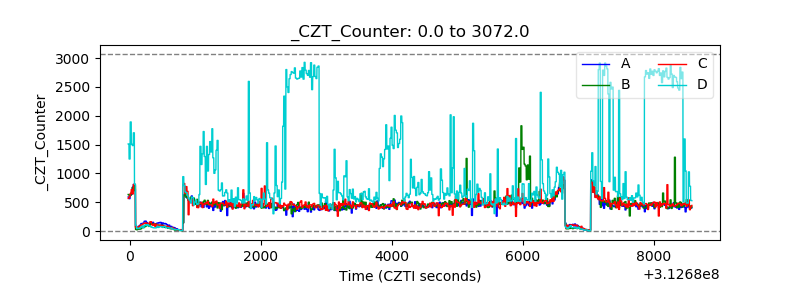 |
| +2.5 Volts monitor |  |
| +5 Volts monitor | 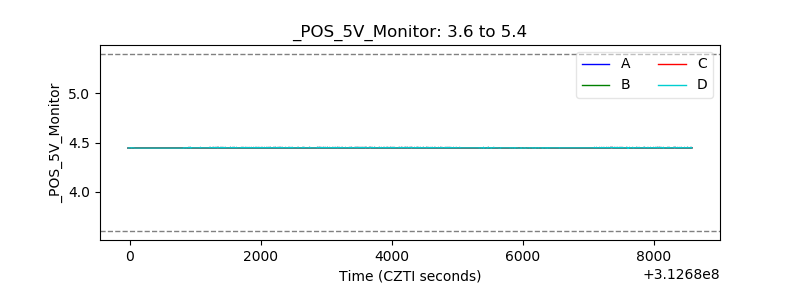 |
| _ROLL_ROT | 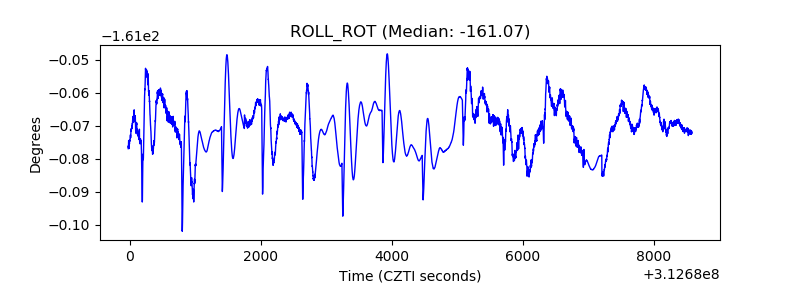 |
| _Roll_DEC |  |
| _Roll_RA | 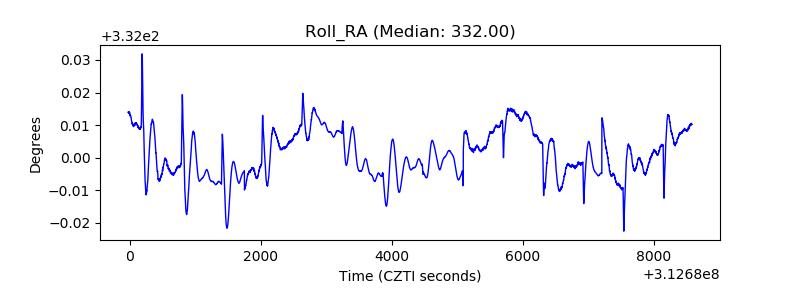 |
| Veto Counter | 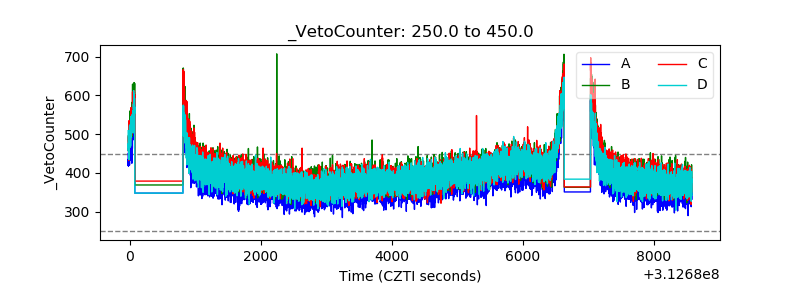 |