| Param | Original file | Final file |
|---|---|---|
| Filename | modeM0/AS1A07_049T01_9000003344_22545cztM0_level2.evt | modeM0/AS1A07_049T01_9000003344_22545cztM0_level2_quad_clean.evt |
| Size (bytes) | 504,892,800 | 57,113,280 |
| Size | 481.5 MB | 54.5 MB |
| Events in quadrant A | 2,240,662 | 363,963 |
| Events in quadrant B | 2,354,684 | 368,279 |
| Events in quadrant C | 2,277,215 | 354,562 |
| Events in quadrant D | 8,079,020 | 292,414 |
| Mode M0 | |||
|---|---|---|---|
| Quadrant | BADHDUFLAG | Total packets | Discarded packets |
| A | 0 | 10030 | 0 |
| B | 0 | 10300 | 0 |
| C | 0 | 10068 | 0 |
| D | 0 | 27294 | 0 |
| Mode SS | |||
|---|---|---|---|
| Quadrant | BADHDUFLAG | Total packets | Discarded packets |
| A | 0 | 100 | 0 |
| B | 0 | 100 | 0 |
| C | 0 | 100 | 0 |
| D | 0 | 100 | 0 |
| Quadrant | Total seconds | Saturated seconds | Saturation percentage |
|---|---|---|---|
| A | 4985 | 2 | 0.040120% |
| B | 4985 | 12 | 0.240722% |
| C | 4985 | 16 | 0.320963% |
| D | 4985 | 2446 | 49.067202% |
Noise dominated data is calculated using 1-second bins in cleaned event files. If a bin has >2000 counts, and if more than 50% of those come from <1% of pixels, then it is considered to be noise-dominated and hence unusable.
| Quadrant | # 1 sec bins | Bins with >0 counts | Bins with >2000 counts | High rate bins dominated by noise | Noise dominated (total time) | Noise dominated (detector-on time) | Marked lightcurve |
|---|---|---|---|---|---|---|---|
| A | 4985 | 4985 | 0 | 0 | 0.00% | 0.00% | 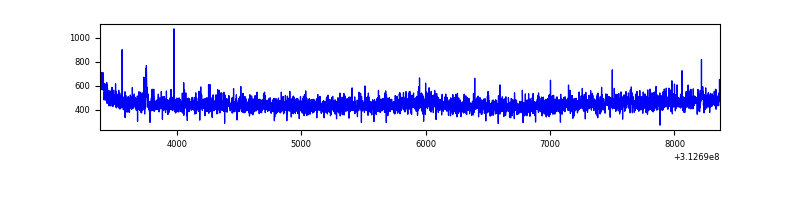 |
| B | 4985 | 4985 | 3 | 3 | 0.06% | 0.06% | 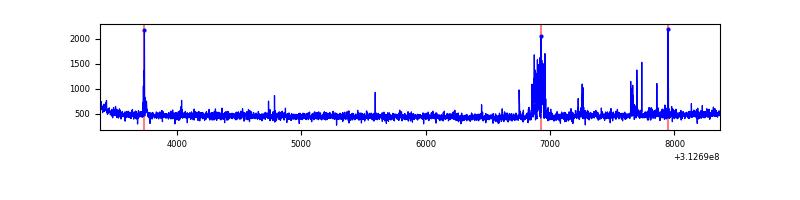 |
| C | 4985 | 4985 | 0 | 0 | 0.00% | 0.00% | 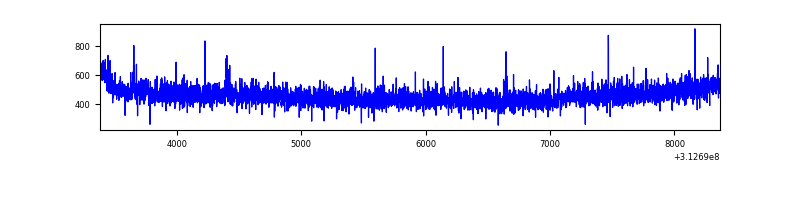 |
| D | 4985 | 4985 | 2444 | 2444 | 49.03% | 49.03% | 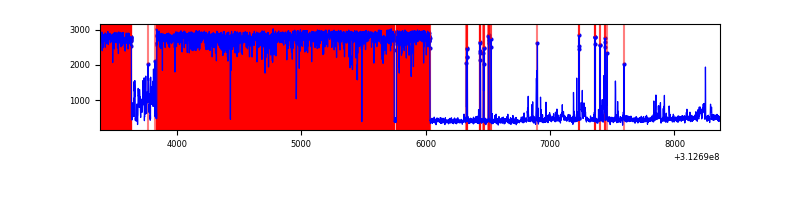 |
Top three noisy pixels from each quadrant. If the there are fewer than three noisy pixels in the level2.evt file, extra rows are filled as -1
| Pixel properties | Quadrant properties | ||||||
|---|---|---|---|---|---|---|---|
| Quadrant | DetID | PixID | Counts | Sigma | Mean | Median | Sigma |
| A | 13 | 254 | 7529 | 58.65 | 578 | 566 | 118.7 |
| A | 11 | 29 | 7061 | 54.71 | 578 | 566 | 118.7 |
| A | 3 | 137 | 5124 | 38.39 | 578 | 566 | 118.7 |
| B | 15 | 33 | 89087 | 786.38 | 576 | 562 | 112.6 |
| B | 12 | 111 | 13692 | 116.64 | 576 | 562 | 112.6 |
| B | 11 | 111 | 12133 | 102.79 | 576 | 562 | 112.6 |
| C | 14 | 238 | 88456 | 666.7 | 555 | 557 | 131.8 |
| C | 0 | 207 | 25361 | 188.14 | 555 | 557 | 131.8 |
| C | 13 | 61 | 3944 | 25.69 | 555 | 557 | 131.8 |
| D | 7 | 223 | 6354164 | 72513.25 | 358 | 347 | 87.6 |
| D | 1 | 52 | 339508 | 3870.69 | 358 | 347 | 87.6 |
| D | 13 | 172 | 19029 | 213.21 | 358 | 347 | 87.6 |
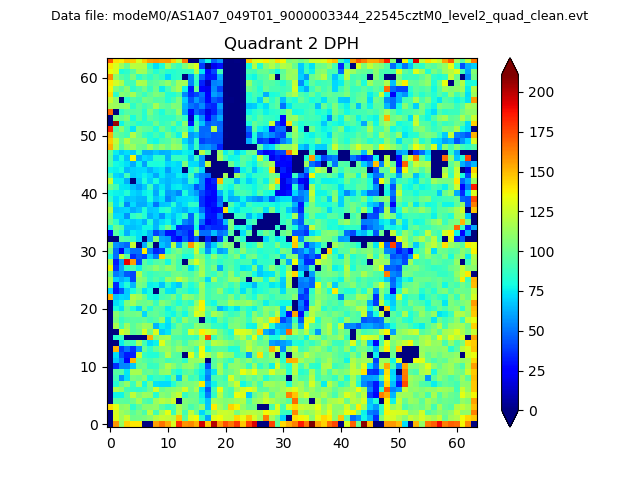
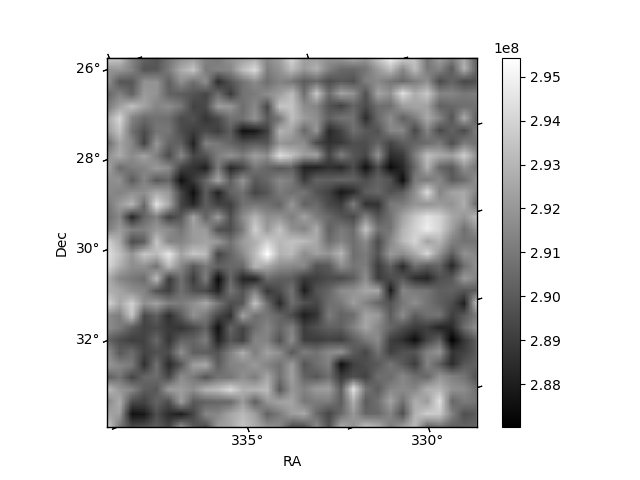
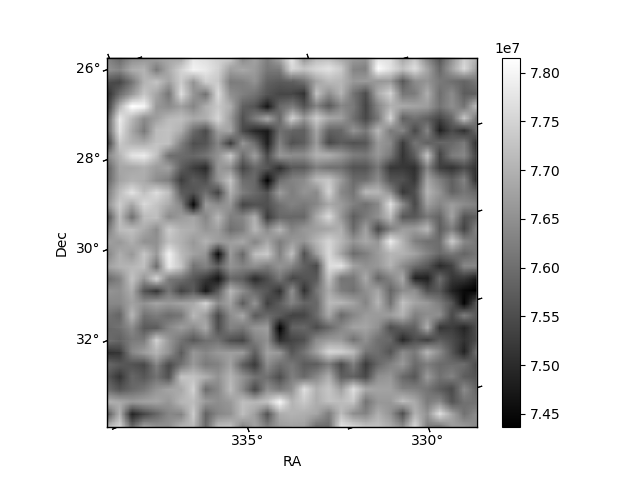
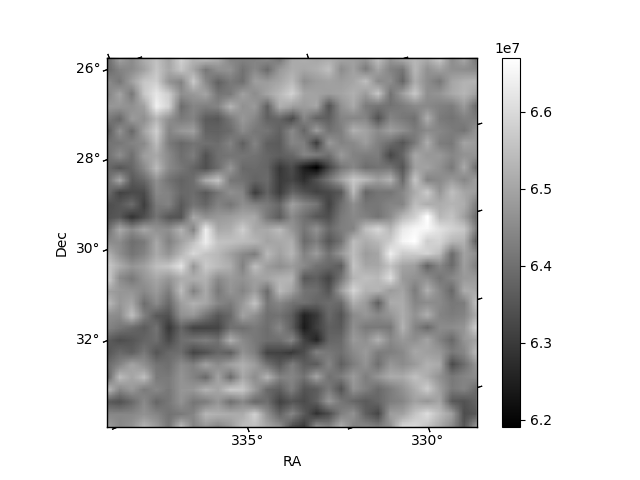
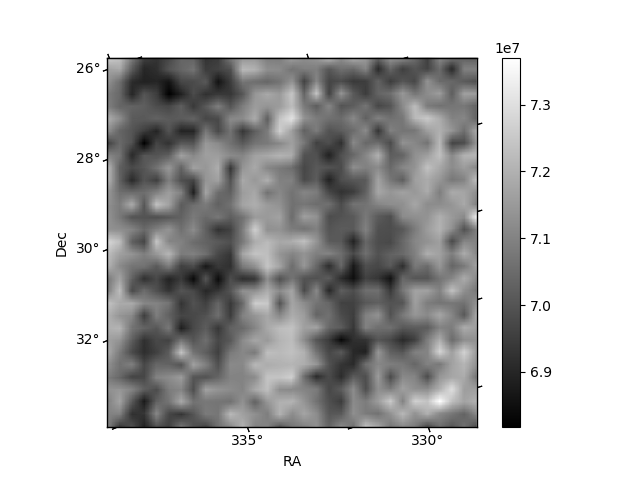
Histogram calculated using DETX and DETY for each event in the final _common_clean file
| Quadrant A | 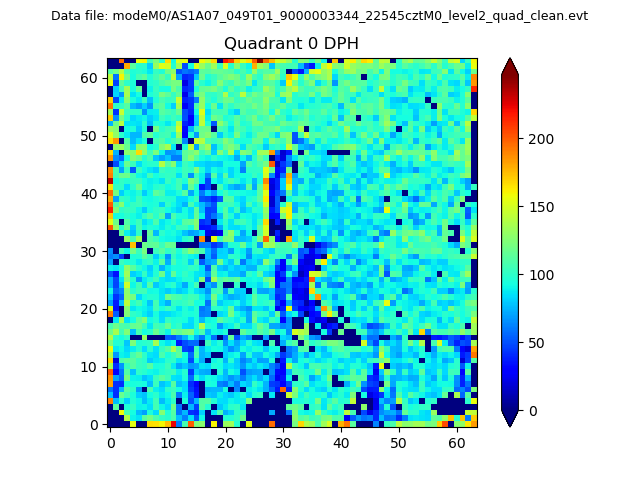 |
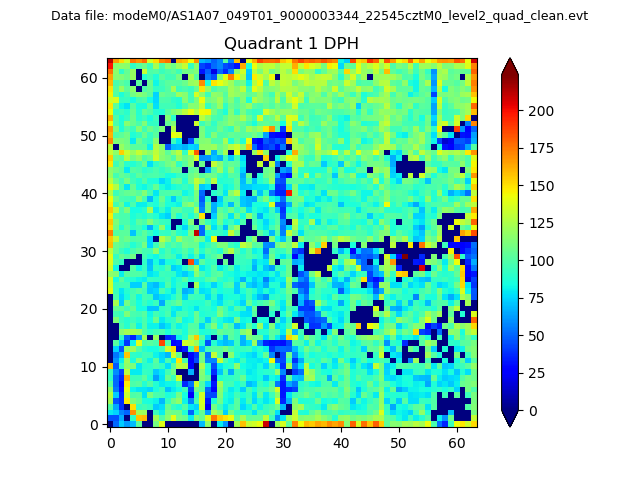 |
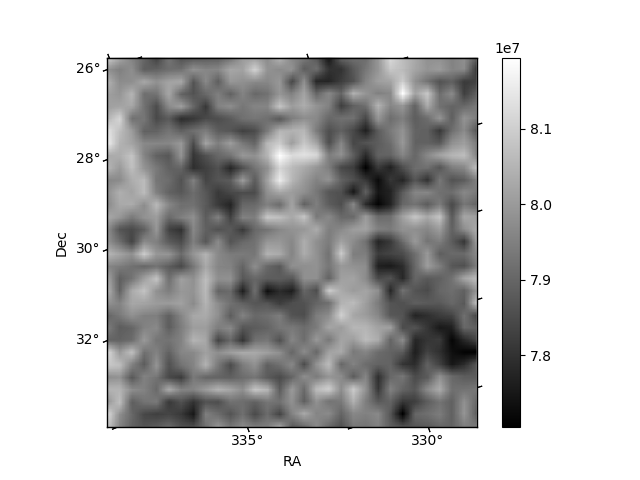
Quadrant B |
|---|---|---|---|
| Quadrant D | 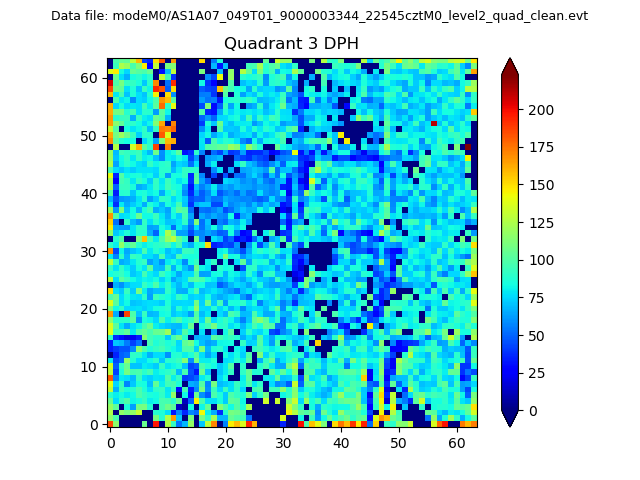 |
 |
Quadrant C |
| Plot type | Count rate plots | Images |
|---|---|---|
| Comparison with Poisson distribution Blue bars denote a histogram of data divided into 1 sec bins. Red curve is a Poisson curve with rate = median count rate of data. |
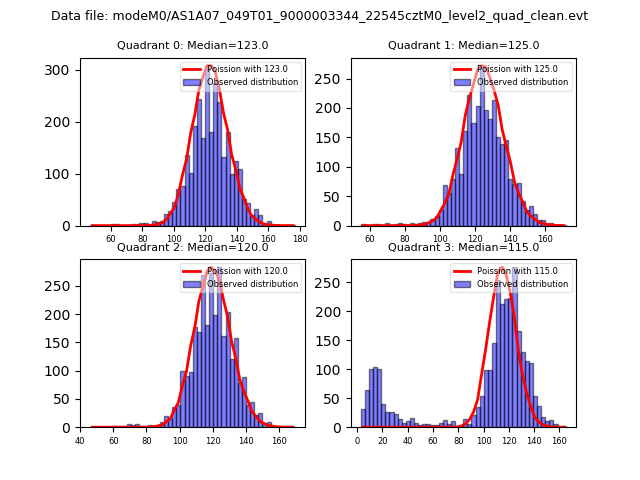 |
 |
| Quadrant-wise count rates Data is divided into 100 sec bins |
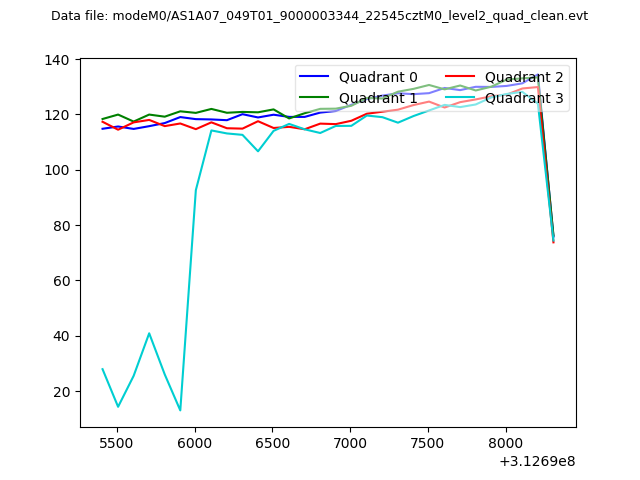 |
|
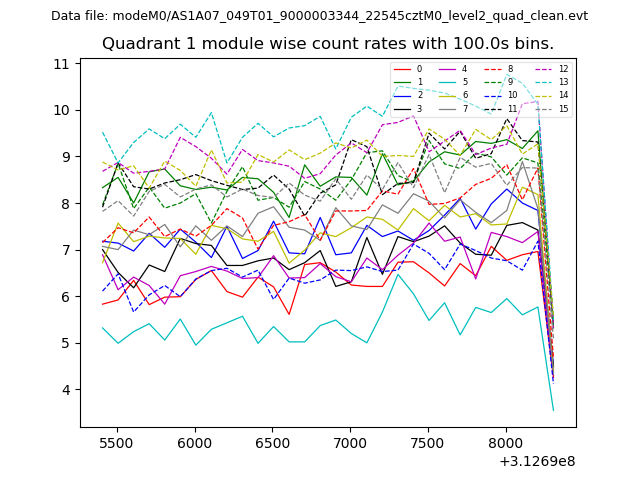
| Module-wise count rates for Quadrant A Data is divided into 100 sec bins |
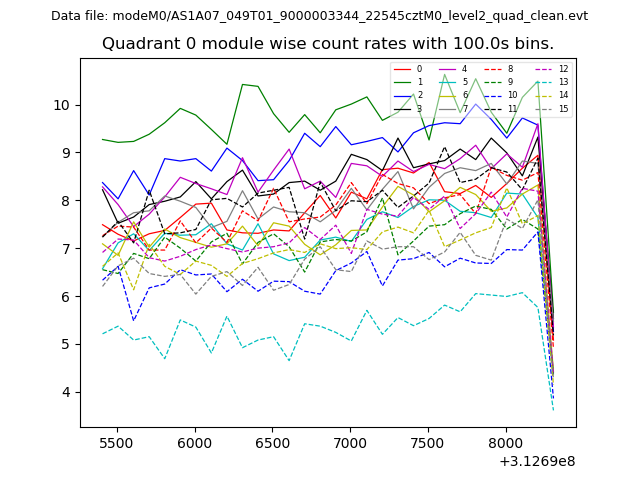 |
 |
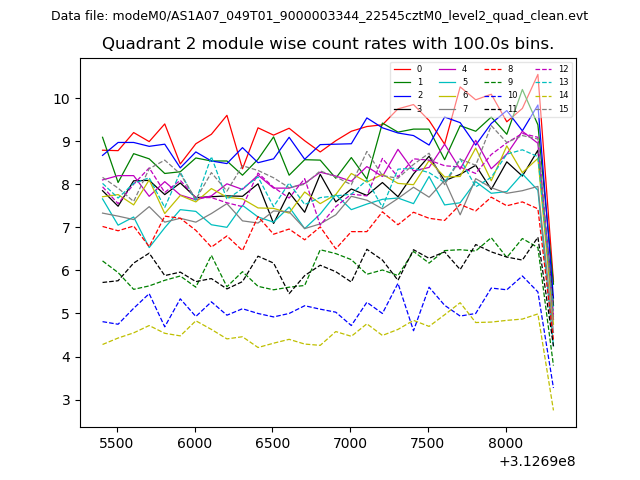
| Module-wise count rates for Quadrant B Data is divided into 100 sec bins |
 |
 |
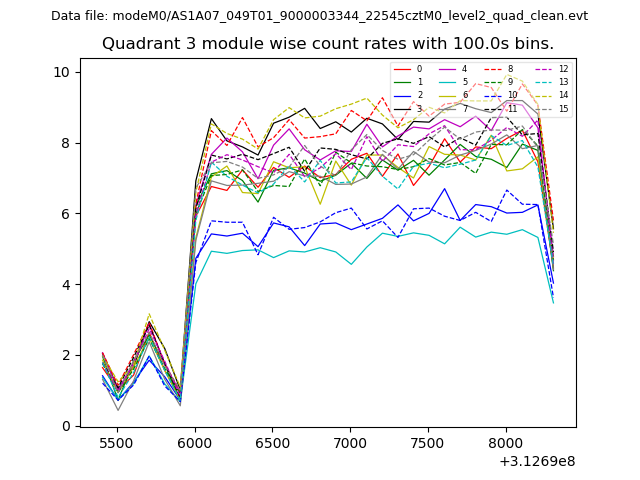
| Module-wise count rates for Quadrant C Data is divided into 100 sec bins |
 |
 |
| Module-wise count rates for Quadrant D Data is divided into 100 sec bins |
 |
 |
| Parameter | Plot |
|---|---|
| CZT HV Monitor | 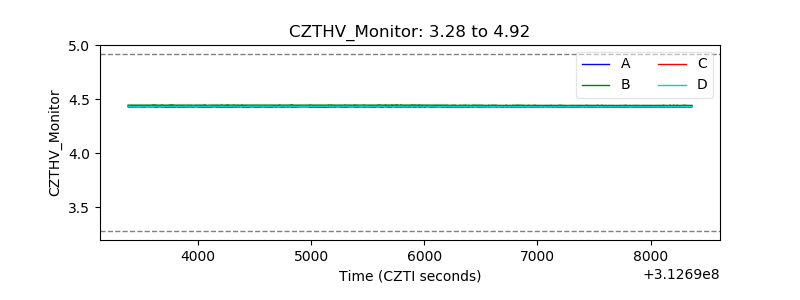 |
| D_VDD | 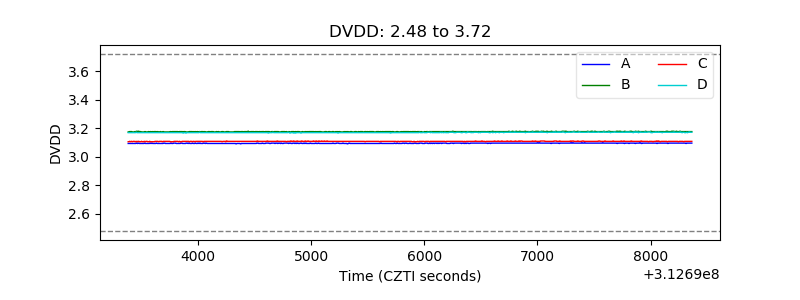 |
| Temperature 1 | 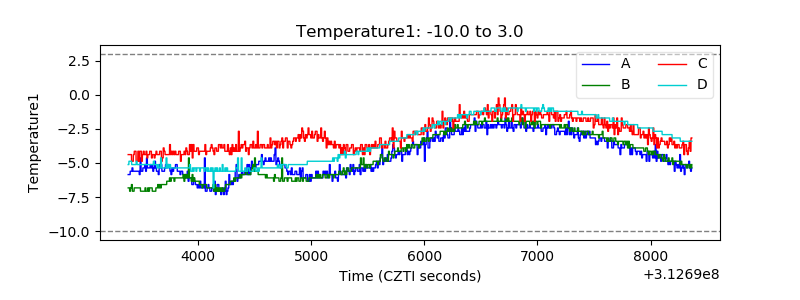 |
| Veto HV Monitor | 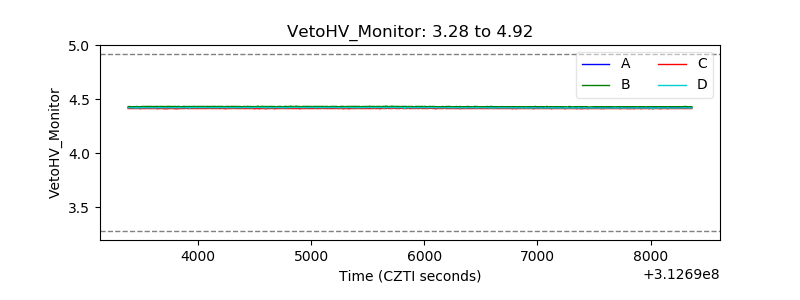 |
| Veto LLD | 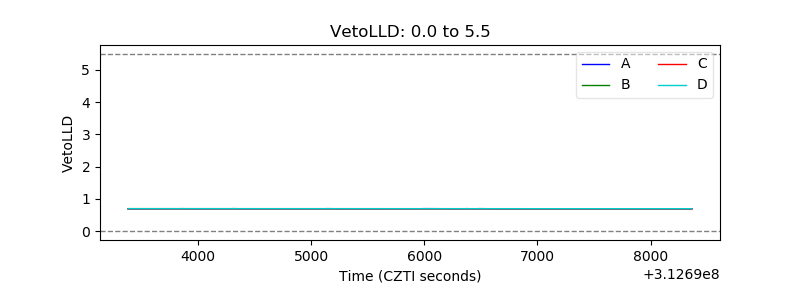 |
| Alpha Counter | 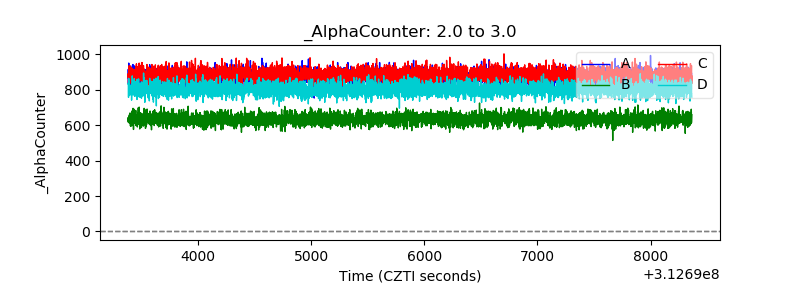 |
| _CPM_Rate | 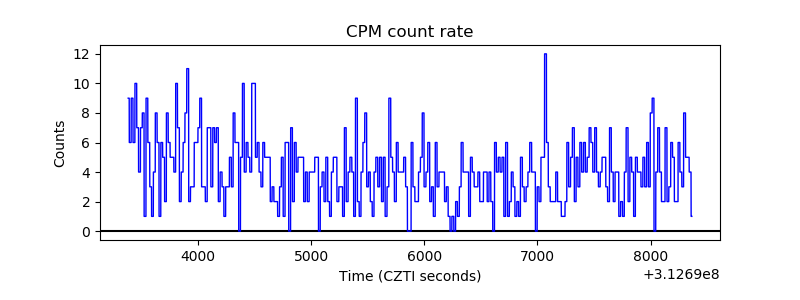 |
| CZT Counter | 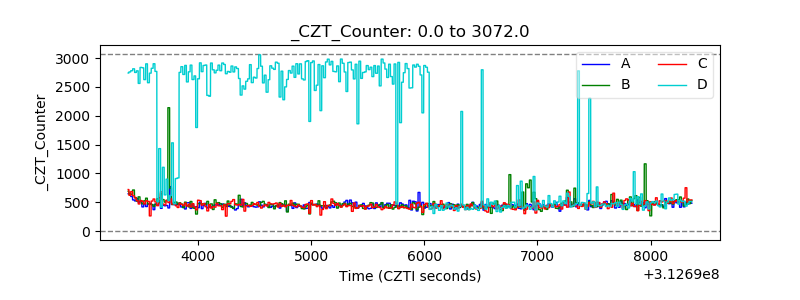 |
| +2.5 Volts monitor |  |
| +5 Volts monitor | 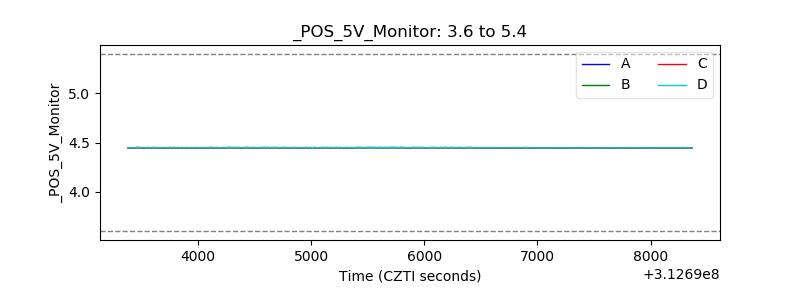 |
| _ROLL_ROT | 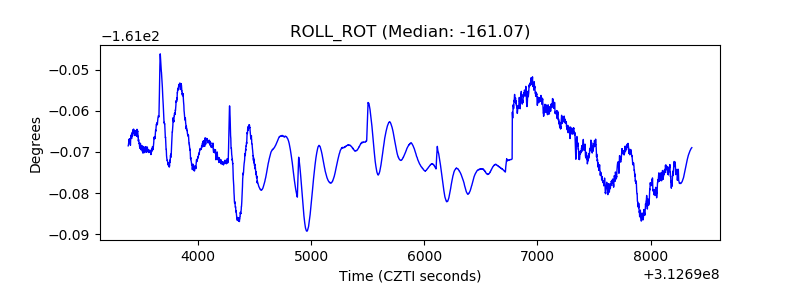 |
| _Roll_DEC |  |
| _Roll_RA | 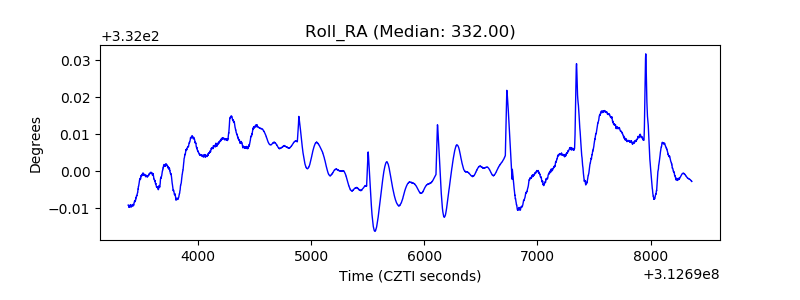 |
| Veto Counter | 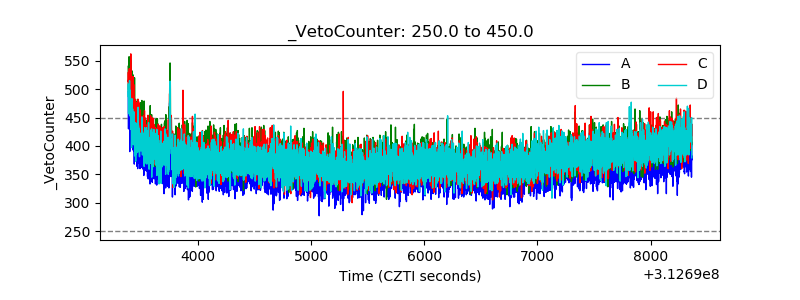 |