| Param | Original file | Final file |
|---|---|---|
| Filename | modeM0/AS1A07_148T05_9000003346_22545cztM0_level2.evt | modeM0/AS1A07_148T05_9000003346_22545cztM0_level2_quad_clean.evt |
| Size (bytes) | 1,008,106,560 | 159,724,800 |
| Size | 961.4 MB | 152.3 MB |
| Events in quadrant A | 5,884,451 | 1,034,485 |
| Events in quadrant B | 6,156,641 | 1,056,842 |
| Events in quadrant C | 6,031,167 | 1,012,377 |
| Events in quadrant D | 11,594,792 | 850,669 |
| Mode M9 | |||
|---|---|---|---|
| Quadrant | BADHDUFLAG | Total packets | Discarded packets |
| A | 0 | 15 | 0 |
| B | 0 | 15 | 0 |
| C | 0 | 15 | 0 |
| D | 0 | 15 | 0 |
| Mode M0 | |||
|---|---|---|---|
| Quadrant | BADHDUFLAG | Total packets | Discarded packets |
| A | 0 | 25961 | 3 |
| B | 0 | 26638 | 3 |
| C | 0 | 26168 | 3 |
| D | 0 | 43096 | 3 |
| Mode SS | |||
|---|---|---|---|
| Quadrant | BADHDUFLAG | Total packets | Discarded packets |
| A | 0 | 258 | 0 |
| B | 0 | 258 | 0 |
| C | 0 | 258 | 0 |
| D | 0 | 258 | 0 |
| Quadrant | Total seconds | Saturated seconds | Saturation percentage |
|---|---|---|---|
| A | 12769 | 88 | 0.689169% |
| B | 12769 | 107 | 0.837967% |
| C | 12769 | 142 | 1.112068% |
| D | 12768 | 1931 | 15.123747% |
Noise dominated data is calculated using 1-second bins in cleaned event files. If a bin has >2000 counts, and if more than 50% of those come from <1% of pixels, then it is considered to be noise-dominated and hence unusable.
| Quadrant | # 1 sec bins | Bins with >0 counts | Bins with >2000 counts | High rate bins dominated by noise | Noise dominated (total time) | Noise dominated (detector-on time) | Marked lightcurve |
|---|---|---|---|---|---|---|---|
| A | 14108 | 12768 | 0 | 0 | 0.00% | 0.00% | 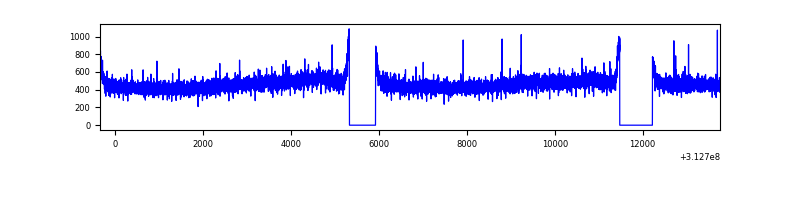 |
| B | 14108 | 12768 | 2 | 2 | 0.01% | 0.02% | 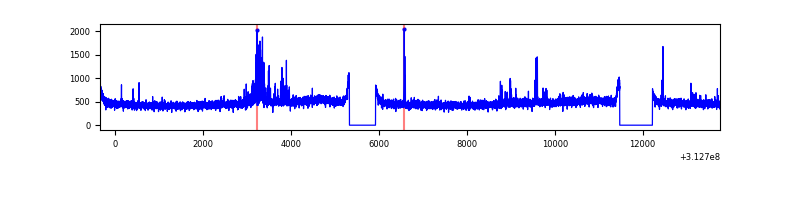 |
| C | 14109 | 12769 | 0 | 0 | 0.00% | 0.00% | 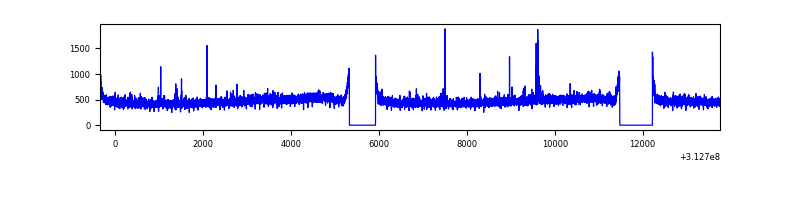 |
| D | 14108 | 12768 | 1723 | 1723 | 12.21% | 13.49% | 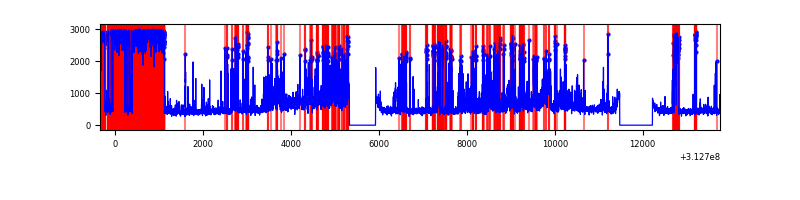 |
Top three noisy pixels from each quadrant. If the there are fewer than three noisy pixels in the level2.evt file, extra rows are filled as -1
| Pixel properties | Quadrant properties | ||||||
|---|---|---|---|---|---|---|---|
| Quadrant | DetID | PixID | Counts | Sigma | Mean | Median | Sigma |
| A | 13 | 254 | 19533 | 58.94 | 1525 | 1492 | 306.1 |
| A | 3 | 137 | 13502 | 39.23 | 1525 | 1492 | 306.1 |
| A | 0 | 226 | 12943 | 37.41 | 1525 | 1492 | 306.1 |
| B | 15 | 33 | 151653 | 520.01 | 1516 | 1477 | 288.8 |
| B | 12 | 111 | 36357 | 120.78 | 1516 | 1477 | 288.8 |
| B | 11 | 111 | 32539 | 107.56 | 1516 | 1477 | 288.8 |
| C | 14 | 238 | 229272 | 663.08 | 1461 | 1468 | 343.6 |
| C | 0 | 207 | 92802 | 265.85 | 1461 | 1468 | 343.6 |
| C | 0 | 10 | 13611 | 35.35 | 1461 | 1468 | 343.6 |
| D | 7 | 223 | 3293315 | 9836.22 | 1362 | 1323 | 334.7 |
| D | 1 | 52 | 2881079 | 8604.49 | 1362 | 1323 | 334.7 |
| D | 12 | 33 | 209372 | 621.63 | 1362 | 1323 | 334.7 |
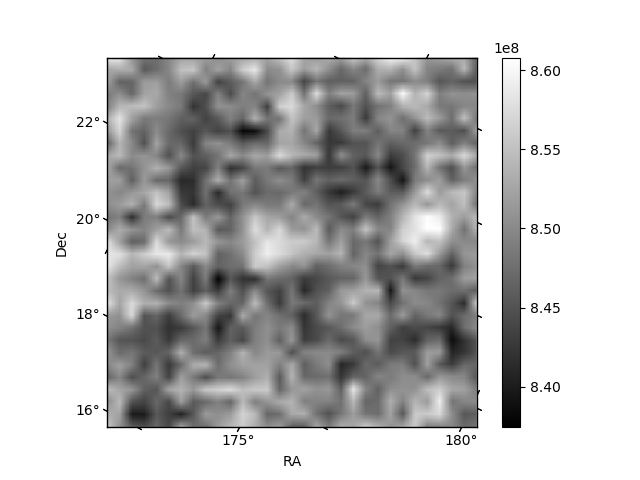
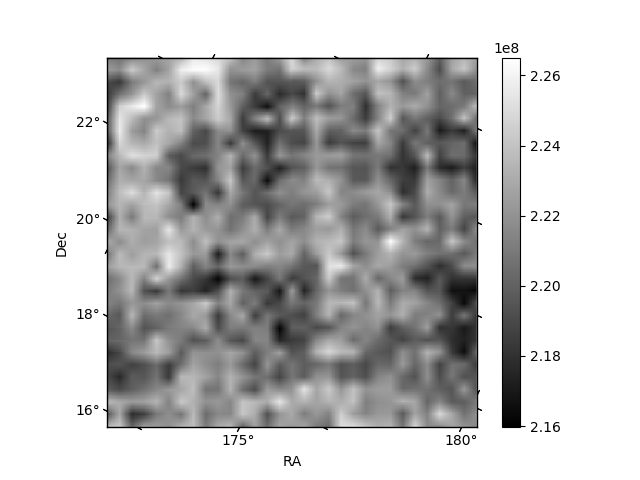
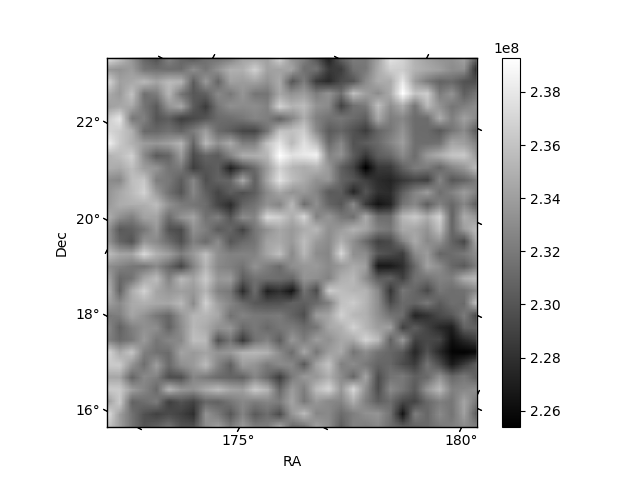
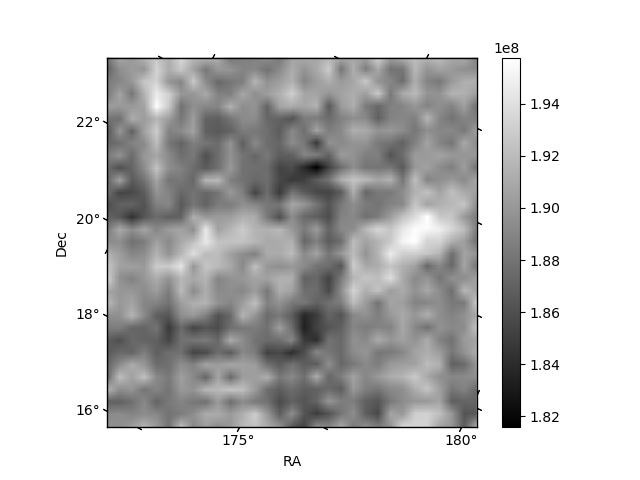
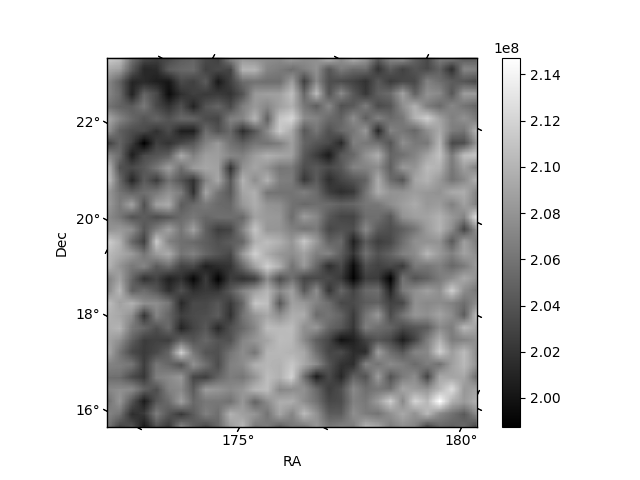
Histogram calculated using DETX and DETY for each event in the final _common_clean file
| Quadrant A | 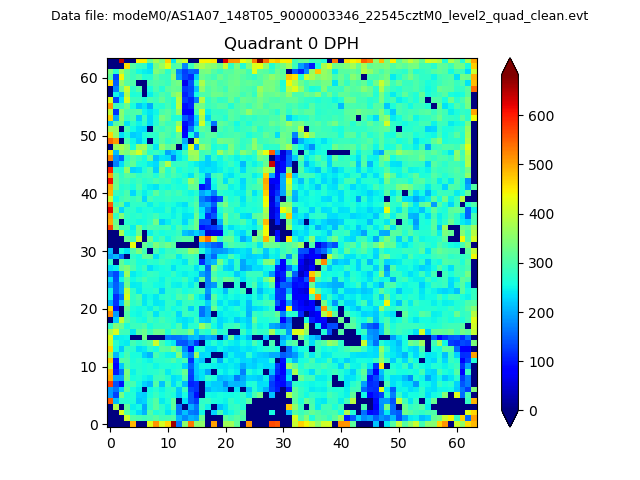 |
 |
Quadrant B |
|---|---|---|---|
| Quadrant D | 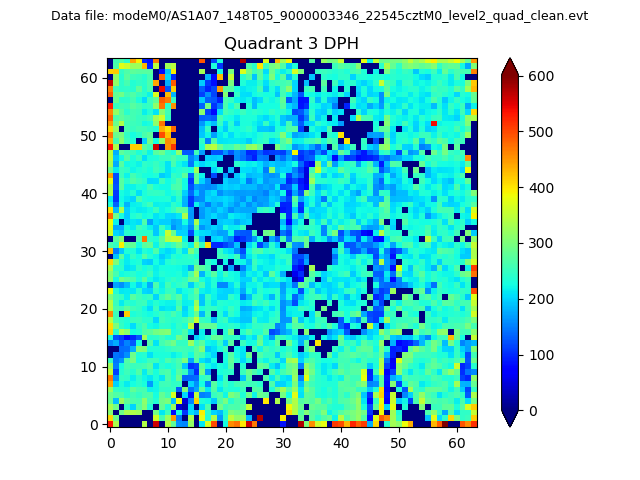 |
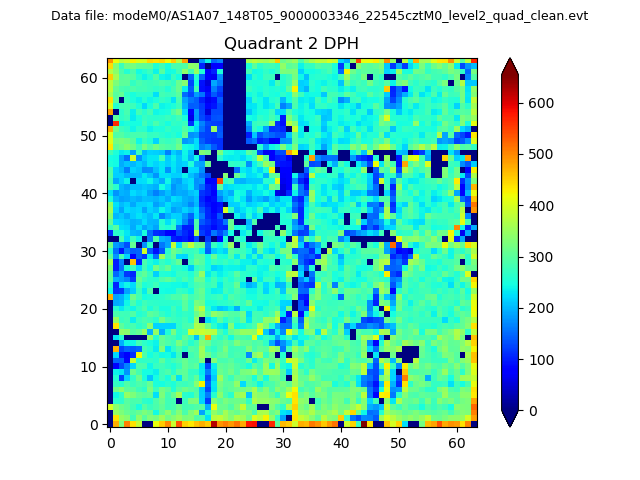 |
Quadrant C |
| Plot type | Count rate plots | Images |
|---|---|---|
| Comparison with Poisson distribution Blue bars denote a histogram of data divided into 1 sec bins. Red curve is a Poisson curve with rate = median count rate of data. |
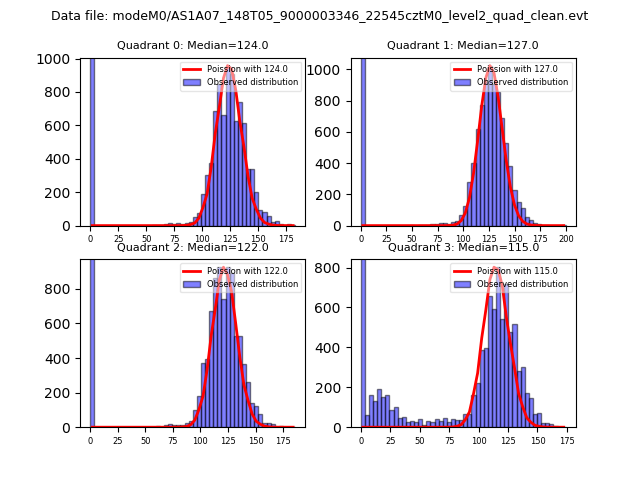 |
 |
| Quadrant-wise count rates Data is divided into 100 sec bins |
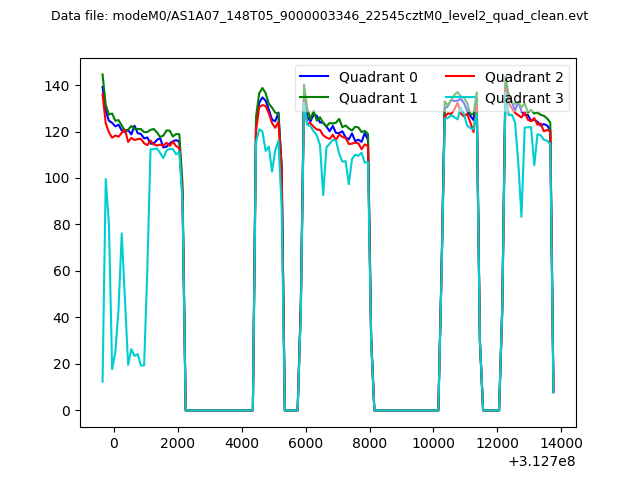 |
|
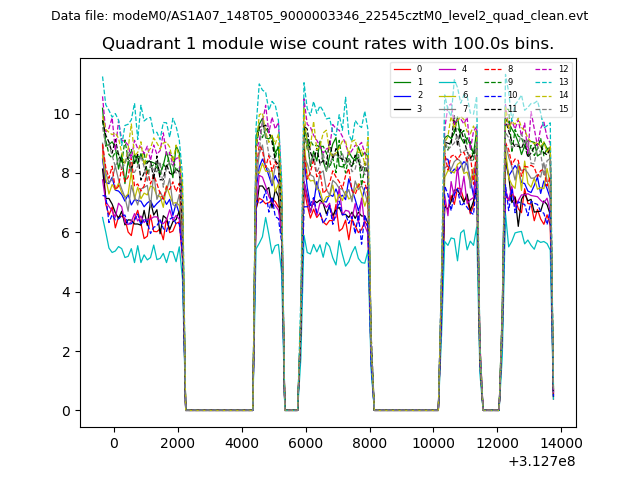
| Module-wise count rates for Quadrant A Data is divided into 100 sec bins |
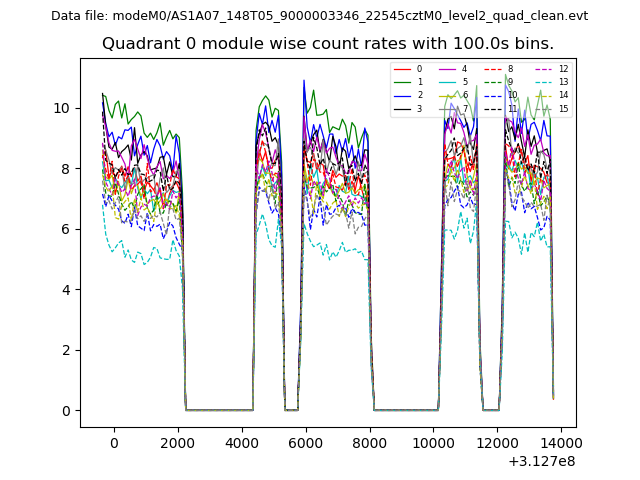 |
 |
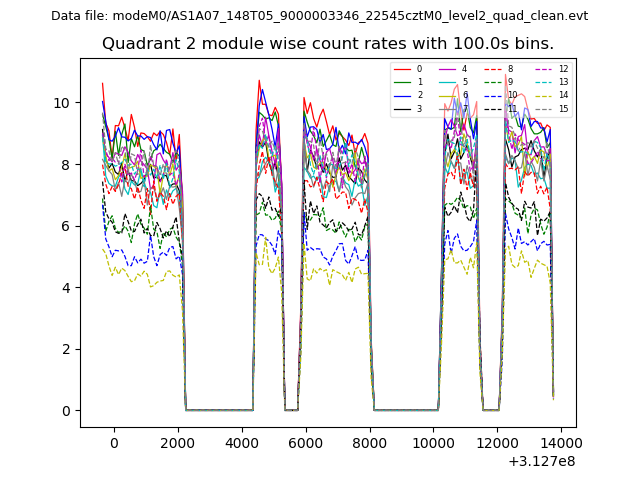
| Module-wise count rates for Quadrant B Data is divided into 100 sec bins |
 |
 |
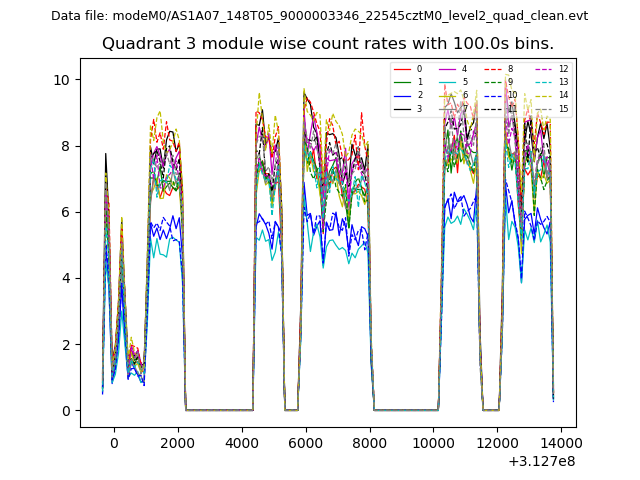
| Module-wise count rates for Quadrant C Data is divided into 100 sec bins |
 |
 |
| Module-wise count rates for Quadrant D Data is divided into 100 sec bins |
 |
 |
| Parameter | Plot |
|---|---|
| CZT HV Monitor | 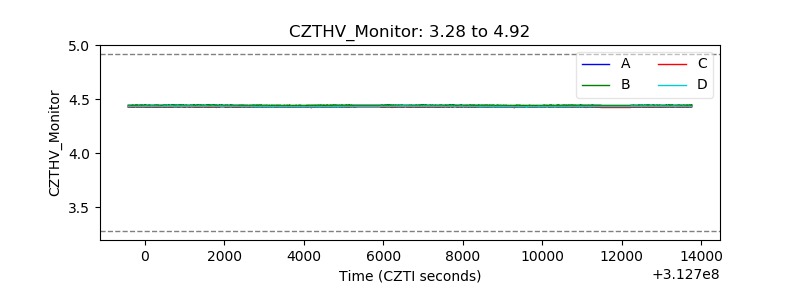 |
| D_VDD | 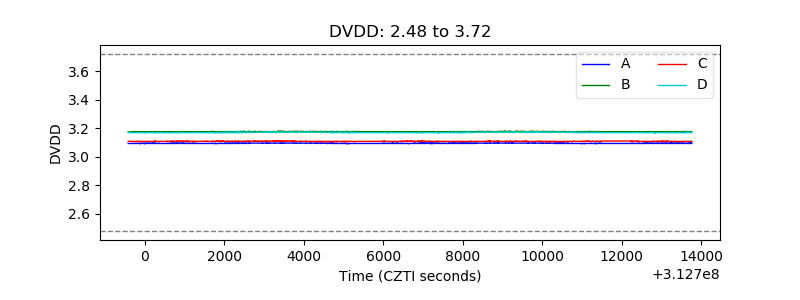 |
| Temperature 1 | 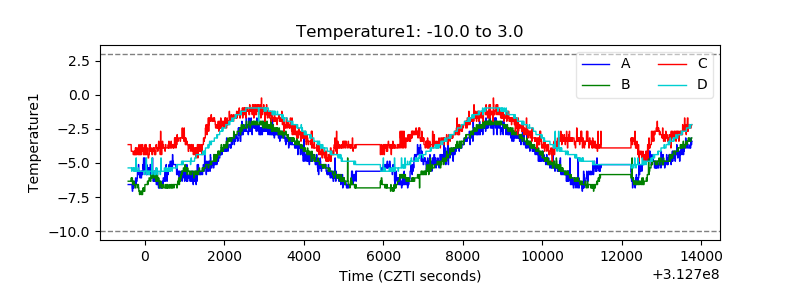 |
| Veto HV Monitor |  |
| Veto LLD | 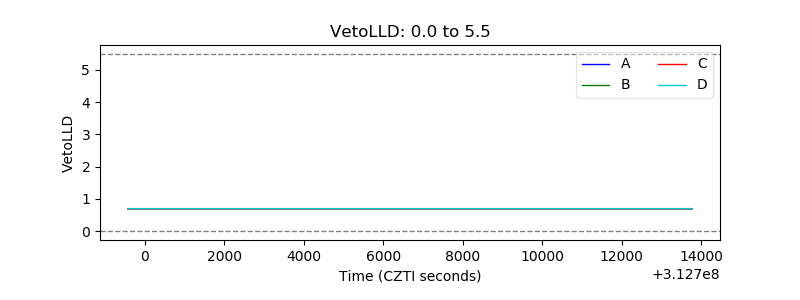 |
| Alpha Counter | 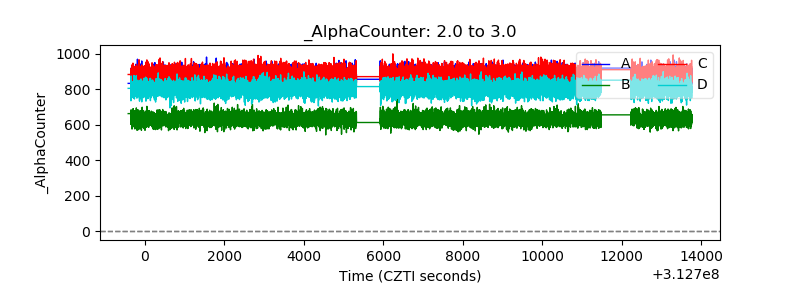 |
| _CPM_Rate | 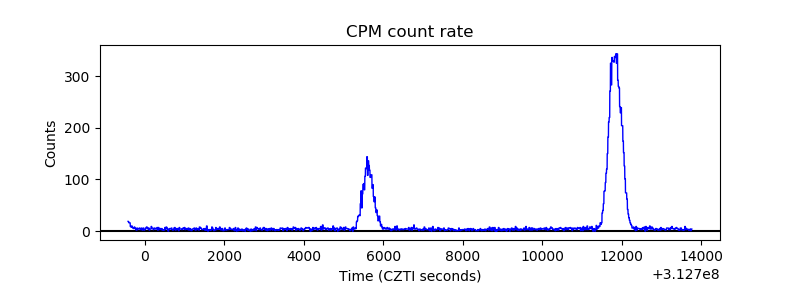 |
| CZT Counter | 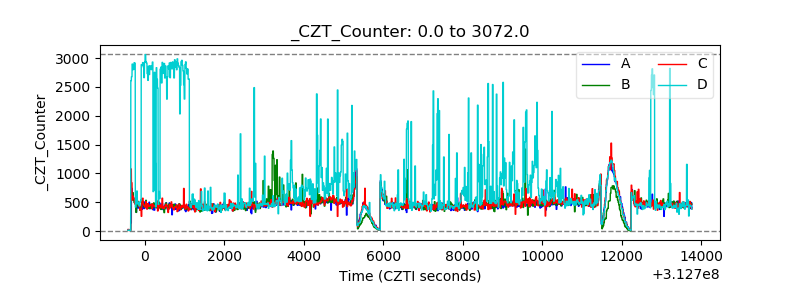 |
| +2.5 Volts monitor | 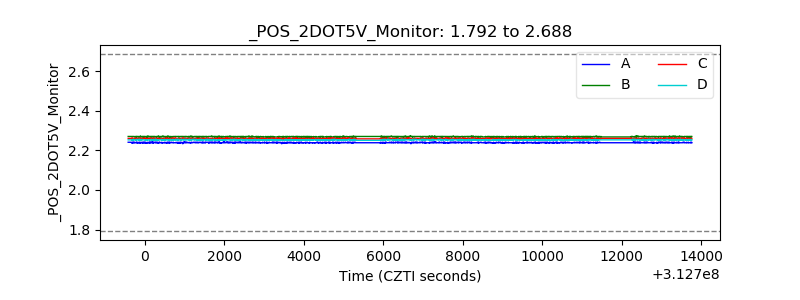 |
| +5 Volts monitor |  |
| _ROLL_ROT | 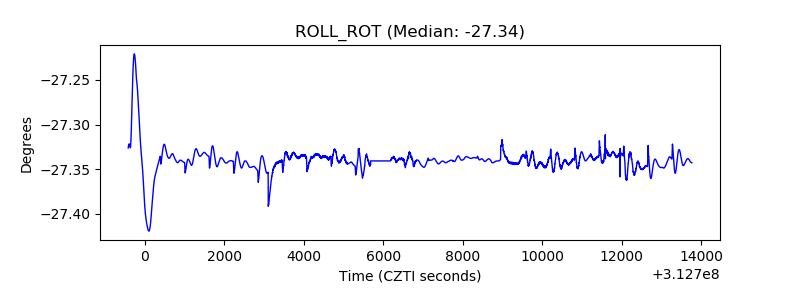 |
| _Roll_DEC | 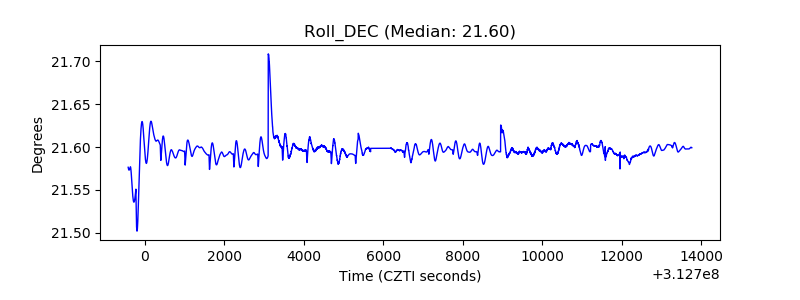 |
| _Roll_RA | 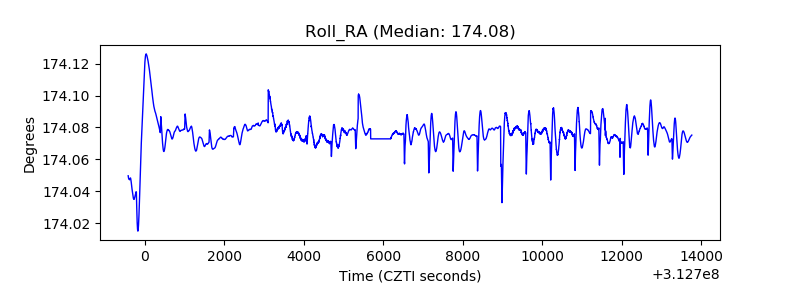 |
| Veto Counter | 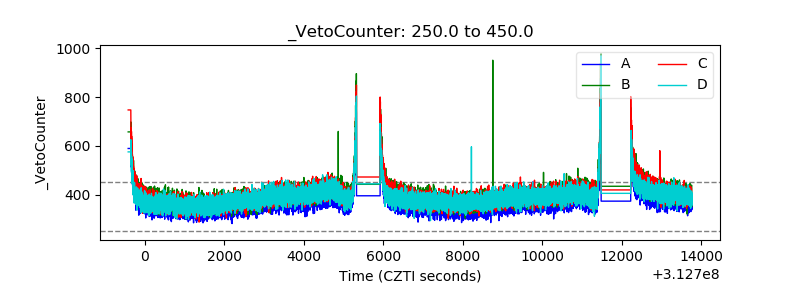 |