| Param | Original file | Final file |
|---|---|---|
| Filename | modeM0/AS1A07_148T05_9000003346_22547cztM0_level2.evt | modeM0/AS1A07_148T05_9000003346_22547cztM0_level2_quad_clean.evt |
| Size (bytes) | 479,280,960 | 86,002,560 |
| Size | 457.1 MB | 82.0 MB |
| Events in quadrant A | 3,276,377 | 541,417 |
| Events in quadrant B | 3,489,353 | 553,190 |
| Events in quadrant C | 3,438,082 | 529,187 |
| Events in quadrant D | 3,861,389 | 518,652 |
| Mode M9 | |||
|---|---|---|---|
| Quadrant | BADHDUFLAG | Total packets | Discarded packets |
| A | 0 | 11 | 0 |
| B | 0 | 12 | 0 |
| C | 0 | 12 | 0 |
| D | 0 | 12 | 0 |
| Mode M0 | |||
|---|---|---|---|
| Quadrant | BADHDUFLAG | Total packets | Discarded packets |
| A | 0 | 13796 | 2 |
| B | 0 | 14340 | 4 |
| C | 0 | 14166 | 2 |
| D | 0 | 15581 | 2 |
| Mode SS | |||
|---|---|---|---|
| Quadrant | BADHDUFLAG | Total packets | Discarded packets |
| A | 0 | 134 | 0 |
| B | 0 | 134 | 0 |
| C | 0 | 134 | 0 |
| D | 0 | 134 | 0 |
| Quadrant | Total seconds | Saturated seconds | Saturation percentage |
|---|---|---|---|
| A | 6628 | 62 | 0.935425% |
| B | 6627 | 78 | 1.177003% |
| C | 6627 | 110 | 1.659876% |
| D | 6627 | 108 | 1.629697% |
Noise dominated data is calculated using 1-second bins in cleaned event files. If a bin has >2000 counts, and if more than 50% of those come from <1% of pixels, then it is considered to be noise-dominated and hence unusable.
| Quadrant | # 1 sec bins | Bins with >0 counts | Bins with >2000 counts | High rate bins dominated by noise | Noise dominated (total time) | Noise dominated (detector-on time) | Marked lightcurve |
|---|---|---|---|---|---|---|---|
| A | 7687 | 6627 | 0 | 0 | 0.00% | 0.00% | 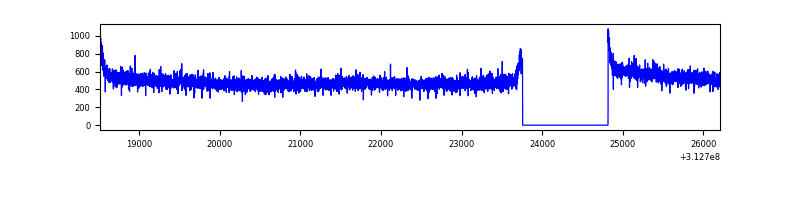 |
| B | 7686 | 6626 | 6 | 6 | 0.08% | 0.09% | 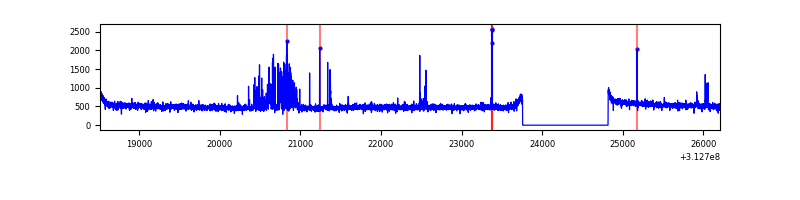 |
| C | 7686 | 6626 | 13 | 13 | 0.17% | 0.20% | 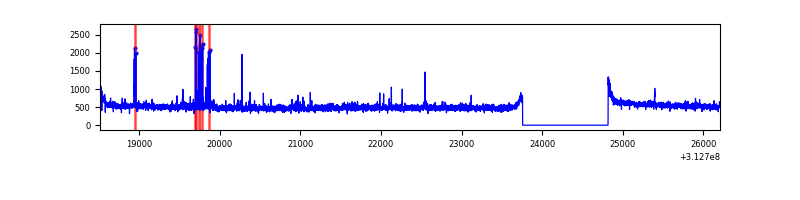 |
| D | 7686 | 6626 | 33 | 33 | 0.43% | 0.50% | 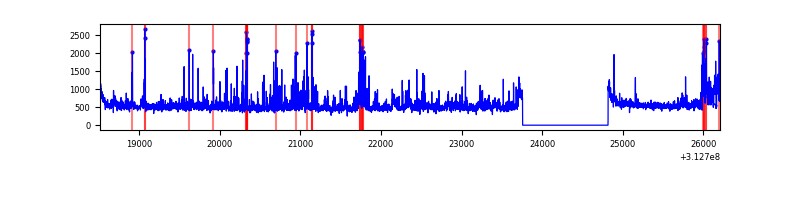 |
Top three noisy pixels from each quadrant. If the there are fewer than three noisy pixels in the level2.evt file, extra rows are filled as -1
| Pixel properties | Quadrant properties | ||||||
|---|---|---|---|---|---|---|---|
| Quadrant | DetID | PixID | Counts | Sigma | Mean | Median | Sigma |
| A | 13 | 254 | 11614 | 63.79 | 848 | 829 | 169.1 |
| A | 3 | 137 | 7191 | 37.63 | 848 | 829 | 169.1 |
| A | 0 | 226 | 7184 | 37.59 | 848 | 829 | 169.1 |
| B | 15 | 33 | 165645 | 1020.62 | 838 | 816 | 161.5 |
| B | 0 | 190 | 21937 | 130.78 | 838 | 816 | 161.5 |
| B | 12 | 111 | 19350 | 114.76 | 838 | 816 | 161.5 |
| C | 14 | 238 | 127421 | 663.82 | 815 | 822 | 190.7 |
| C | 0 | 207 | 105580 | 549.29 | 815 | 822 | 190.7 |
| C | 10 | 22 | 19697 | 98.97 | 815 | 822 | 190.7 |
| D | 1 | 52 | 315398 | 1552.3 | 826 | 802 | 202.7 |
| D | 12 | 33 | 218388 | 1073.63 | 826 | 802 | 202.7 |
| D | 13 | 172 | 110464 | 541.1 | 826 | 802 | 202.7 |
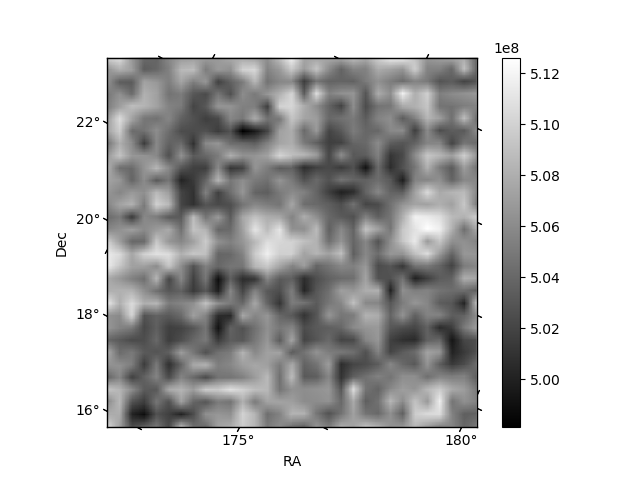
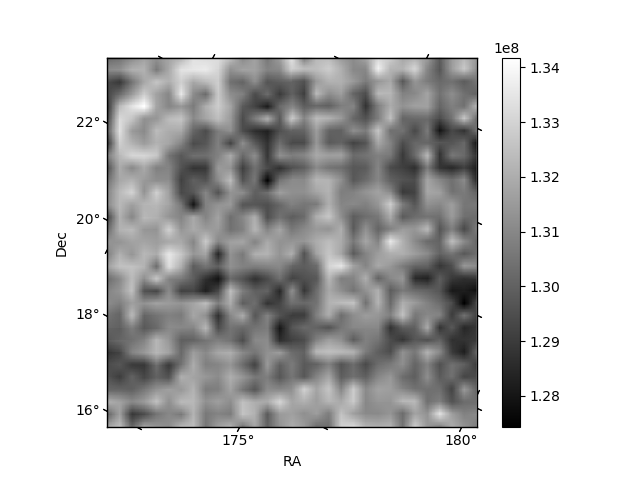
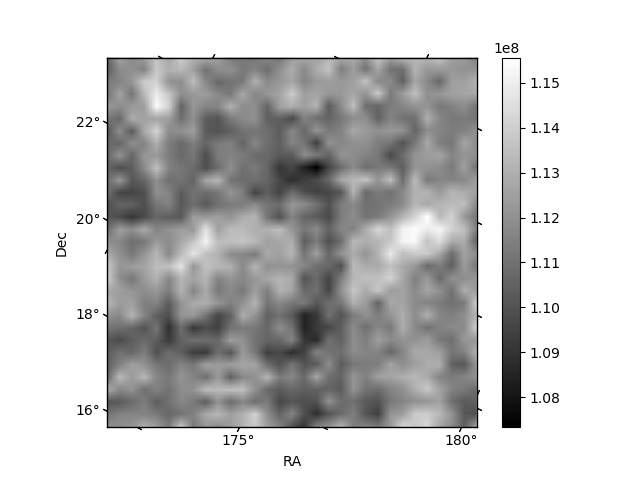
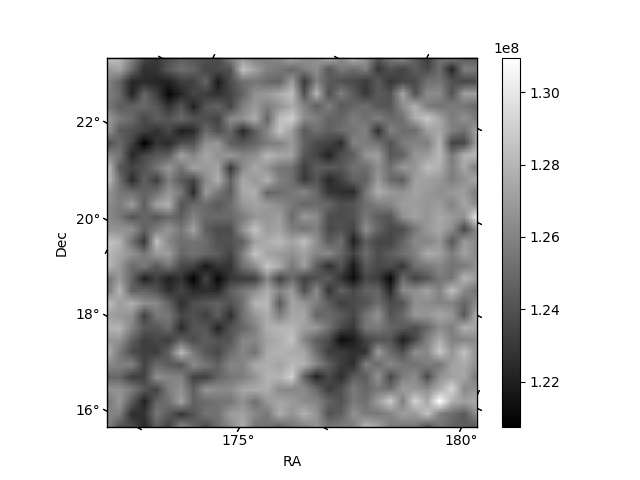
Histogram calculated using DETX and DETY for each event in the final _common_clean file
| Quadrant A | 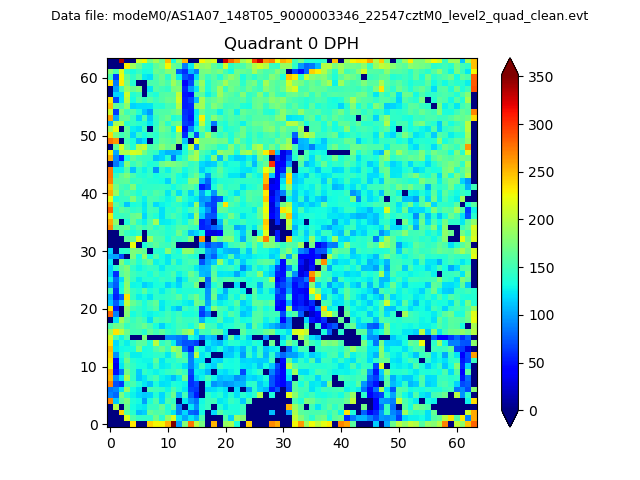 |
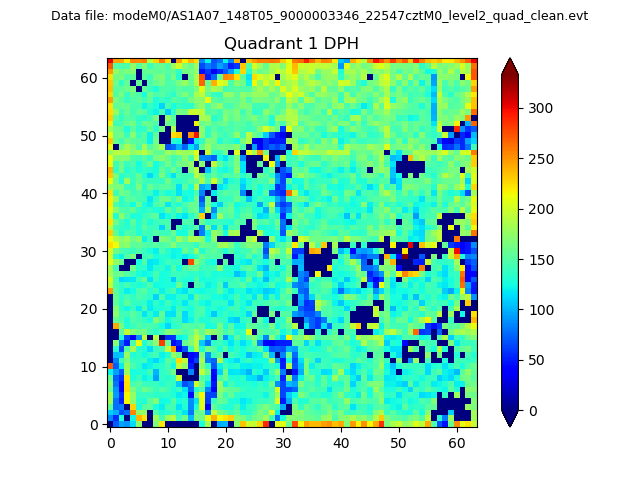 |
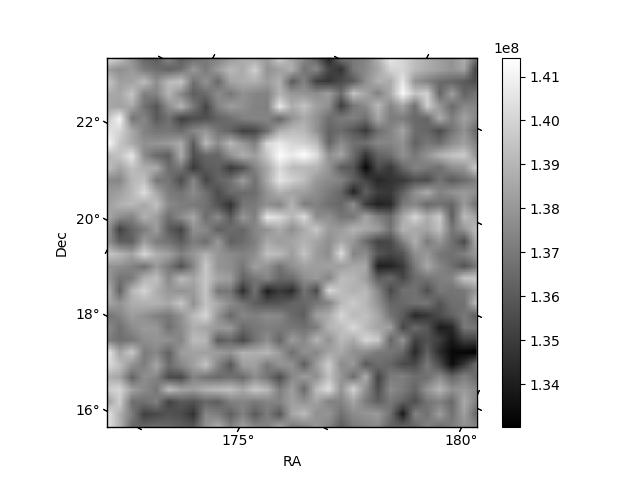
Quadrant B |
|---|---|---|---|
| Quadrant D | 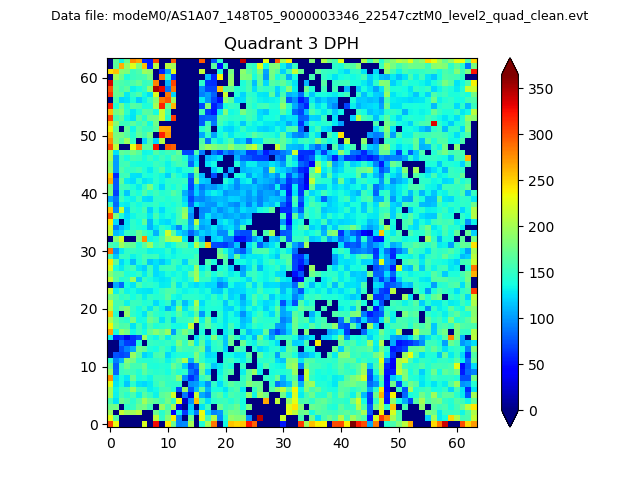 |
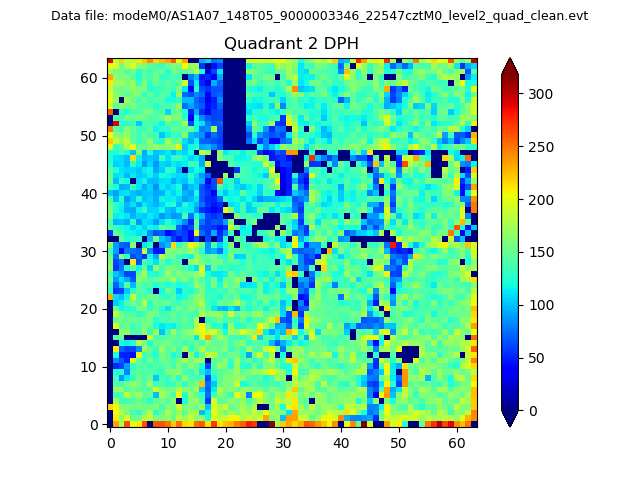 |
Quadrant C |
| Plot type | Count rate plots | Images |
|---|---|---|
| Comparison with Poisson distribution Blue bars denote a histogram of data divided into 1 sec bins. Red curve is a Poisson curve with rate = median count rate of data. |
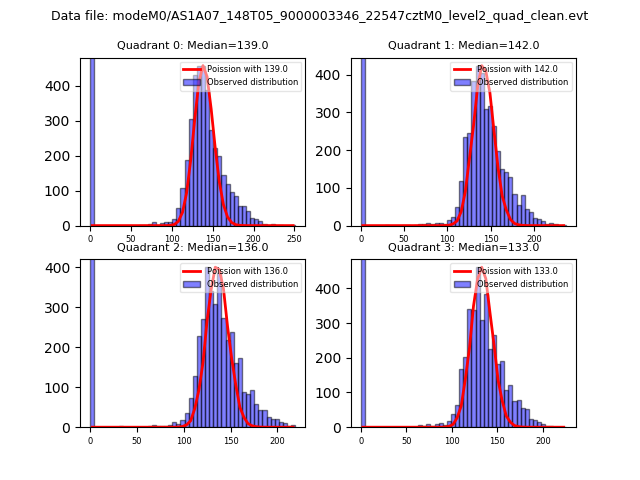 |
 |
| Quadrant-wise count rates Data is divided into 100 sec bins |
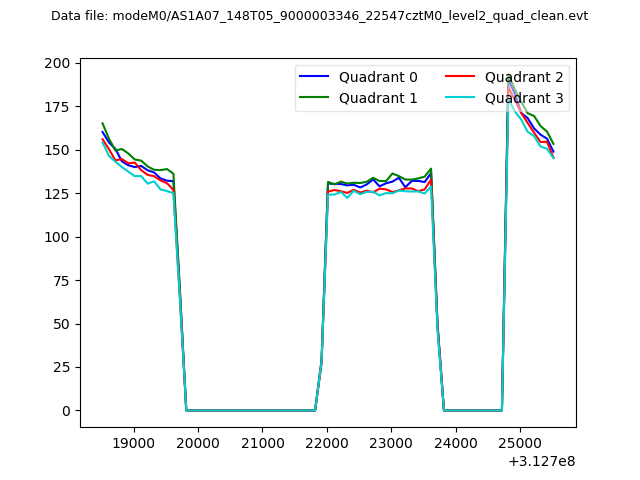 |
|
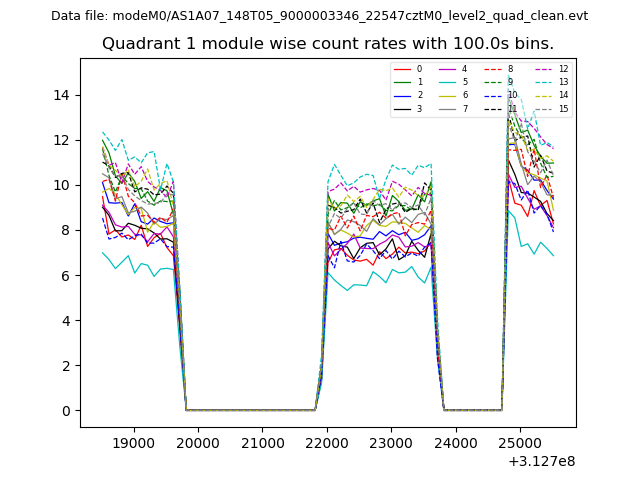
| Module-wise count rates for Quadrant A Data is divided into 100 sec bins |
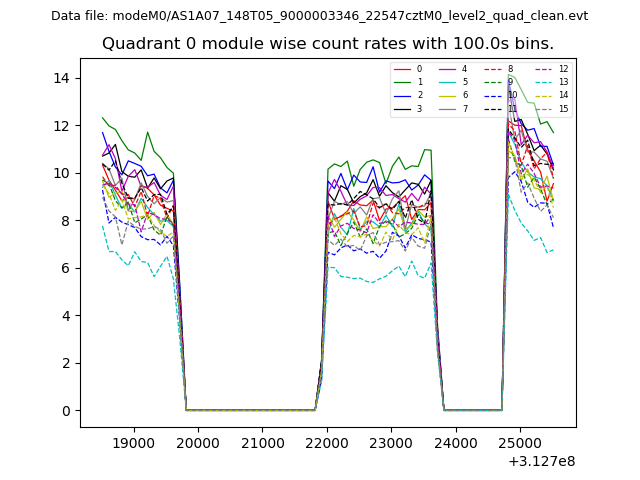 |
 |
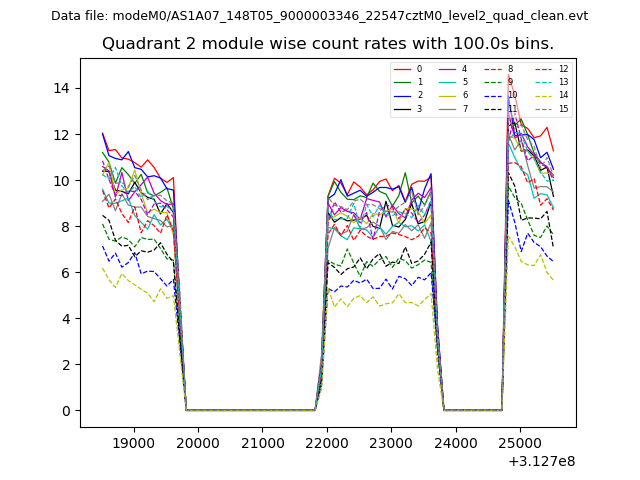
| Module-wise count rates for Quadrant B Data is divided into 100 sec bins |
 |
 |
| Module-wise count rates for Quadrant C Data is divided into 100 sec bins |
 |
 |
| Module-wise count rates for Quadrant D Data is divided into 100 sec bins |
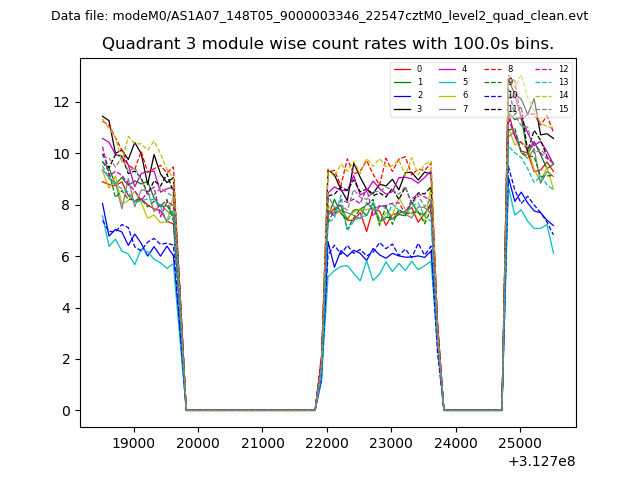 |
 |
| Parameter | Plot |
|---|---|
| CZT HV Monitor | 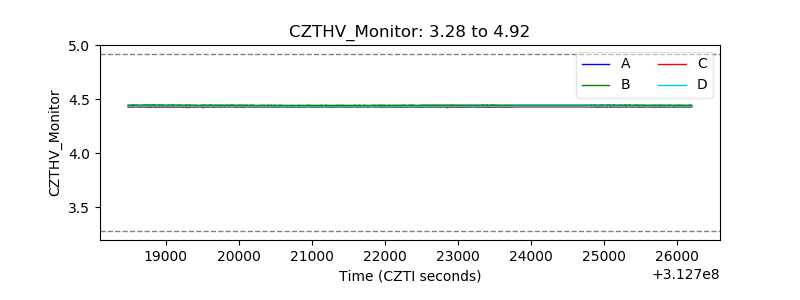 |
| D_VDD | 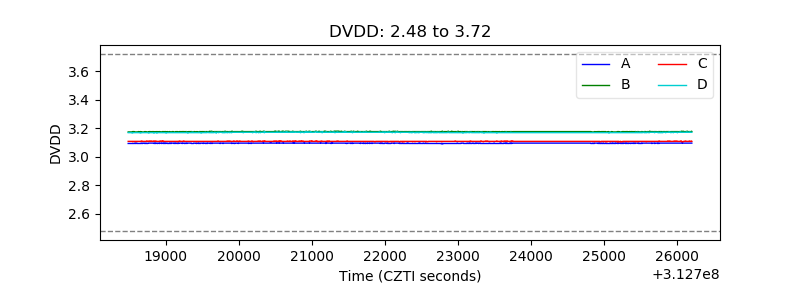 |
| Temperature 1 | 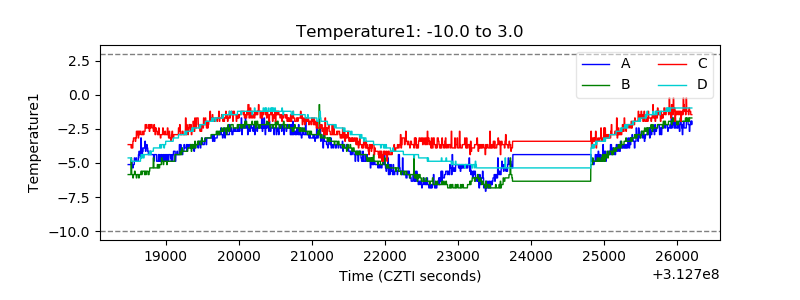 |
| Veto HV Monitor | 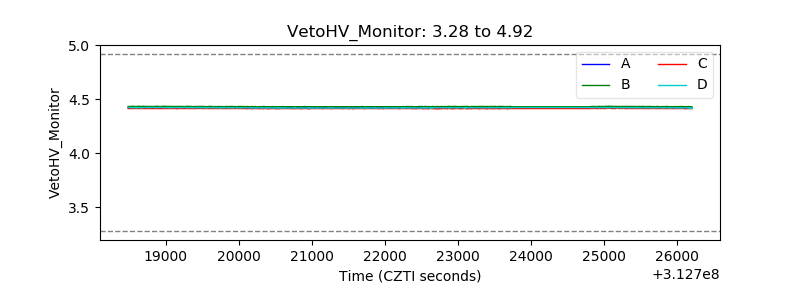 |
| Veto LLD | 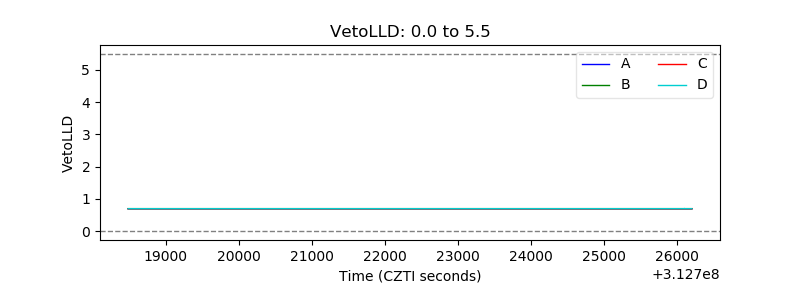 |
| Alpha Counter | 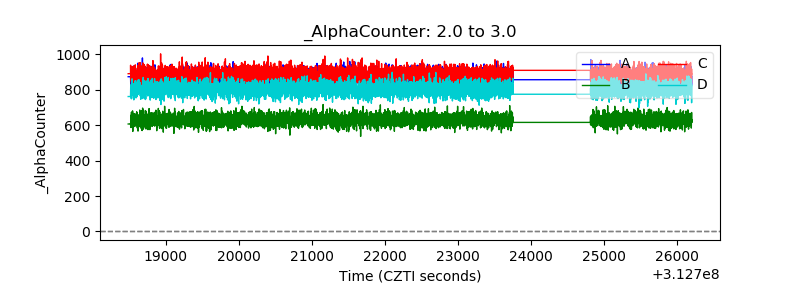 |
| _CPM_Rate | 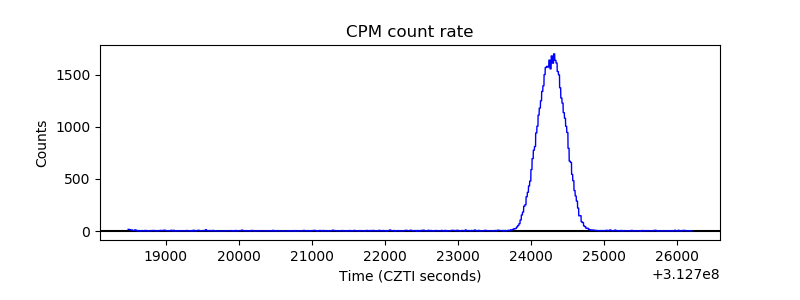 |
| CZT Counter |  |
| +2.5 Volts monitor |  |
| +5 Volts monitor | 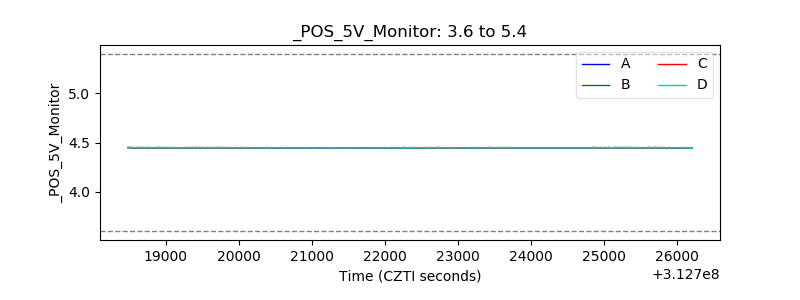 |
| _ROLL_ROT | 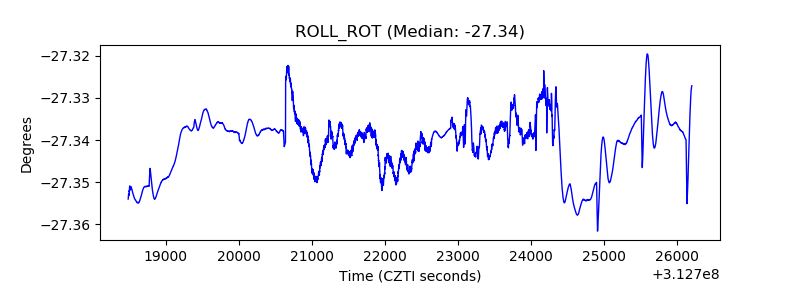 |
| _Roll_DEC | 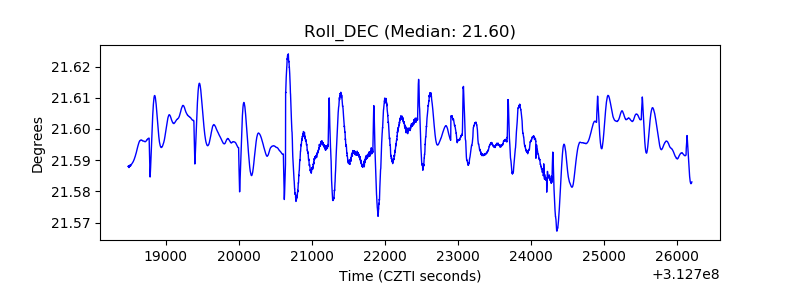 |
| _Roll_RA | 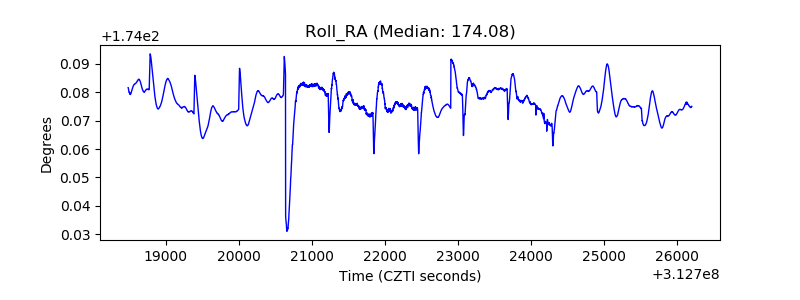 |
| Veto Counter | 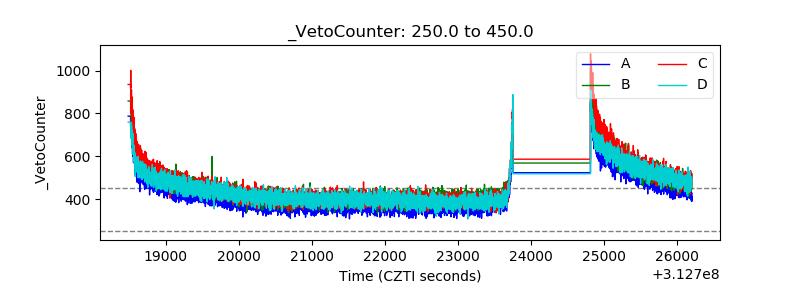 |