| Param | Original file | Final file |
|---|---|---|
| Filename | modeM0/AS1A07_148T05_9000003346_22549cztM0_level2.evt | modeM0/AS1A07_148T05_9000003346_22549cztM0_level2_quad_clean.evt |
| Size (bytes) | 456,272,640 | 69,609,600 |
| Size | 435.1 MB | 66.4 MB |
| Events in quadrant A | 3,145,785 | 424,189 |
| Events in quadrant B | 3,337,560 | 432,443 |
| Events in quadrant C | 3,200,358 | 414,949 |
| Events in quadrant D | 3,720,083 | 409,725 |
| Mode M9 | |||
|---|---|---|---|
| Quadrant | BADHDUFLAG | Total packets | Discarded packets |
| A | 0 | 12 | 0 |
| B | 0 | 12 | 0 |
| C | 0 | 12 | 0 |
| D | 0 | 12 | 0 |
| Mode M0 | |||
|---|---|---|---|
| Quadrant | BADHDUFLAG | Total packets | Discarded packets |
| A | 0 | 13104 | 1 |
| B | 0 | 13646 | 1 |
| C | 0 | 13245 | 1 |
| D | 0 | 15104 | 1 |
| Mode SS | |||
|---|---|---|---|
| Quadrant | BADHDUFLAG | Total packets | Discarded packets |
| A | 0 | 124 | 0 |
| B | 0 | 124 | 0 |
| C | 0 | 124 | 0 |
| D | 0 | 124 | 0 |
| Quadrant | Total seconds | Saturated seconds | Saturation percentage |
|---|---|---|---|
| A | 6107 | 53 | 0.867857% |
| B | 6107 | 82 | 1.342721% |
| C | 6107 | 72 | 1.178975% |
| D | 6106 | 112 | 1.834261% |
Noise dominated data is calculated using 1-second bins in cleaned event files. If a bin has >2000 counts, and if more than 50% of those come from <1% of pixels, then it is considered to be noise-dominated and hence unusable.
| Quadrant | # 1 sec bins | Bins with >0 counts | Bins with >2000 counts | High rate bins dominated by noise | Noise dominated (total time) | Noise dominated (detector-on time) | Marked lightcurve |
|---|---|---|---|---|---|---|---|
| A | 7292 | 6107 | 0 | 0 | 0.00% | 0.00% | 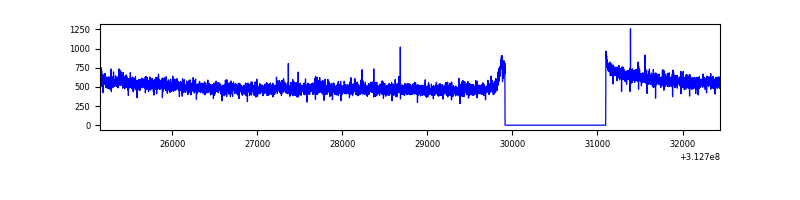 |
| B | 7292 | 6107 | 17 | 17 | 0.23% | 0.28% | 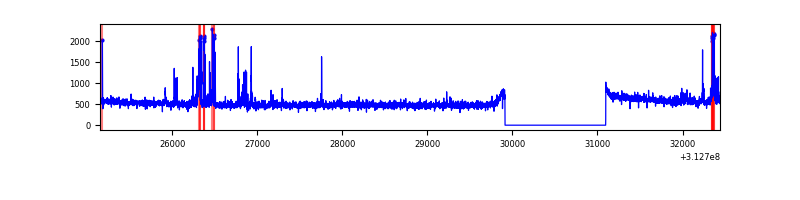 |
| C | 7291 | 6106 | 0 | 0 | 0.00% | 0.00% | 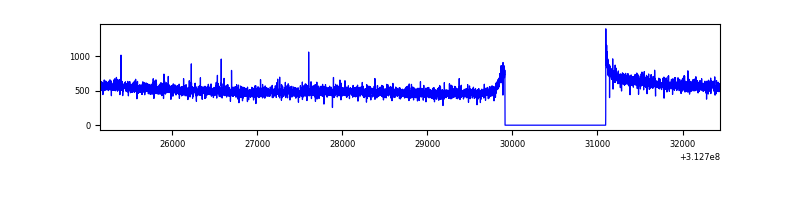 |
| D | 7291 | 6106 | 21 | 21 | 0.29% | 0.34% | 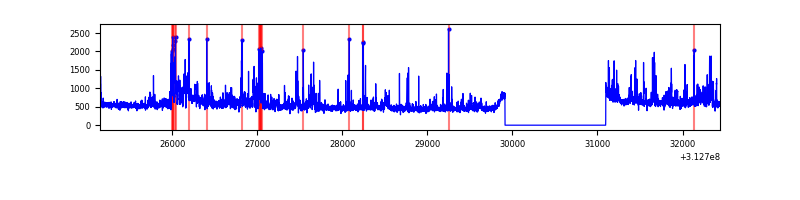 |
Top three noisy pixels from each quadrant. If the there are fewer than three noisy pixels in the level2.evt file, extra rows are filled as -1
| Pixel properties | Quadrant properties | ||||||
|---|---|---|---|---|---|---|---|
| Quadrant | DetID | PixID | Counts | Sigma | Mean | Median | Sigma |
| A | 13 | 254 | 10889 | 61.92 | 814 | 801 | 162.9 |
| A | 0 | 226 | 7045 | 38.33 | 814 | 801 | 162.9 |
| A | 3 | 137 | 6638 | 35.83 | 814 | 801 | 162.9 |
| B | 15 | 33 | 169536 | 1120.13 | 803 | 783 | 150.7 |
| B | 0 | 190 | 20127 | 128.4 | 803 | 783 | 150.7 |
| B | 12 | 111 | 17539 | 111.22 | 803 | 783 | 150.7 |
| C | 14 | 238 | 125881 | 688.24 | 783 | 789 | 181.8 |
| C | 0 | 207 | 15393 | 80.35 | 783 | 789 | 181.8 |
| C | 0 | 10 | 5978 | 28.55 | 783 | 789 | 181.8 |
| D | 1 | 52 | 557541 | 2882.27 | 794 | 772 | 193.2 |
| D | 12 | 33 | 84526 | 433.58 | 794 | 772 | 193.2 |
| D | 2 | 136 | 36622 | 185.59 | 794 | 772 | 193.2 |
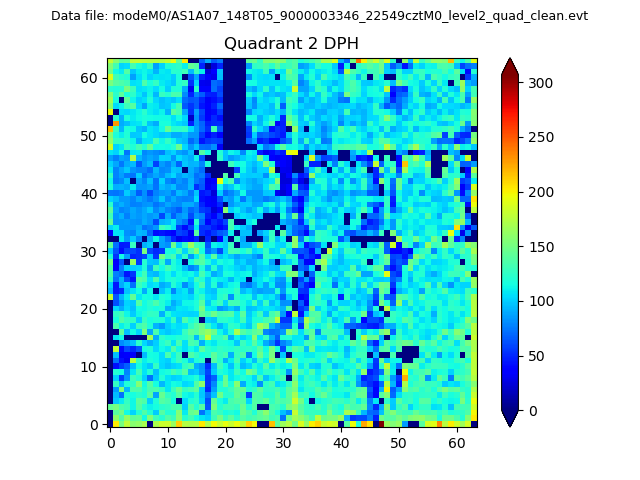
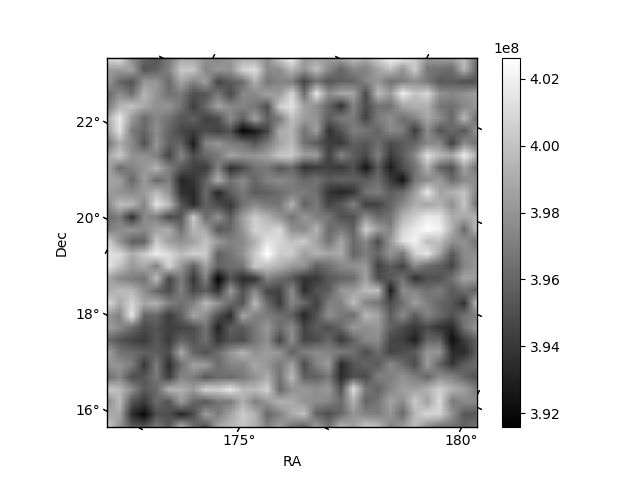
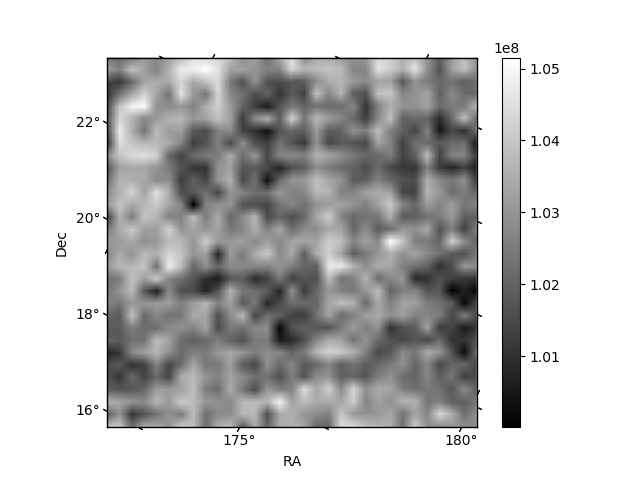
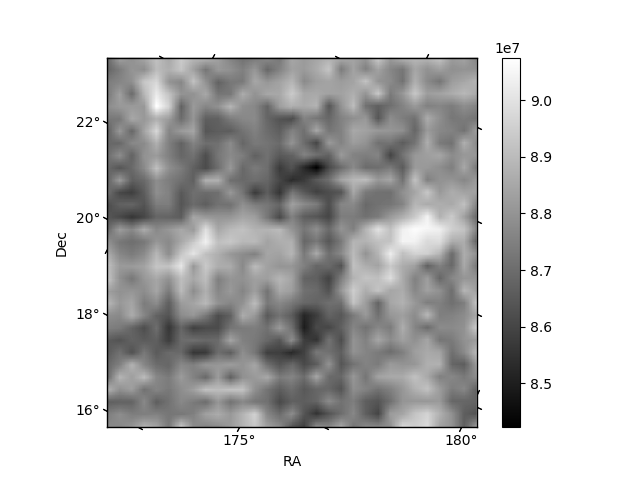
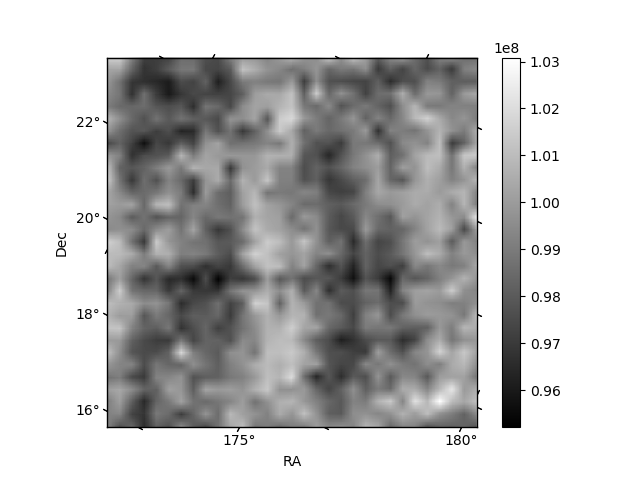
Histogram calculated using DETX and DETY for each event in the final _common_clean file
| Quadrant A | 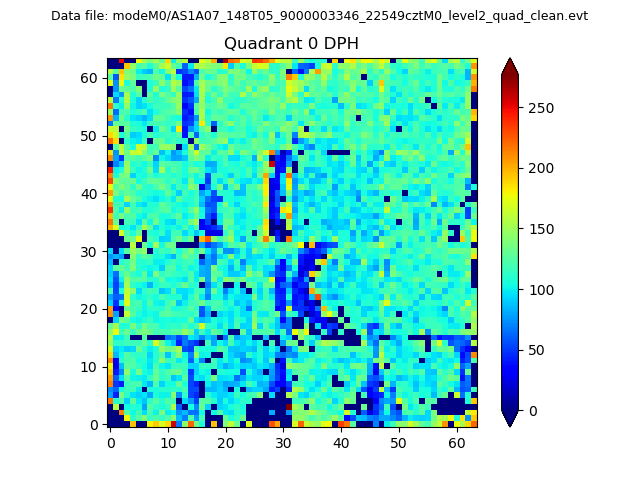 |
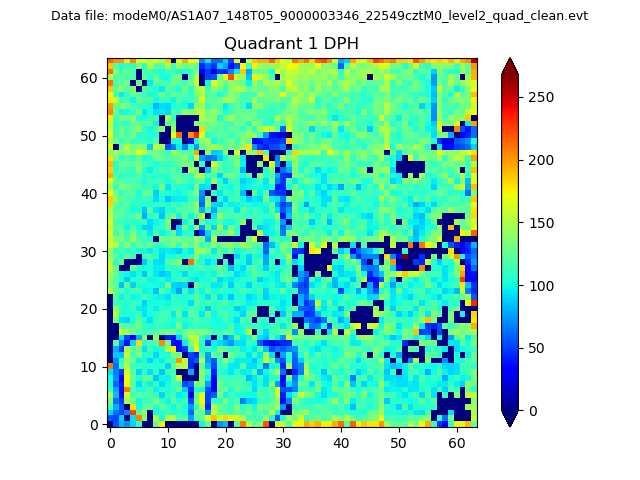 |
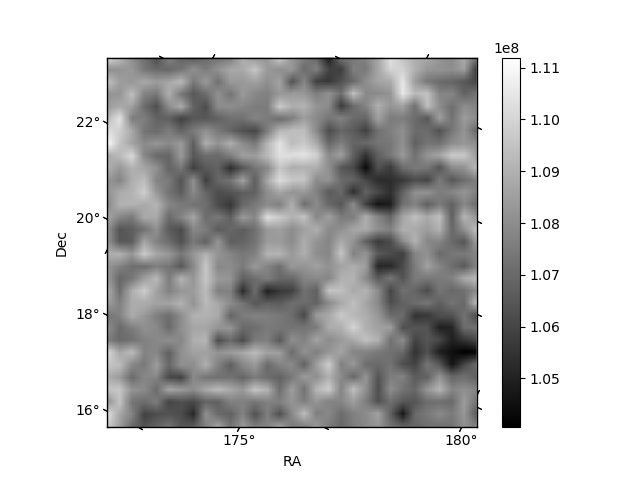
Quadrant B |
|---|---|---|---|
| Quadrant D | 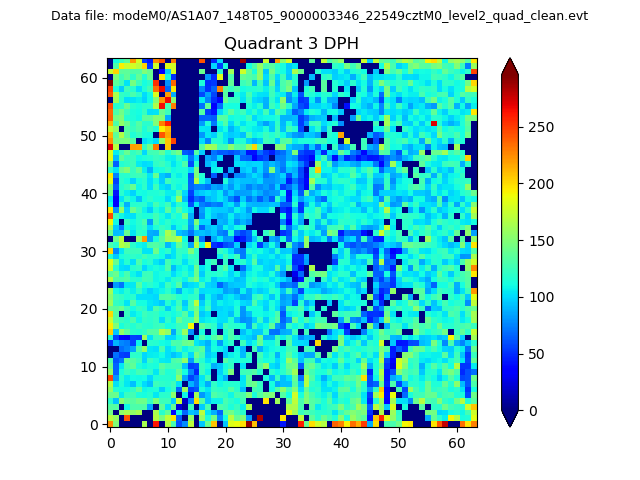 |
 |
Quadrant C |
| Plot type | Count rate plots | Images |
|---|---|---|
| Comparison with Poisson distribution Blue bars denote a histogram of data divided into 1 sec bins. Red curve is a Poisson curve with rate = median count rate of data. |
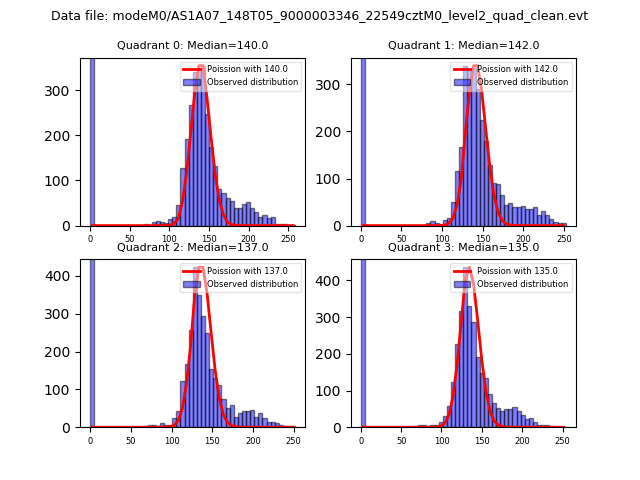 |
 |
| Quadrant-wise count rates Data is divided into 100 sec bins |
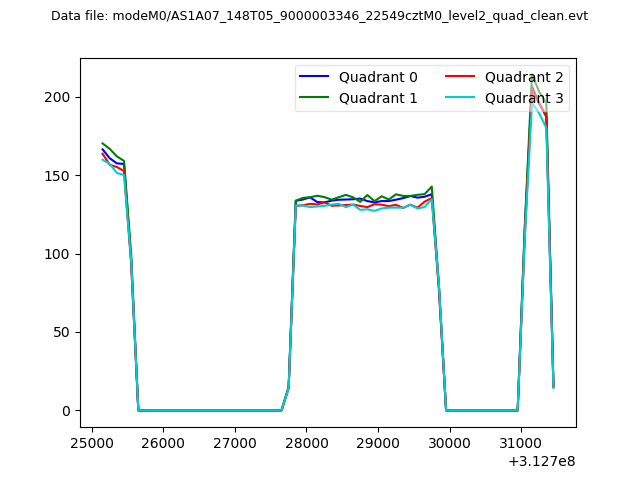 |
|
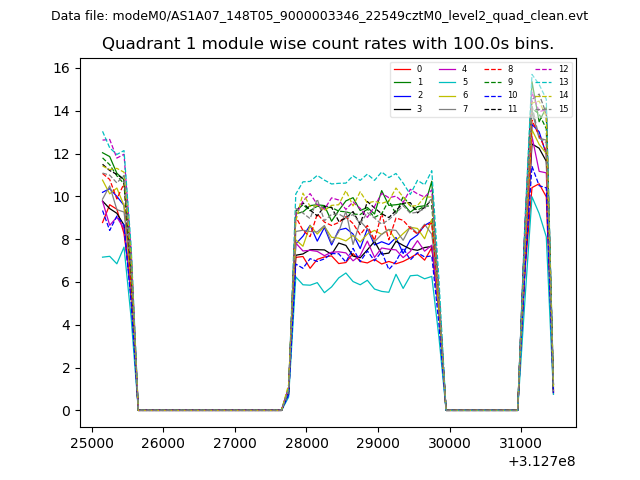
| Module-wise count rates for Quadrant A Data is divided into 100 sec bins |
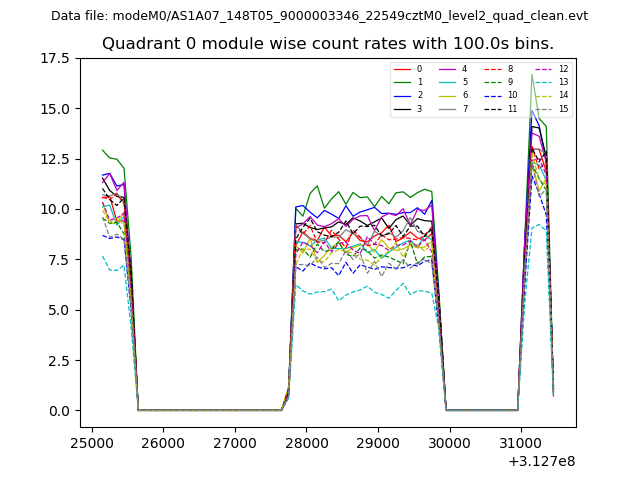 |
 |
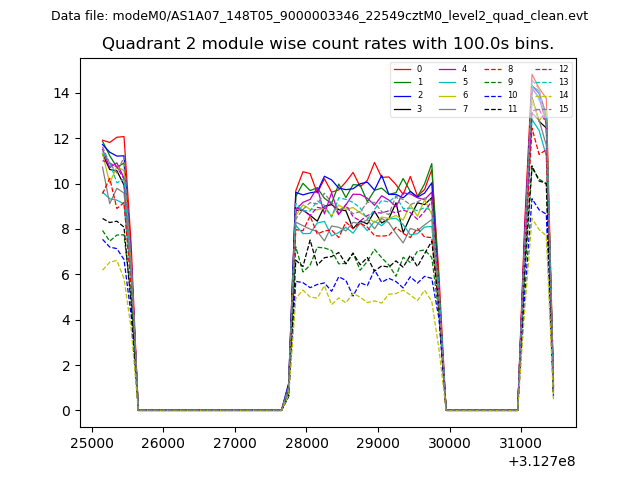
| Module-wise count rates for Quadrant B Data is divided into 100 sec bins |
 |
 |
| Module-wise count rates for Quadrant C Data is divided into 100 sec bins |
 |
 |
| Module-wise count rates for Quadrant D Data is divided into 100 sec bins |
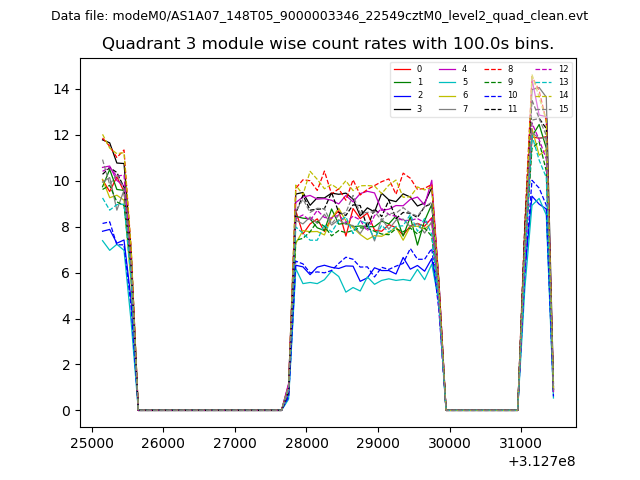 |
 |
| Parameter | Plot |
|---|---|
| CZT HV Monitor | 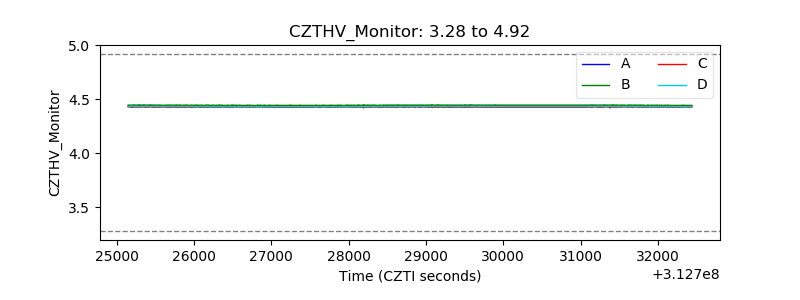 |
| D_VDD | 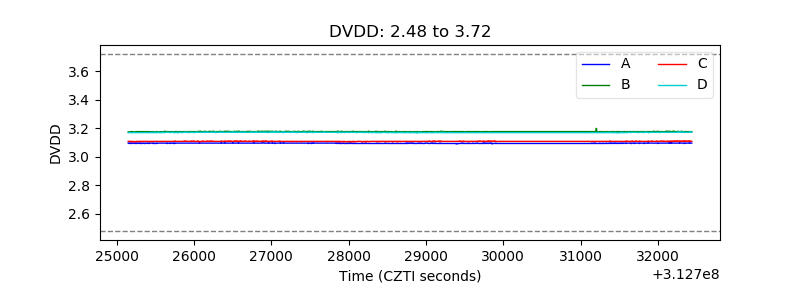 |
| Temperature 1 | 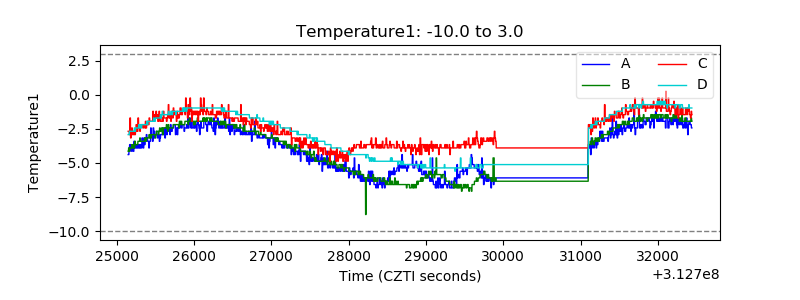 |
| Veto HV Monitor | 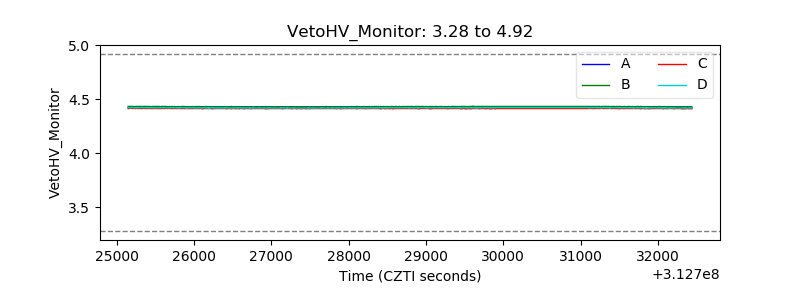 |
| Veto LLD | 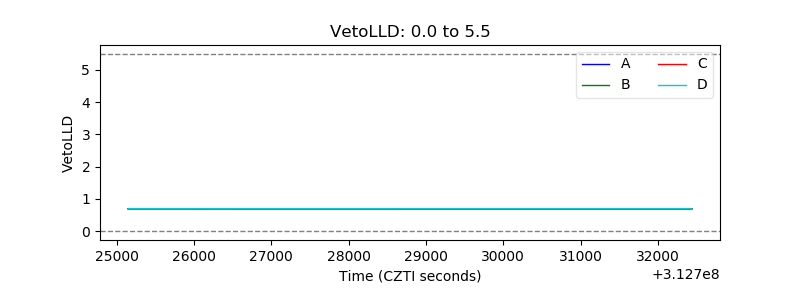 |
| Alpha Counter | 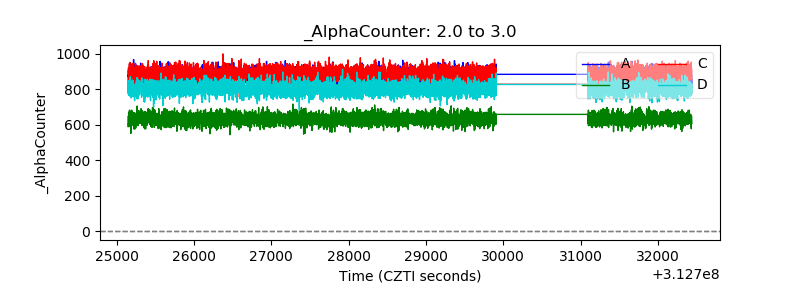 |
| _CPM_Rate | 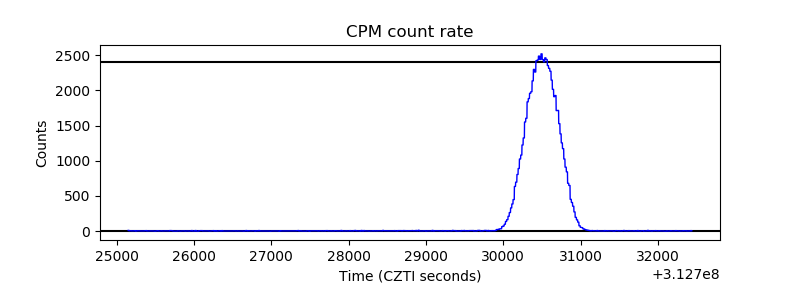 |
| CZT Counter | 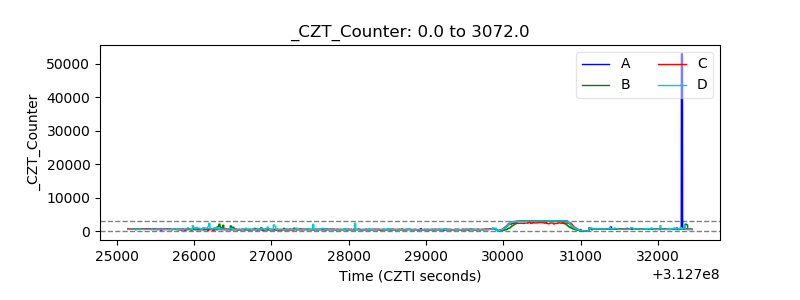 |
| +2.5 Volts monitor | 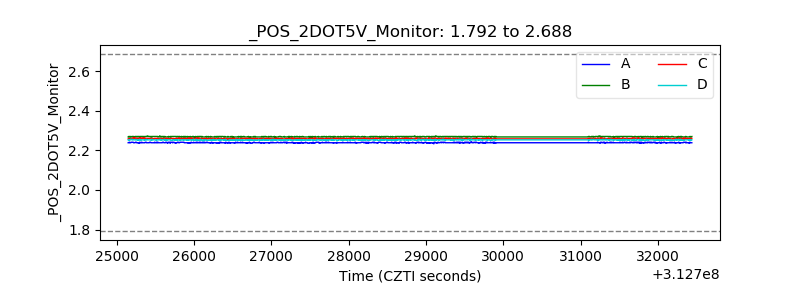 |
| +5 Volts monitor |  |
| _ROLL_ROT | 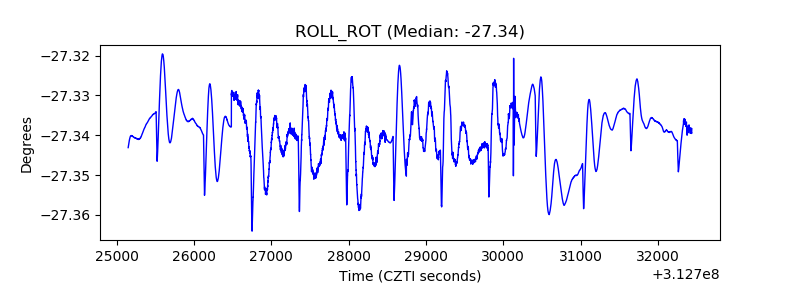 |
| _Roll_DEC | 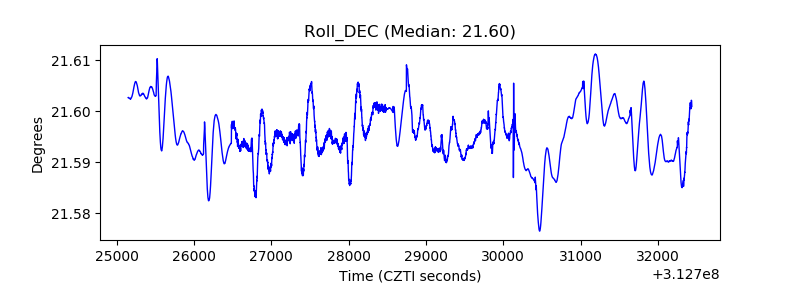 |
| _Roll_RA | 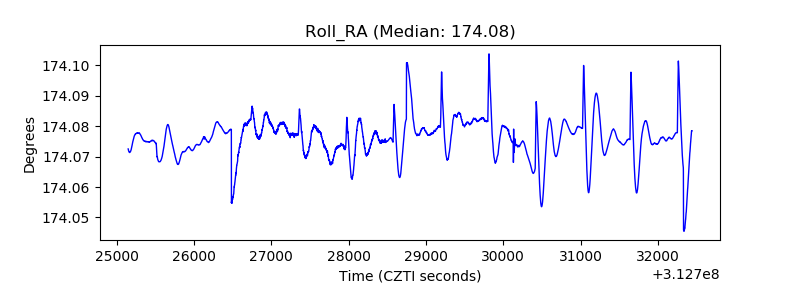 |
| Veto Counter | 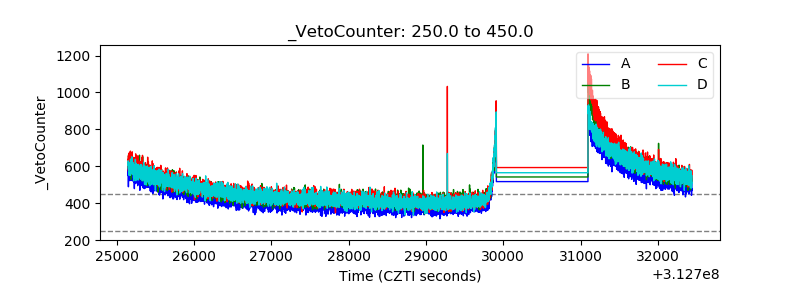 |