| Param | Original file | Final file |
|---|---|---|
| Filename | modeM0/AS1A07_148T05_9000003346_22551cztM0_level2.evt | modeM0/AS1A07_148T05_9000003346_22551cztM0_level2_quad_clean.evt |
| Size (bytes) | 1,243,995,840 | 188,386,560 |
| Size | 1.2 GB | 179.7 MB |
| Events in quadrant A | 8,491,289 | 1,157,758 |
| Events in quadrant B | 9,197,016 | 1,177,605 |
| Events in quadrant C | 8,736,139 | 1,138,950 |
| Events in quadrant D | 10,159,217 | 1,116,512 |
| Mode M9 | |||
|---|---|---|---|
| Quadrant | BADHDUFLAG | Total packets | Discarded packets |
| A | 0 | 39 | 0 |
| B | 0 | 39 | 0 |
| C | 0 | 39 | 0 |
| D | 0 | 39 | 0 |
| Mode M0 | |||
|---|---|---|---|
| Quadrant | BADHDUFLAG | Total packets | Discarded packets |
| A | 0 | 35237 | 3 |
| B | 0 | 37460 | 3 |
| C | 0 | 35944 | 3 |
| D | 0 | 41097 | 3 |
| Mode SS | |||
|---|---|---|---|
| Quadrant | BADHDUFLAG | Total packets | Discarded packets |
| A | 0 | 326 | 0 |
| B | 0 | 326 | 0 |
| C | 0 | 326 | 0 |
| D | 0 | 326 | 0 |
| Quadrant | Total seconds | Saturated seconds | Saturation percentage |
|---|---|---|---|
| A | 16170 | 211 | 1.304886% |
| B | 16170 | 316 | 1.954236% |
| C | 16169 | 303 | 1.873956% |
| D | 16169 | 346 | 2.139897% |
Noise dominated data is calculated using 1-second bins in cleaned event files. If a bin has >2000 counts, and if more than 50% of those come from <1% of pixels, then it is considered to be noise-dominated and hence unusable.
| Quadrant | # 1 sec bins | Bins with >0 counts | Bins with >2000 counts | High rate bins dominated by noise | Noise dominated (total time) | Noise dominated (detector-on time) | Marked lightcurve |
|---|---|---|---|---|---|---|---|
| A | 19930 | 16171 | 0 | 0 | 0.00% | 0.00% | 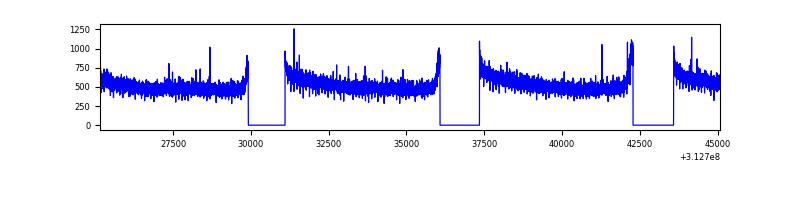 |
| B | 19930 | 16172 | 37 | 37 | 0.19% | 0.23% | 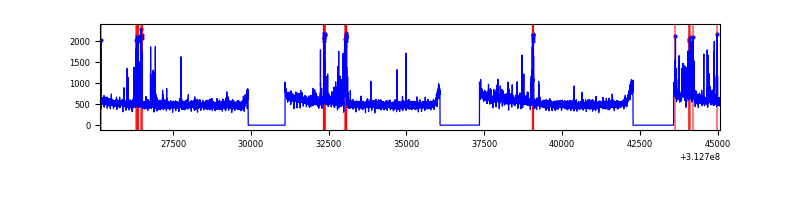 |
| C | 19928 | 16170 | 2 | 2 | 0.01% | 0.01% | 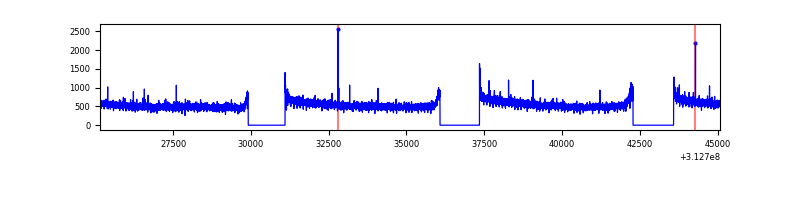 |
| D | 19929 | 16171 | 91 | 91 | 0.46% | 0.56% | 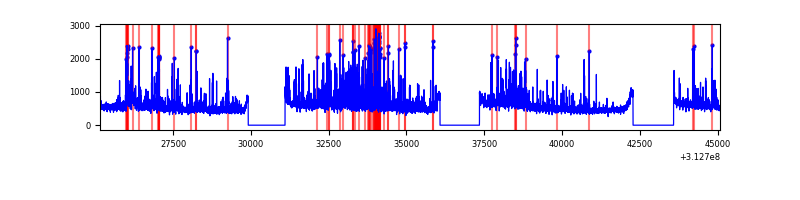 |
Top three noisy pixels from each quadrant. If the there are fewer than three noisy pixels in the level2.evt file, extra rows are filled as -1
| Pixel properties | Quadrant properties | ||||||
|---|---|---|---|---|---|---|---|
| Quadrant | DetID | PixID | Counts | Sigma | Mean | Median | Sigma |
| A | 13 | 254 | 28162 | 59.21 | 2203 | 2162 | 439.1 |
| A | 0 | 226 | 19225 | 38.86 | 2203 | 2162 | 439.1 |
| A | 3 | 137 | 17568 | 35.09 | 2203 | 2162 | 439.1 |
| B | 15 | 33 | 615615 | 1525.62 | 2179 | 2126 | 402.1 |
| B | 12 | 111 | 47462 | 112.74 | 2179 | 2126 | 402.1 |
| B | 11 | 111 | 41984 | 99.12 | 2179 | 2126 | 402.1 |
| C | 14 | 238 | 342233 | 695.4 | 2133 | 2155 | 489.0 |
| C | 0 | 207 | 56731 | 111.6 | 2133 | 2155 | 489.0 |
| C | 0 | 10 | 24135 | 44.94 | 2133 | 2155 | 489.0 |
| D | 1 | 52 | 956533 | 1834.54 | 2158 | 2103 | 520.3 |
| D | 12 | 33 | 678502 | 1300.13 | 2158 | 2103 | 520.3 |
| D | 13 | 172 | 153998 | 291.96 | 2158 | 2103 | 520.3 |
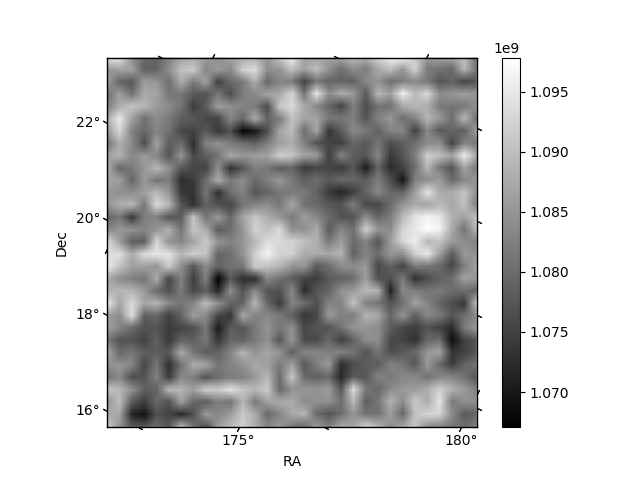
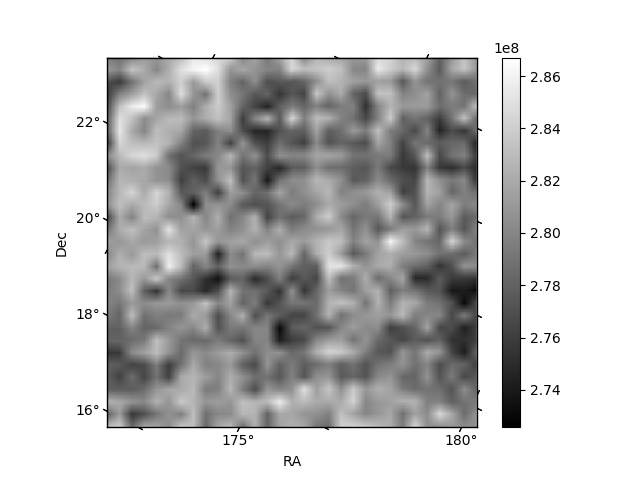
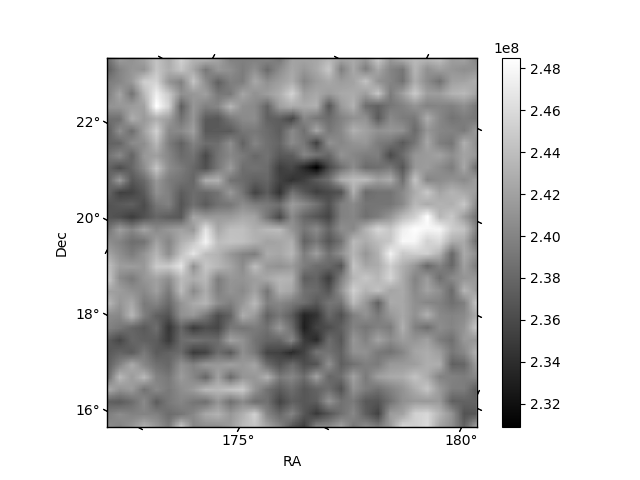
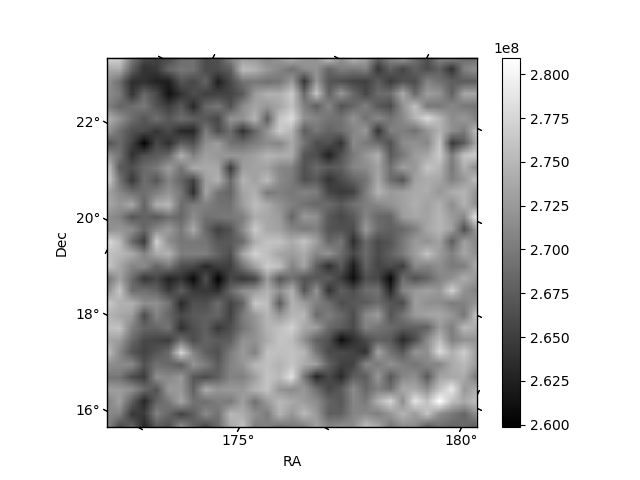
Histogram calculated using DETX and DETY for each event in the final _common_clean file
| Quadrant A | 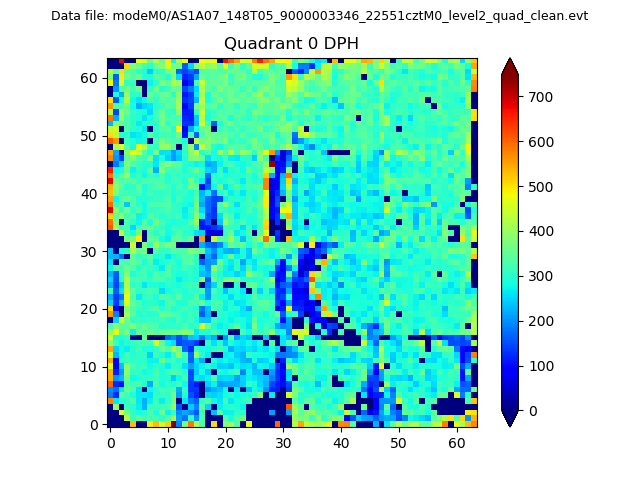 |
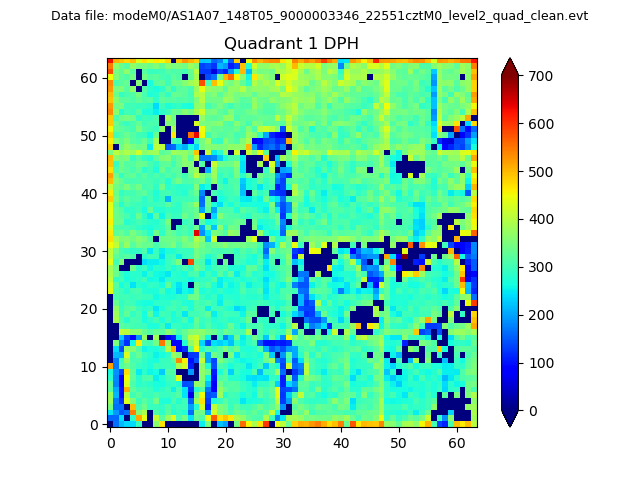 |
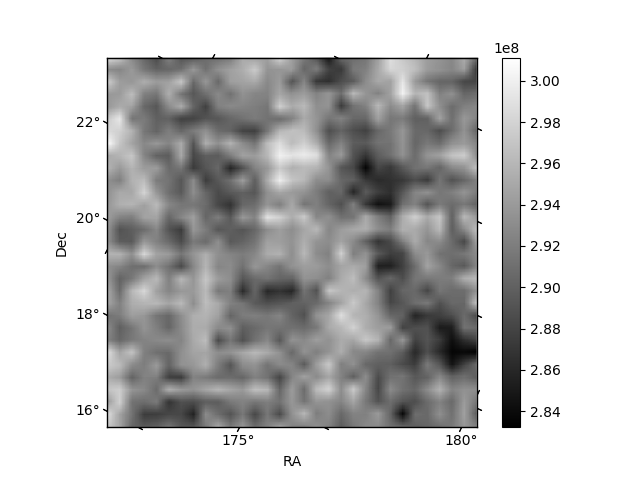
Quadrant B |
|---|---|---|---|
| Quadrant D | 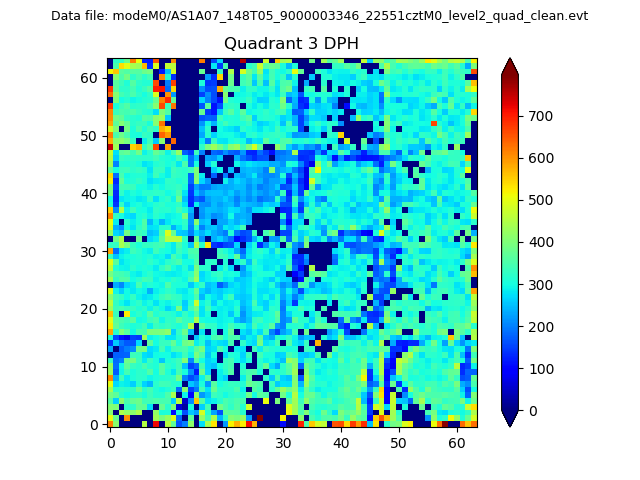 |
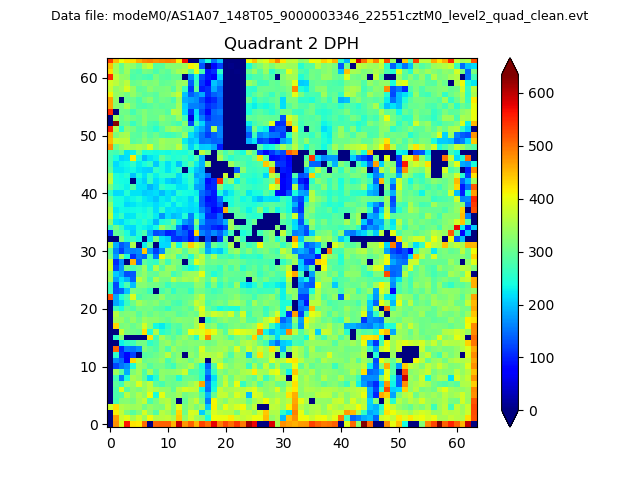 |
Quadrant C |
| Plot type | Count rate plots | Images |
|---|---|---|
| Comparison with Poisson distribution Blue bars denote a histogram of data divided into 1 sec bins. Red curve is a Poisson curve with rate = median count rate of data. |
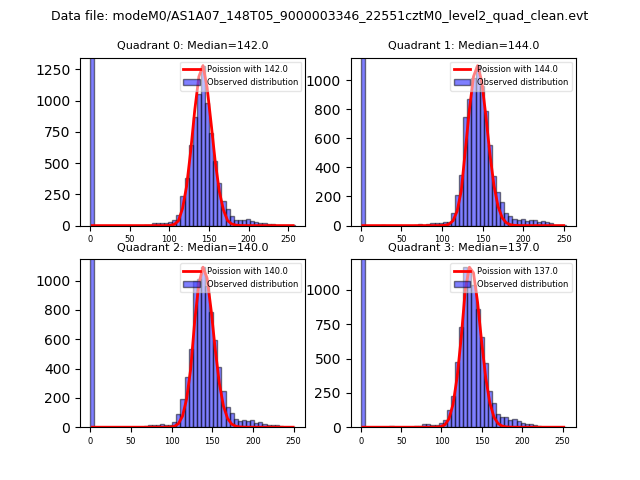 |
 |
| Quadrant-wise count rates Data is divided into 100 sec bins |
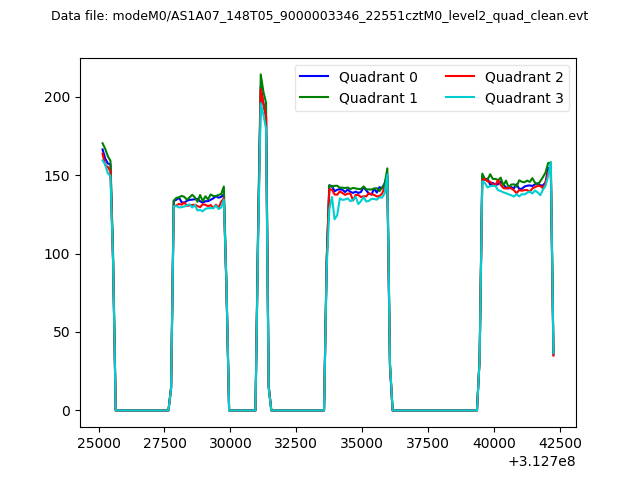 |
|
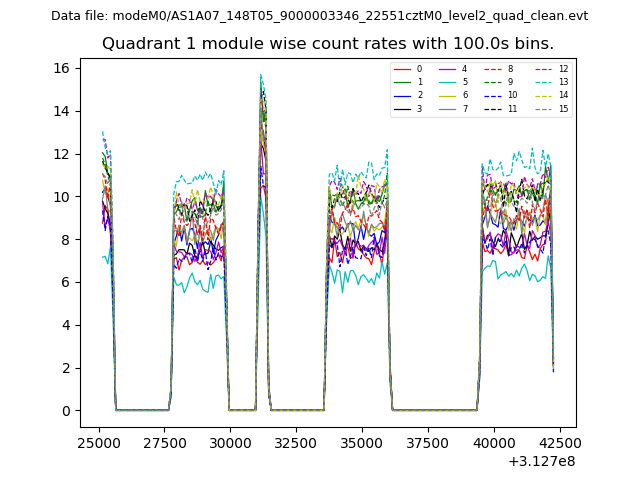
| Module-wise count rates for Quadrant A Data is divided into 100 sec bins |
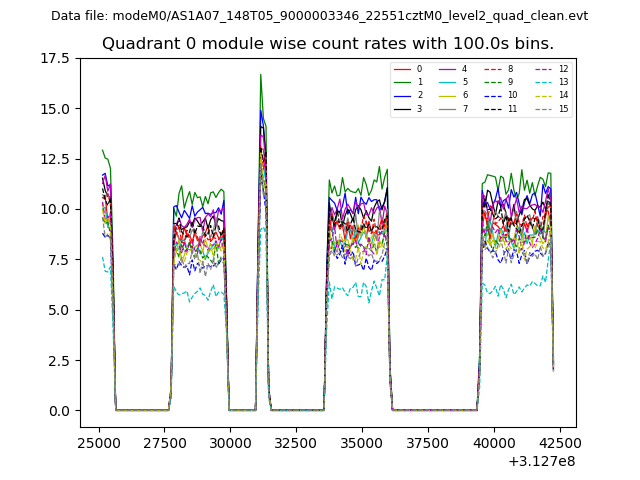 |
 |
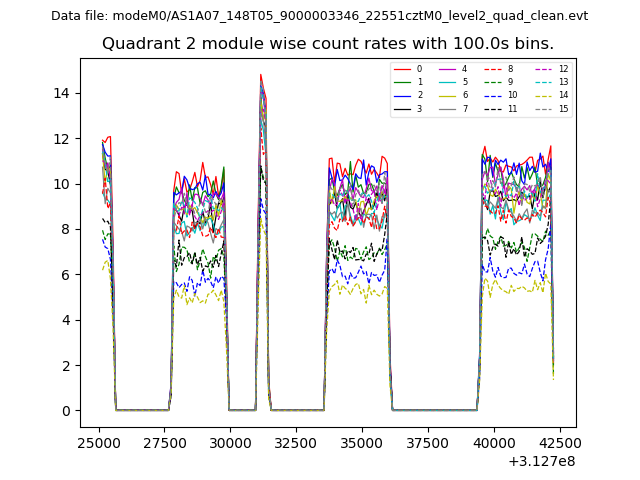
| Module-wise count rates for Quadrant B Data is divided into 100 sec bins |
 |
 |
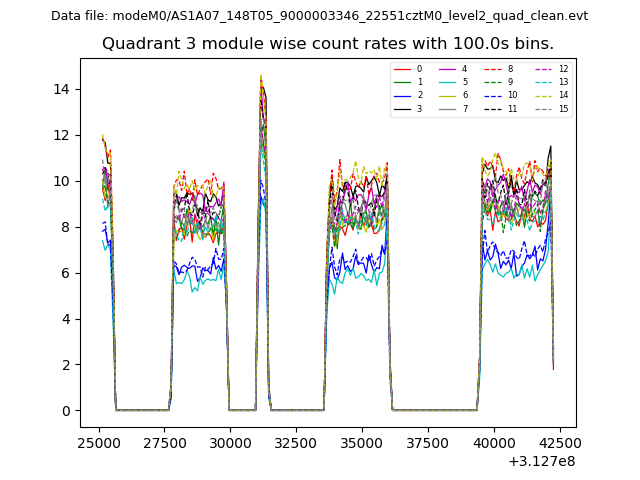
| Module-wise count rates for Quadrant C Data is divided into 100 sec bins |
 |
 |
| Module-wise count rates for Quadrant D Data is divided into 100 sec bins |
 |
 |
| Parameter | Plot |
|---|---|
| CZT HV Monitor | 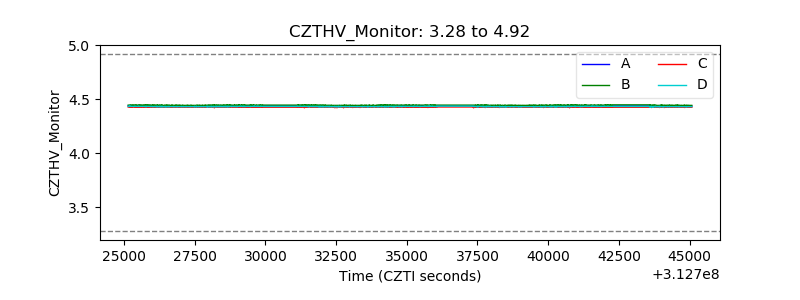 |
| D_VDD | 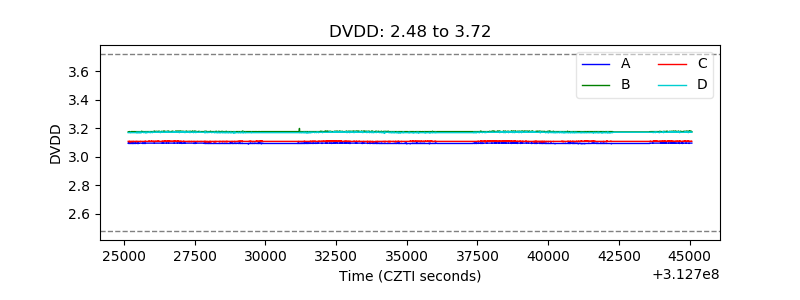 |
| Temperature 1 | 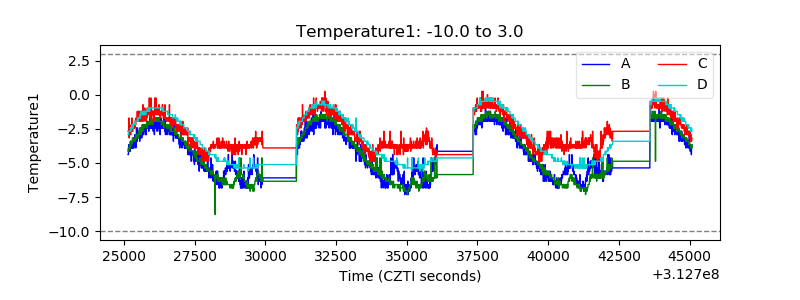 |
| Veto HV Monitor | 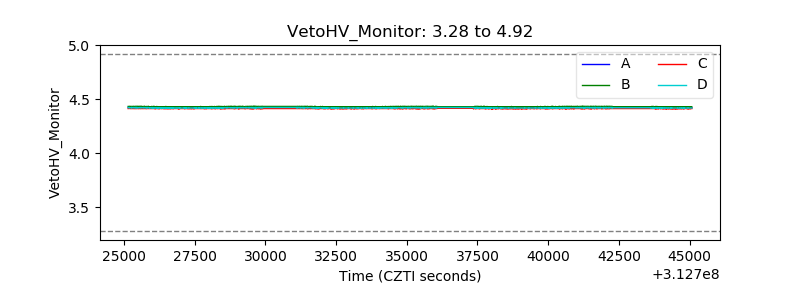 |
| Veto LLD | 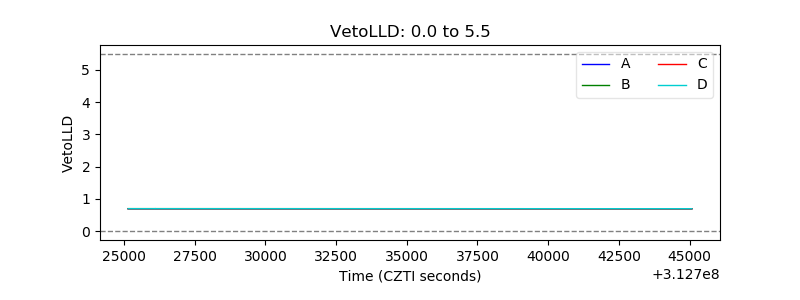 |
| Alpha Counter | 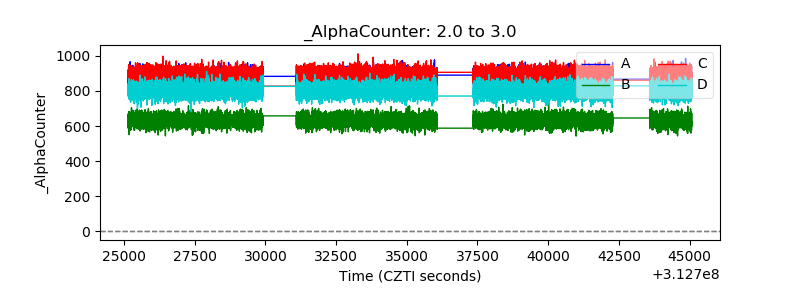 |
| _CPM_Rate | 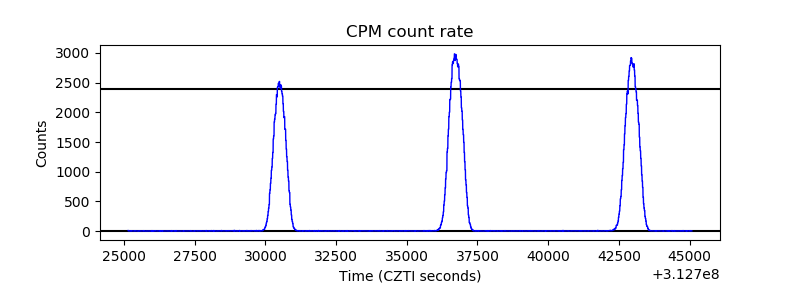 |
| CZT Counter | 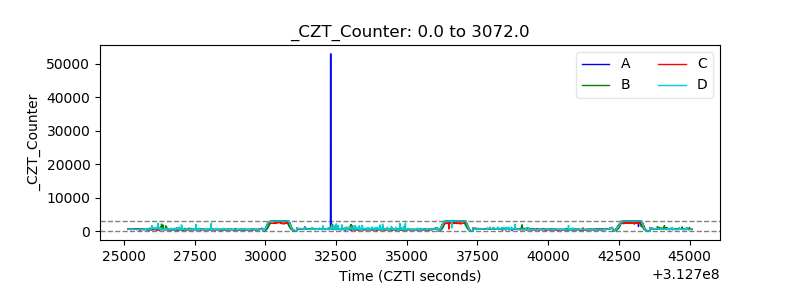 |
| +2.5 Volts monitor |  |
| +5 Volts monitor |  |
| _ROLL_ROT | 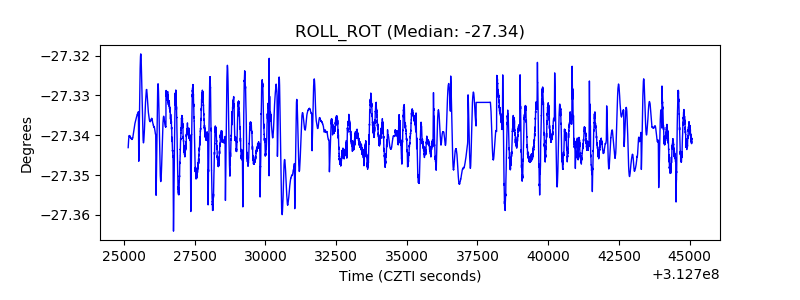 |
| _Roll_DEC | 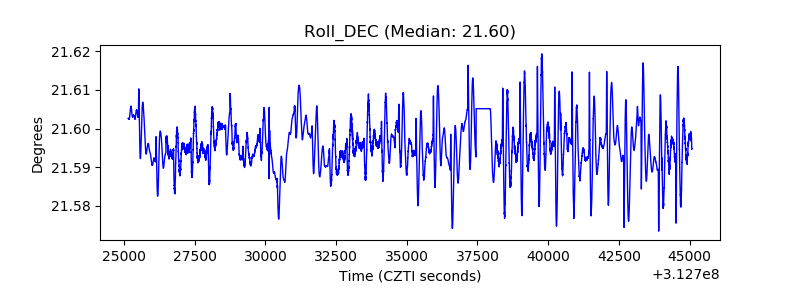 |
| _Roll_RA |  |
| Veto Counter | 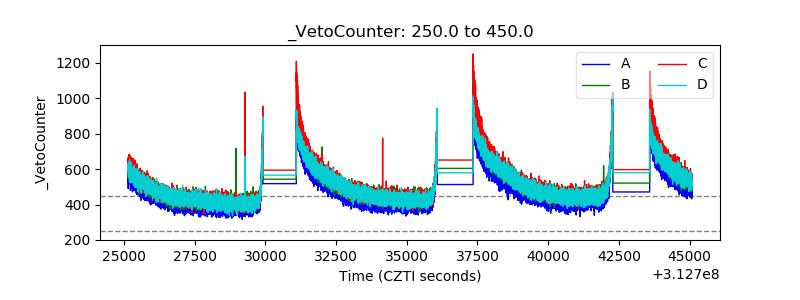 |