| Param | Original file | Final file |
|---|---|---|
| Filename | modeM0/AS1A07_148T05_9000003346_22553cztM0_level2.evt | modeM0/AS1A07_148T05_9000003346_22553cztM0_level2_quad_clean.evt |
| Size (bytes) | 465,540,480 | 86,328,000 |
| Size | 444.0 MB | 82.3 MB |
| Events in quadrant A | 3,268,732 | 544,504 |
| Events in quadrant B | 3,652,940 | 556,525 |
| Events in quadrant C | 3,457,967 | 538,404 |
| Events in quadrant D | 3,286,692 | 530,498 |
| Mode M9 | |||
|---|---|---|---|
| Quadrant | BADHDUFLAG | Total packets | Discarded packets |
| A | 0 | 19 | 0 |
| B | 0 | 20 | 0 |
| C | 0 | 20 | 0 |
| D | 0 | 20 | 0 |
| Mode M0 | |||
|---|---|---|---|
| Quadrant | BADHDUFLAG | Total packets | Discarded packets |
| A | 0 | 13681 | 2 |
| B | 0 | 14922 | 2 |
| C | 0 | 14330 | 2 |
| D | 0 | 13956 | 2 |
| Mode SS | |||
|---|---|---|---|
| Quadrant | BADHDUFLAG | Total packets | Discarded packets |
| A | 0 | 130 | 0 |
| B | 0 | 130 | 0 |
| C | 0 | 130 | 0 |
| D | 0 | 130 | 0 |
| Quadrant | Total seconds | Saturated seconds | Saturation percentage |
|---|---|---|---|
| A | 6366 | 69 | 1.083883% |
| B | 6365 | 175 | 2.749411% |
| C | 6365 | 165 | 2.592302% |
| D | 6365 | 63 | 0.989788% |
Noise dominated data is calculated using 1-second bins in cleaned event files. If a bin has >2000 counts, and if more than 50% of those come from <1% of pixels, then it is considered to be noise-dominated and hence unusable.
| Quadrant | # 1 sec bins | Bins with >0 counts | Bins with >2000 counts | High rate bins dominated by noise | Noise dominated (total time) | Noise dominated (detector-on time) | Marked lightcurve |
|---|---|---|---|---|---|---|---|
| A | 7531 | 6367 | 0 | 0 | 0.00% | 0.00% | 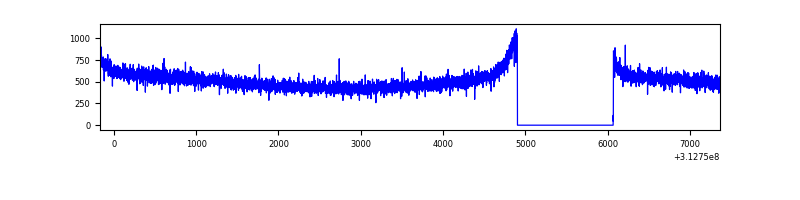 |
| B | 7530 | 6366 | 17 | 17 | 0.23% | 0.27% | 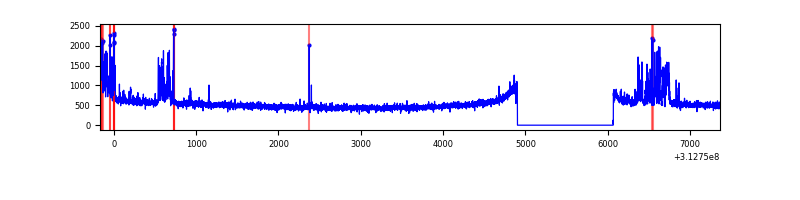 |
| C | 7530 | 6366 | 3 | 3 | 0.04% | 0.05% | 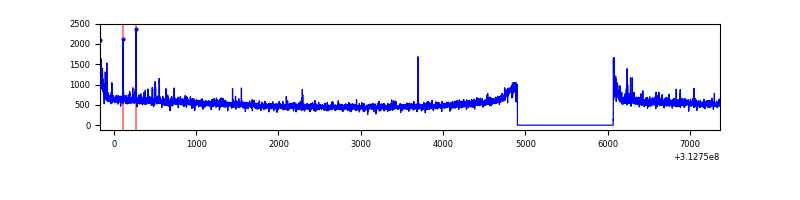 |
| D | 7530 | 6366 | 6 | 6 | 0.08% | 0.09% | 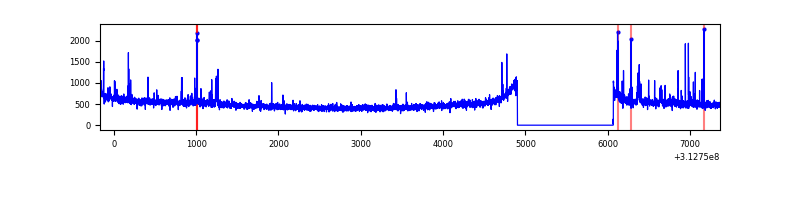 |
Top three noisy pixels from each quadrant. If the there are fewer than three noisy pixels in the level2.evt file, extra rows are filled as -1
| Pixel properties | Quadrant properties | ||||||
|---|---|---|---|---|---|---|---|
| Quadrant | DetID | PixID | Counts | Sigma | Mean | Median | Sigma |
| A | 13 | 254 | 10342 | 56.52 | 847 | 831 | 168.3 |
| A | 0 | 226 | 7337 | 38.67 | 847 | 831 | 168.3 |
| A | 3 | 137 | 7107 | 37.3 | 847 | 831 | 168.3 |
| B | 15 | 33 | 356535 | 2248.8 | 840 | 822 | 158.2 |
| B | 12 | 111 | 18584 | 112.29 | 840 | 822 | 158.2 |
| B | 11 | 111 | 16447 | 98.78 | 840 | 822 | 158.2 |
| C | 14 | 238 | 131475 | 681.49 | 823 | 832 | 191.7 |
| C | 0 | 207 | 83610 | 431.81 | 823 | 832 | 191.7 |
| C | 0 | 10 | 36151 | 184.24 | 823 | 832 | 191.7 |
| D | 13 | 249 | 57764 | 278.76 | 834 | 810 | 204.3 |
| D | 13 | 172 | 29888 | 142.32 | 834 | 810 | 204.3 |
| D | 2 | 234 | 26426 | 125.38 | 834 | 810 | 204.3 |
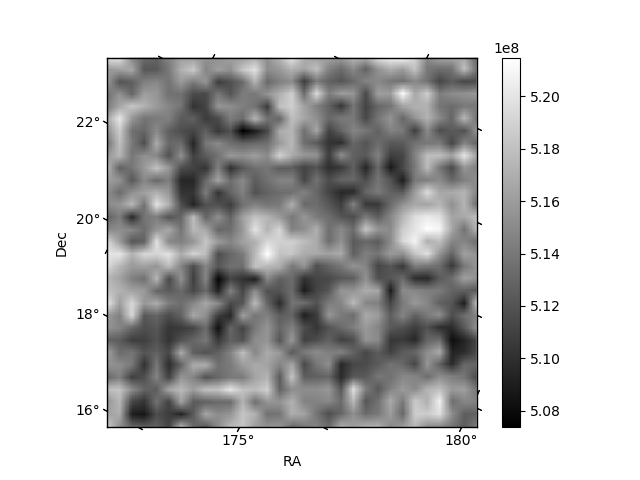
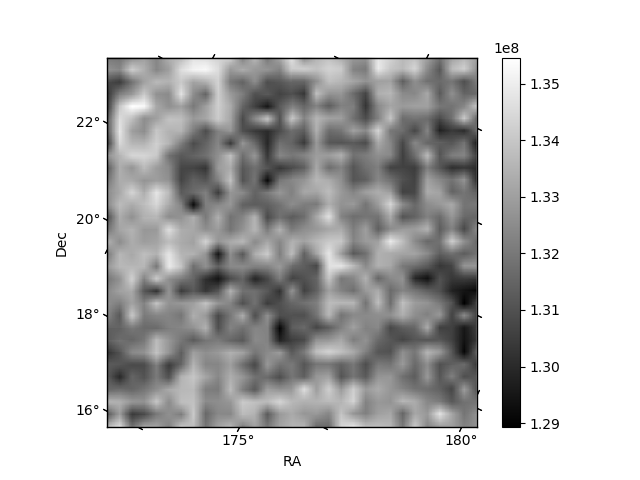
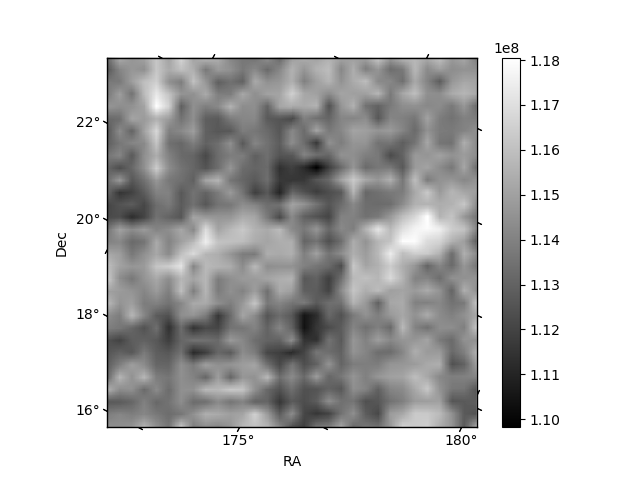
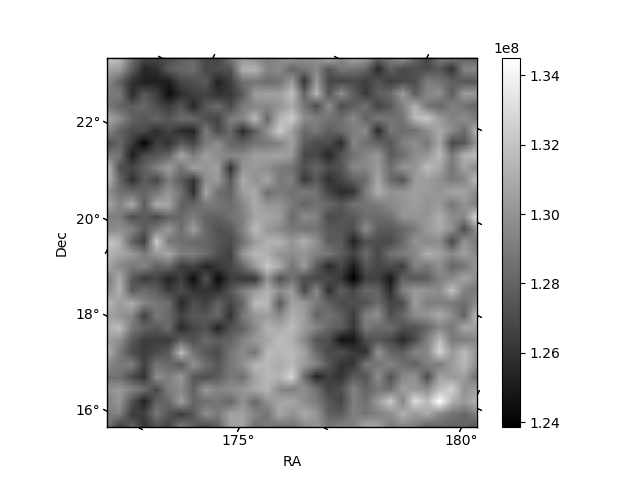
Histogram calculated using DETX and DETY for each event in the final _common_clean file
| Quadrant A | 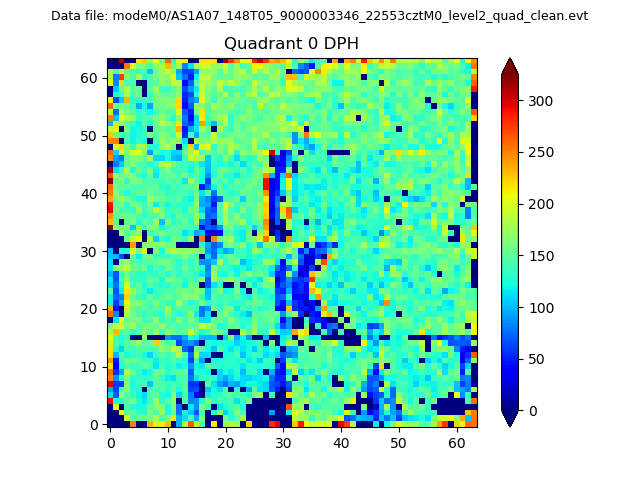 |
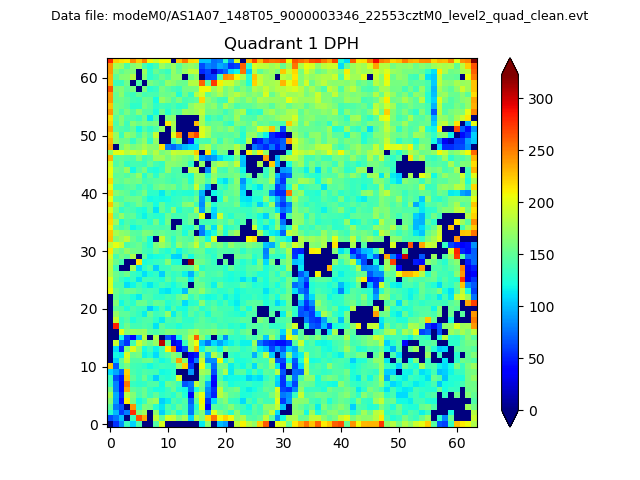 |
Quadrant B |
|---|---|---|---|
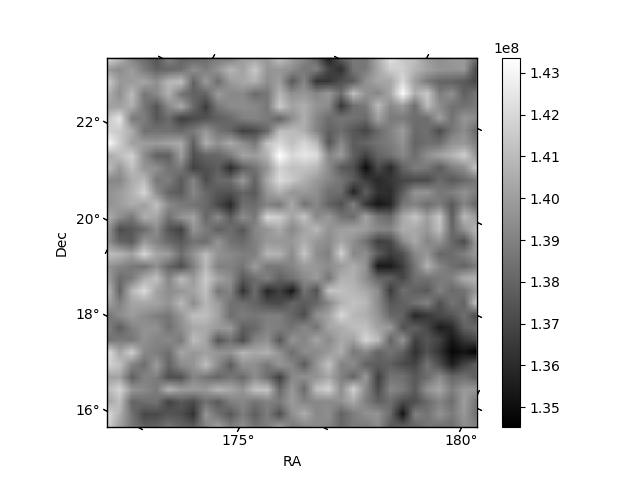
| Quadrant D | 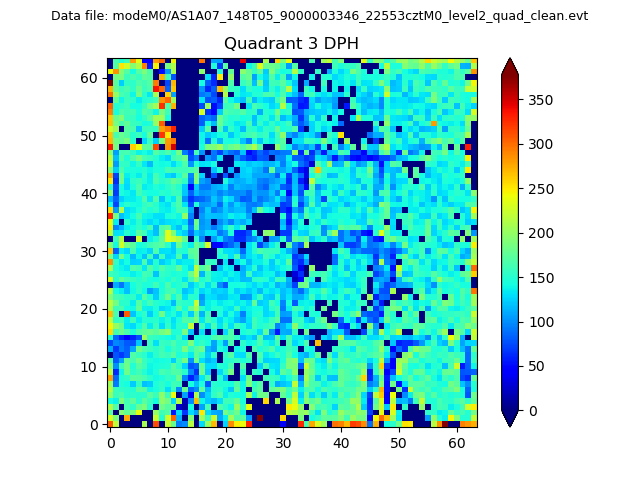 |
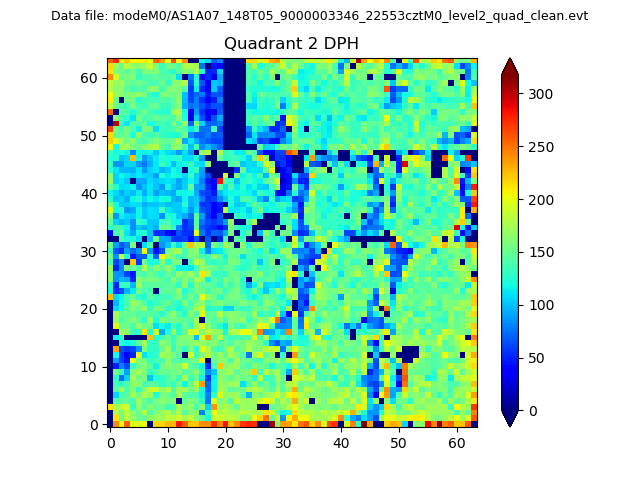 |
Quadrant C |
| Plot type | Count rate plots | Images |
|---|---|---|
| Comparison with Poisson distribution Blue bars denote a histogram of data divided into 1 sec bins. Red curve is a Poisson curve with rate = median count rate of data. |
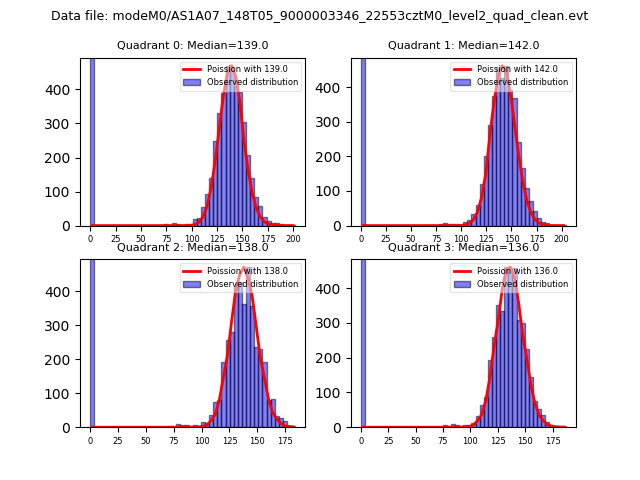 |
 |
| Quadrant-wise count rates Data is divided into 100 sec bins |
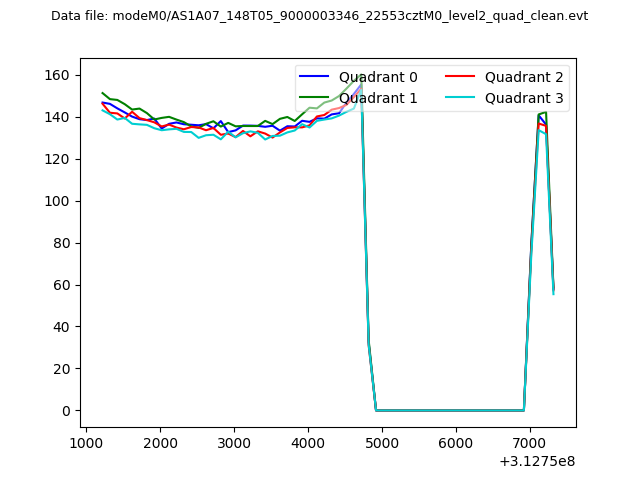 |
|
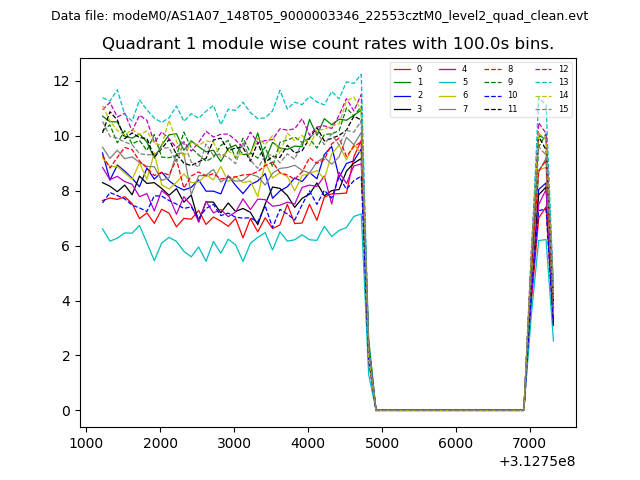
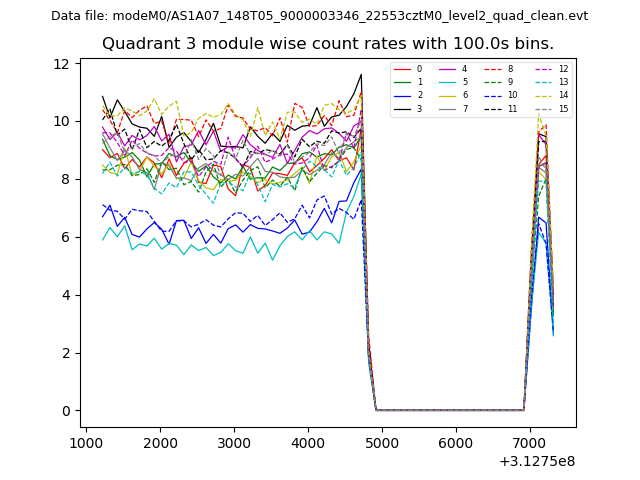
| Module-wise count rates for Quadrant A Data is divided into 100 sec bins |
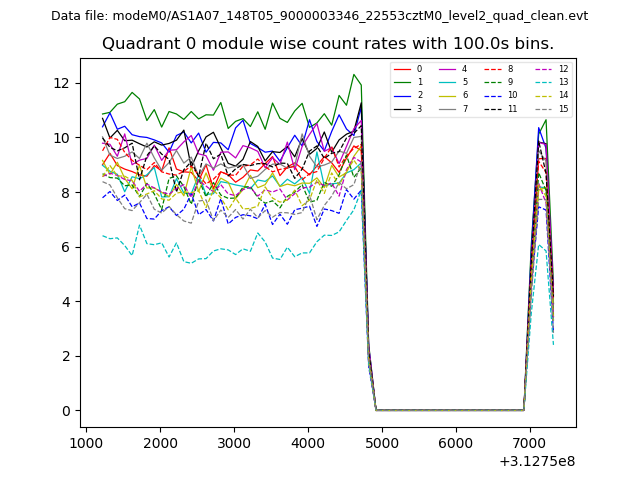 |
 |
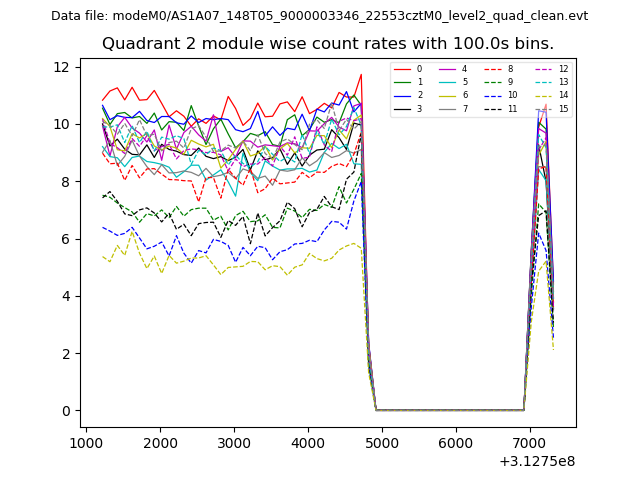
| Module-wise count rates for Quadrant B Data is divided into 100 sec bins |
 |
 |
| Module-wise count rates for Quadrant C Data is divided into 100 sec bins |
 |
 |
| Module-wise count rates for Quadrant D Data is divided into 100 sec bins |
 |
 |
| Parameter | Plot |
|---|---|
| CZT HV Monitor |  |
| D_VDD | 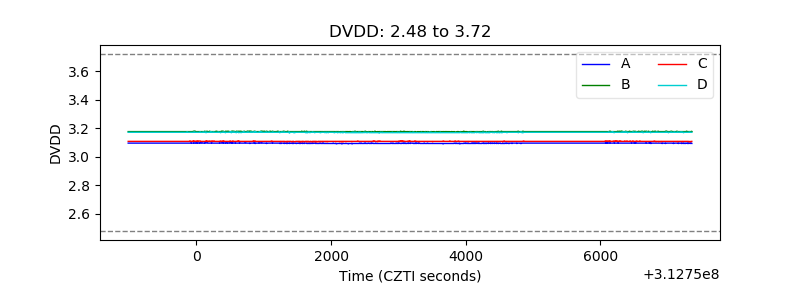 |
| Temperature 1 | 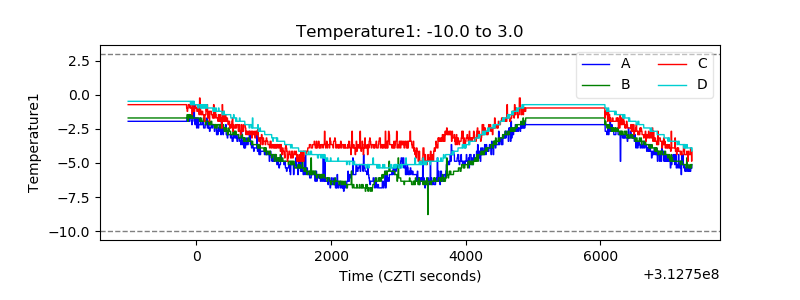 |
| Veto HV Monitor |  |
| Veto LLD | 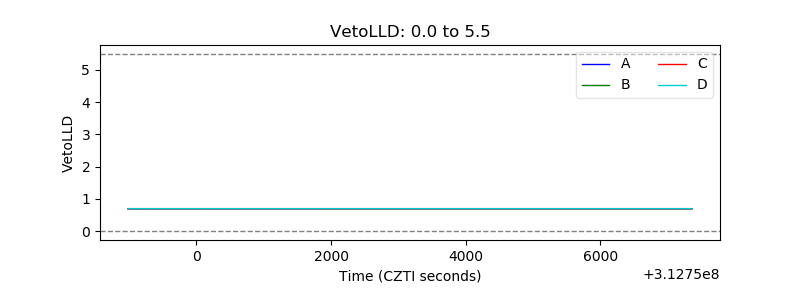 |
| Alpha Counter | 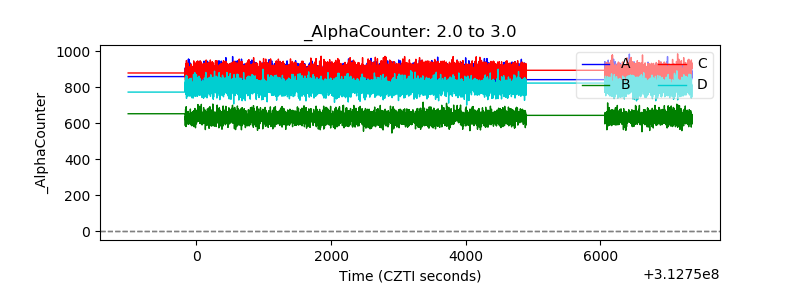 |
| _CPM_Rate | 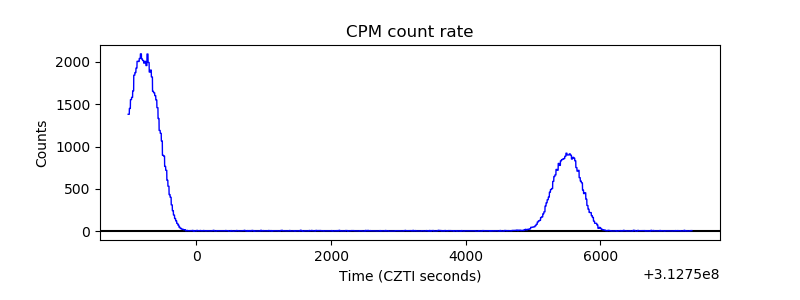 |
| CZT Counter | 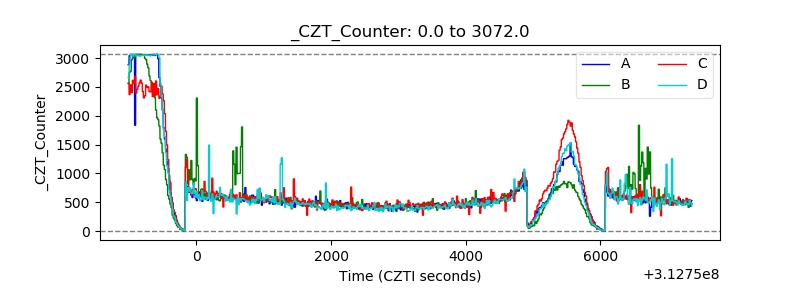 |
| +2.5 Volts monitor |  |
| +5 Volts monitor |  |
| _ROLL_ROT | 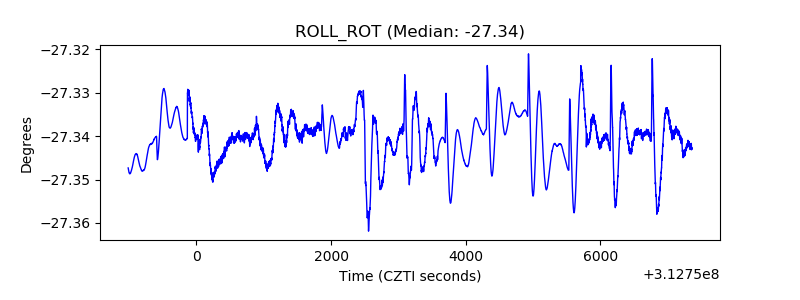 |
| _Roll_DEC | 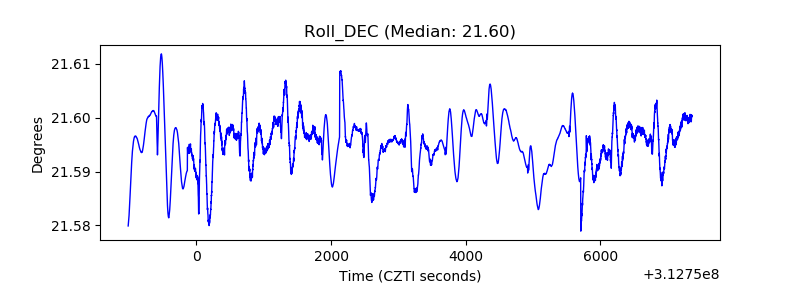 |
| _Roll_RA | 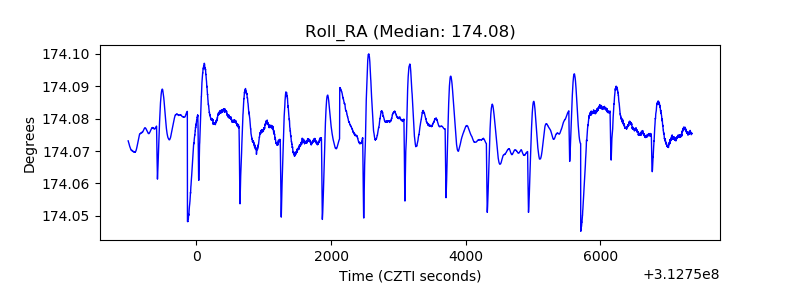 |
| Veto Counter | 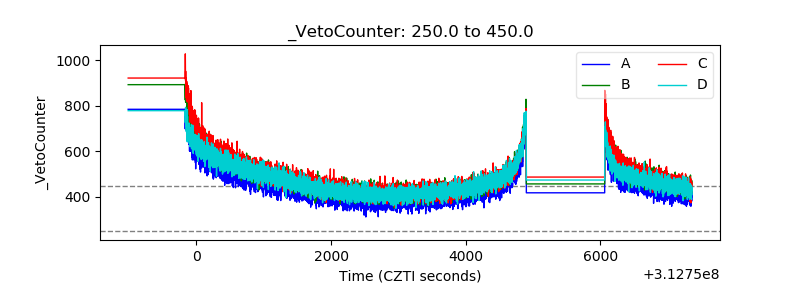 |